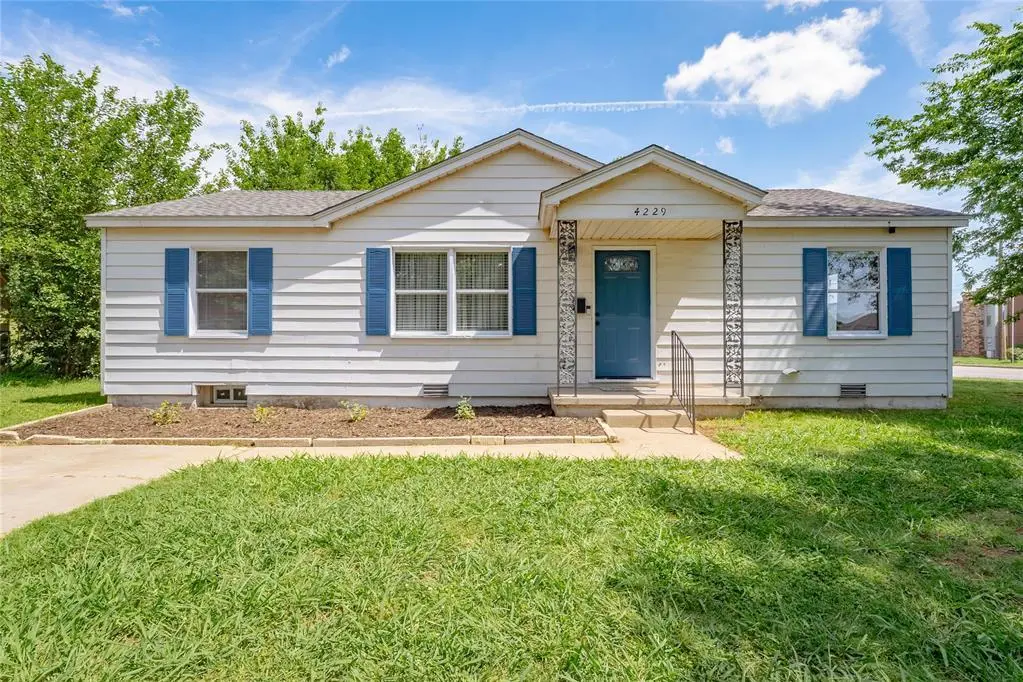
4229 SE 47th St · Oklahoma City, OK
Flood risk 1/10 · Minimal
- FEMA flood zone
- X (unshaded)
- Chance of flooding over 30 yrs
- 0.0%
- Est. flood insurance / yr
- $507 – $1,088
Fire risk 1/10 · Minimal
- Est. fire insurance / yr
- $2,463 – $4,575
Heat risk 6/10 · Moderate
- Hot days now (above 107°F)
- 7 days/yr
- Hot days in 30 yrs
- 19 days/yr
Wind risk 2/10 · Minimal
- Chance of severe wind over 30 yrs
- 4.0%
Air-quality risk 2/10 · Minimal
- Unhealthy air days now
- 1 days/yr
- Unhealthy air days in 30 yrs
- 3 days/yr
Risk factors via First Street. Map © Google.
Why this score? — see what drove the C- grade
The composite is a weighted blend of 9 inputs, each scored 0–100. Each bar is that input's sub-score; the figure is the points it added to the 100-point composite (weight × sub-score).
- Cash flow +20.9/30.0
- ARV discount +7.5/15.0
- DSCR +6.7/10.0
- 1% rule +5.1/10.0
- Livability +4.0/5.0
- Rent growth +3.7/5.0
- Condition / age +2.5/5.0
- Schools +1.2/10.0
- Appreciation +0.0/10.0
$164,999
🖨 Deal sheet (PDF) 📄 Offer letter ✓ Due diligence
Listing remarks MLS
Fully remodeled in 2021, this home has granite countertops, tile backsplash, vinyl plank flooring, tile tub surround, and neutral gray walls. Spacious, separate laundry space. The large detached garage has separate access from Sunnylane Rd. Large and fully fenced backyard. Owner licensee # 182797.
Key facts
- Finished basement
- Granite countertops
- Detached garage
Tags
Property features AI
Finance
- Other: Located in Bales Blks 6 Thru 9 (legal addition)
- Financial info: Not assumable; Financing qualifies
- HOA & community: No mandatory association dues
Exterior
- Parking: Additional parking; Concrete parking; 2-car garage
- Utilities: Homestead eligible
- Home design: Single family residence; Residential property; One story; Existing property
- Construction: Aluminum siding; Frame construction; Vinyl siding; Composition roof (roof updated in 2021); Conventional foundation
- Exterior features: Outbuildings; Rain gutters; Combination fencing; Corner lot
Interior
- Bedrooms: 4 bedrooms
- Bathrooms: 1 full bathroom
- Interior features: One-level living; Living area; Dining area
Neighborhood map
What this means for you Summary
Snapshot
- This is a 4-bed/1.0-bath single-family listed at $165k.
Deal economics
- At list price, monthly cash flow is $231 ($3k/yr) — positive.
- The deal already cash-flows at list — no discount required.
- Meets the 1% rule at list price ($2k rent vs $165k).
- Cap rate 8.0% vs local median 3.7% in Oklahoma City — top-decile yield for the area; either an underpriced asset or a hidden risk that comps aren't pricing in. Stress-test before assuming the spread holds.
Location & tenants
- Location reads 80/100 on livability (#3 in OK, #1,635 nationally) — a professional / high-income tenant draw. Strengths: amenities A+, commute A+, cost of living A+; Watch: crime F.
- Midwest City-Del City (suburban): math 10% / reading 17% proficiency, ranked #231 of 270 in OK (top 86%) — low school quality limits family demand, transient renter base, plan for 1-2y turnover.
- Zoned schools: Townsend Es (math 8% / reading 17%, grade F, #652 of 845 statewide, top 79%, 459 students, 0% FRL); Del City Ms (math 4% / reading 11%, grade F, #306 of 345 statewide, top 90%, 925 students, 0% FRL); Del City Hs (math 5% / reading 15%, grade F, #361 of 447 statewide, top 94%, 1,158 students, 0% FRL) — zoned schools average 0% FRL vs 57% district-wide (57 pts lower); this property's tenant base skews higher-income than the district average.
- Market conditions: Rents rising fast (+4.8%/yr); 93 active listings in the ZIP; 2 comparable units currently listed for rent nearby; 5,365 units permitted in Oklahoma County in 2024 (569 in 5+ unit buildings).
- This rent runs 32% of the median local income ($63k/yr) — at the standard rent-burdened threshold; future hikes will face affordability resistance.
Forward outlook
- Local home prices are declining (-3.0%/yr); year-one equity from $1k of loan paydown is wiped out by about $5k of value loss. Plan a longer hold.
- Oklahoma County population projected at +41% by 2050 — long-run rental-demand tailwind backs the buy-and-hold thesis.
Negotiation context
- Only 11 days on market — expect competitive offers; lowballing is unlikely to land.
- 3 sale attempts since 21y ago with the ask held roughly flat each time — persistent listings suggest the price (not the market) is what's stuck; bring a comps-based counter.
- Current owner paid $122k; 35% above their basis — modest negotiation headroom, anchor on the comps not their cost.
Risks & watch-outs
- Watch-outs: built in 1957 — expect roof / HVAC / electrical / plumbing capex.
- Climate carrying-cost: extreme-heat days projected 7→19/yr by 2055 (HVAC capex compounding) — expect insurance premiums to compound above CPI over the hold.
Questions for the listing agent
- Built in 1957 — when were the roof, HVAC, electrical panel, plumbing, and water heater last replaced?
- Is there a deadline driving the sale (1031 exchange, divorce, estate, relocation)? That informs how much negotiation room exists.
- Schools are F-rated, which usually means shorter tenancies and higher turnover. Who's the typical renter profile here, and what's been the actual vacancy rate?
- Crime grade is F in this area — have there been break-ins, vandalism, or insurance claims at this property in the last 3 years? What carrier currently insures it and at what premium?
- What's the average days-on-market for RENTAL listings here right now (not sales)? A rising rental-DOM trend means longer vacancies and softer asking-rent achievability than the comps imply.
- What's the recent tenant-quality profile in this submarket — average credit score on applications, eviction rate, late-payment / NSF rate, and stable-employment percentage? A property-management company in the area should have these aggregated.
- How much new for-sale + rental construction is in the pipeline within 1–3 miles? Heavy new supply typically softens prices + rents 12–24 months out; constrained supply supports both.
Investment metrics
- 1% rule
- 1.01% ✓
- Cap rate
- 7.97%
- Cash-on-cash
- 5.99%
- DSCR
- 1.27
- GRM
- 8.2
CMA / ARV
- ARV (on-the-fly)
- $95,976
- Comps found
- 3
Show comp detail 3 sales within ~0.75 mi
| Address | Dist | Beds/Ba | Sqft | Sold | Price | $/sf | Match |
|---|---|---|---|---|---|---|---|
| 4112 SE 42nd St | 0.37mi | 3/1.0 (-1) | 840 (+13%) | 19mo | $129,000 | $154 | 40 |
| 4321 SE 55 St | 0.43mi | 3/1.0 (-1) | 840 (+13%) | 22mo | $50,000 | $60 | 35 |
| 4321 SE 39th St | 0.61mi | 3/1.0 (-1) | 840 (+13%) | 19mo | $108,000 | $129 | 30 |
Match score weights: distance 35% · size 25% · config 20% · recency 20%. Top-matched comps best support the ARV.
Projected returns pro-forma
-3.0% appreciation · 4.76% rent growth · sell at horizon
- IRR
- -5.2%
- Equity multiple
- 0.80×
- Total profit
- $-9,033
- Equity at exit
- $24,602
- IRR
- 6.4%
- Equity multiple
- 1.52×
- Total profit
- $23,845
- Equity at exit
- $14,266
Cash invested: $46,200 (down + closing). Projections, not guarantees.
Landlord ↔ Tenant lean methodology
- Overall (STATE)
- 83 Strongly Landlord-Friendly
- State Oklahoma
- 83 Strongly Landlord-Friendly · R+20
- County
- — inherits STATE
- City
- — inherits STATE
ZIP-level market 73135
- Home prices YoY
- -8.0%
- Rents YoY
- 4.8%
- Active inventory
- 93
- Price-to-rent
- 8.2×
Monthly cashflow live
- Estimated rent
- $1,671 medium interval (Pro) →
- Mortgage (P&I)
- −$865
- Tax from tax record
- −$155 /mo · $1,863/yr
- Insurance
- −$69
- HOA
- −$0
- Vacancy / Maint / Mgmt
- −$351
- Net cashflow
- $231
Break-even live
Sensitivity live
| Price | -10% $324 | -5% $277 | +0% $231 | +5% $184 | +10% $137 |
|---|---|---|---|---|---|
| Rent | -10% $99 | -5% $165 | +0% $231 | +5% $297 | +10% $363 |
| Rate | -1.0pp $314 | -0.5pp $273 | base $231 | +0.5pp $188 | +1.0pp $145 |
UW: 25.0% down · 7.5% · 30yr · 1.5% tax · 5.0% vac · 8.0% maint · 8.0% mgmt
Financing live
Cash to close
- Down payment
- $41,250
- Closing costs
- $4,950
- Reserves months
- —
- Total cash needed
- —
Loan-product check · same deal, 3 products live
Conventional
25% down · 7.5% · 30yr
- Down + closing
- —
- Monthly P&I
- —
- Monthly cashflow
- —
- DSCR
- —
- Eligible?
- —
Personal DTI + credit; lowest rate.
DSCR
20% down · 8.5% · 30yr
- Down + closing
- —
- Monthly P&I
- —
- Monthly cashflow
- —
- DSCR
- —
- Eligible?
- —
No personal income docs; deal must DSCR.
Hard money
10% down · 12.0% · 12mo
- Down + closing
- —
- Monthly P&I
- —
- Monthly cashflow
- —
- DSCR
- —
- Eligible?
- —
Short-term bridge; refi at stabilization.
Rent comps 2 comps
| Address | Beds | Baths | Sqft | Rent | $/sqft | DOM | Units | Dist |
|---|---|---|---|---|---|---|---|---|
| 4128 SE 43rd St Oklahoma City, OK | 3.0 | 1.0 | 620 | $1,275 | $2.06 | 25d | 1 | 0.27mi |
| 5707 SE 48th St Oklahoma City, OK | 1.0–3.0 | 1.0–2.0 | 899 | $1,363 | $1.52 | 3d | 6 | 1.18mi |
Listing history 10 events
-
2026-06-21statusdays on market $164,999 Pending 11 DOM
-
2026-06-18days on market $164,999 Active 10 DOM
-
2026-06-17price $164,999 Active 9 DOM
-
2026-06-17days on market $165,000 Active 9 DOM
-
2026-06-16days on market $165,000 Active 8 DOM
-
2026-06-15days on market $165,000 Active 7 DOM
-
2026-06-13days on market $165,000 Active 5 DOM
-
2026-06-13days on market $165,000 Active 4 DOM
-
2026-06-08remarks 699-char remark
-
2026-06-08$165,000 Active 1 DOM
ⓘ Source: listings_history table (triggers on properties + properties_extension) + one-shot
backfill from property_details.listing_events for pre-trigger history.
Tax reassessment forecast OK · Resets to sale price
- Current annual tax
- $1,863 · $155/mo
- Projected year-2 tax
- $1,863 · $155/mo
- Expected delta
- $0/yr ($0/mo · -0.0%)
ⓘ Screening estimate from a state-policy table — verify with the county assessor before closing.
Climate risk First Street
- Flood 1/10 Low FEMA zone X (unshaded) · 0% chance over 30 yrs
- Wildfire 1/10 Low
- Heat 6/10 Major 7 d/yr ≥107°F today · 19 d/yr by 30 yrs out
- Wind 2/10 Low 4% chance of damaging wind over 30 yrs
- Air quality 2/10 Low 1 unhealthy d/yr today · 3 by 30 yrs out
Nearby sold comps map
Loading sold comps map…
Walkable amenities ~0.75 mi
Loading nearby amenities…
Taxation est. · year 1
- Rental income
- $20,052
- − Mortgage interest
- −$9,243
- − Property taxes
- −$1,863
- − Insurance
- −$825
- − Repairs & maintenance
- −$1,604
- − Management
- −$1,604
- − Depreciation
- −$4,800
- Taxable income
- $113
- Est. tax owed @ 24.0%
- −$27
- After-tax cash flow
- $2,742/yr
For passive investors: Depreciation is non-cash, so a rental often shows a tax loss while cash-flowing — sheltering income. Rental losses are passive: they offset passive income freely, and up to $25,000/yr can offset ordinary (W-2) income if you actively participate and your MAGI is under $100k (phasing out to $0 by $150k); unused losses carry forward. On sale, claimed depreciation is recaptured at up to 25%, and gains may owe capital-gains tax (a 1031 exchange can defer both). Figures are a year-1 estimate at your 24.0% rate — not tax advice; consult a CPA.
Schools (NCES district)
- District
- Midwest City-Del City
- NCES district ID
- 4019950
- Math proficiency
- 10% ▼ -11.00%
- Reading proficiency
- 17% ▼ -8.00%
- Median HH income
- $45,724
- Composite
- 12.09/100
- National rank
- #9658
- State rank
- #231 of 270 in OK
Livability — Oklahoma City
- Score
- 80/100
- State rank
- #3
- US rank
- #1635
Category grades
Schools grade is shown separately in the Schools card above.
Census & demographics
- Census place
- Oklahoma City, OK
- County
- Oklahoma County · 771,644 people
- City population
- 498,656
- Metro
- Oklahoma City, OK
- Population (ZIP)
- 22,022
- Household income
- $63,478
- Rent vs Own
- Severe rent burden
- 1083.0
Population outlook (Oklahoma County) Hauer SSP2
- Today (2025)
- 911,875 people
- By 2030
- 982,413 · +7.7%
- By 2040
- 1,130,468 · +24.0%
- By 2050
- 1,288,422 · +41.3%
- By 2075
- 1,711,482 · +87.7%
- By 2100
- 2,088,448 · +129.0%
Race, ethnicity, and origin ACS 2023
- Neighborhood character
- Highly diverse neighborhood (Simpson 0.73)
- Race & ethnicity
- White 41% Black 25% Hispanic / Latino 19% Two or more races 15% Asian 6% Native American 2%
- Hispanic origin (detail)
- Mexican 15%
- Common ancestry
- Italian 1% Lithuanian 1% Slovak 1%
- Foreign-born
- 9% · Canada, Vietnam
- Languages at home
- 83% English-only · Spanish 11% Vietnamese 3% Other Asian/Pacific 1%
Political lean MEDSL · Oklahoma
- 2024 margin
- Toss-up / Even · D 48.0% · R 49.7% · Other 2.3%
- 2008→2024 swing
- +15.1pp toward D · 2008: -16.8pp · 2024: -1.7pp
- All cycles
- 2024: R+1.7 2020: R+1.1 2016: R+10.5 2012: R+16.7 2008: R+16.8
Not yet ingested
- Civics
- —
Market trends
- HPI YoY
- ▼ -20.17%
- Current HPI
- 232.4241
- Rent YoY
- ▲ 4.76%
- Metro
- Oklahoma City, OK
- State GDP YoY
- ▲ 1.55%
- F500 in state
- 6
Industry mix (Fortune 500 HQ in OK)
| Industry | F500 HQs | Revenue |
|---|---|---|
| Energy | 3 | $48B |
|
||
Price history
+358.3% since first listed14 events — show timeline
- 2026-06-07 Listed $165,000 MLSOK
- 2022-10-24 Sold (Public Records) $122,000 Public Records
- 2022-10-21 Sold (MLS) $122,000 MLSOK
- 2022-10-01 Pending — MLSOK
- 2022-09-29 Price Changed $121,900 MLSOK
- 2022-09-22 Price Changed $129,900 MLSOK
- 2022-09-15 Listed $139,900 MLSOK
- 2021-04-16 Sold (Public Records) $62,500 Public Records
- 2021-04-16 Sold (Public Records) $55,000 Public Records
- 2005-12-02 Sold (Public Records) $60,000 Public Records
- 2005-11-29 Sold (MLS) $59,900 MLSOK
- 2005-10-10 Listed $59,900 MLSOK
- 1987-10-14 Sold (Public Records) $33,000 Public Records
- 1987-02-01 Sold (Public Records) $36,000 Public Records
Property tax history
+11.0%/yrLatest (2025): $1,863 · +3.3% YoY. Source: county tax records.
Cash-flow waterfall
monthlySold comps — $/sqft
last 12 mo · ≤1 miLoading sold comps…