 🏗️ New Construction
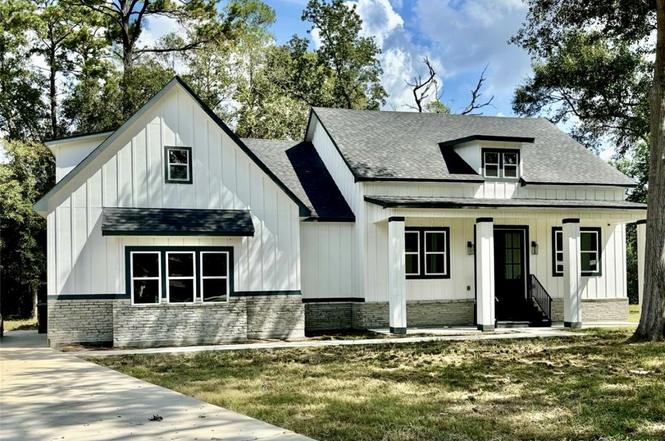
16 River Plantation Dr · Conroe, TX
Flood risk 8/10 · Major
- FEMA flood zone
- AE
- Chance of flooding over 30 yrs
- 0.97%
- Est. flood insurance / yr
- $1,737 – $8,500
Fire risk 5/10 · Moderate
- Est. fire insurance / yr
- $1,222 – $2,270
Heat risk 9/10 · Severe
- Hot days now (above 112°F)
- 7 days/yr
- Hot days in 30 yrs
- 24 days/yr
Wind risk 8/10 · Major
- Chance of severe wind over 30 yrs
- 99.0%
Air-quality risk 3/10 · Minor
- Unhealthy air days now
- 2 days/yr
- Unhealthy air days in 30 yrs
- 3 days/yr
Risk factors via First Street. Map © Google.
Why this score? — see what drove the D grade
The composite is a weighted blend of 9 inputs, each scored 0–100. Each bar is that input's sub-score; the figure is the points it added to the 100-point composite (weight × sub-score).
- Cash flow +12.8/30.0
- ARV discount +7.5/15.0
- Schools +5.1/10.0
- 1% rule +3.9/10.0
- DSCR +3.8/10.0
- Livability +3.7/5.0
- Rent growth +3.3/5.0
- Condition / age +2.5/5.0
- Appreciation +0.0/10.0
$360,000
🖨 Deal sheet (PDF) 📄 Offer letter ✓ Due diligence
Listing remarks
Stunning New Construction Home in River Plantation! Welcome to your dream home in the River Plantation community of Conroe! This gorgeous two-story residence features 4 spacious bedrooms and 2 modern bathrooms, offering ample space for you and your family. As you step inside, you'll be captivated by the elegant flooring and an abundance of natural light that fills every corner. The kitchen boasts beautiful cabinetry and plenty of storage. The living room and bedrooms feature stylish modern ceilings that add a touch of sophistication. Prepare to be enchanted by the luxurious master suite, designed for comfort and relaxation. The convenient walk-in laundry room enhances your daily living exp
Key facts
- Plenty of storage
- Natural light
- Beautiful cabinetry
Tags
Neighborhood map
What this means for you Summary
Snapshot
- This is a 4-bed/2.0-bath land listed at $360k.
Deal economics
- At list price, monthly cash flow is $-461 ($-6k/yr) — negative.
- To cash-flow at today's rent, offer at most $293k (18.5% below list).
- To meet the 1% rule (rent ≥ 1% of price), the offer needs to be $322k (10.6% below list).
- Recommended offer: $293k (18.5% below list) — sets the bar for cash-flow.
- Cap rate 6.2% vs local median 3.1% in Conroe — top-decile yield for the area; either an underpriced asset or a hidden risk that comps aren't pricing in. Stress-test before assuming the spread holds.
Location & tenants
- Location reads 74/100 on livability (#169 in TX, #4,447 nationally) — a middle-class / working-renter tenant base. Strengths: cost of living A+, housing A+, amenities B; Watch: commute F, health & safety F.
- Conroe ISD (other): math 57% / reading 57% proficiency, ranked #69 of 826 in TX (top 8%) — acceptable for families but not a draw, mixed tenant base, ~2y average lease.
- Zoned schools: Wilkinson El (math 38% / reading 43%, grade F, #1,490 of 4,322 statewide, top 35%, 944 students, 54% FRL); Peet J H (math 45% / reading 50%, grade C-, #408 of 1,662 statewide, top 25%, 1,289 students, 58% FRL); Conroe H S (math 32% / reading 51%, grade F, #767 of 1,632 statewide, top 47%, 4,915 students, 61% FRL) — zoned schools average 58% FRL vs 34% district-wide (23 pts higher); higher-poverty schools than district average — tighter screening recommended.
- Zoned-school proficiency averages 43% at this address vs 57% district-wide (-14 pts) — the specific schools serving this property underperform the Conroe ISD average; the district grade overstates school quality for this exact location.
- Market conditions: Rents rising (+3.3%/yr); 1117 active listings in the ZIP; 2 comparable units currently listed for rent nearby; solid renter incomes; 13,259 units permitted in Montgomery County in 2024 (1,402 in 5+ unit buildings).
Forward outlook
- Local home prices are declining (-3.0%/yr); year-one equity from $2k of loan paydown is wiped out by about $11k of value loss. Plan a longer hold.
- Montgomery County population projected at +65% by 2050 — long-run rental-demand tailwind backs the buy-and-hold thesis.
Negotiation context
- Only 11 days on market — expect competitive offers; lowballing is unlikely to land.
- 7 sale attempts since 8y ago with the ask held roughly flat each time — persistent listings suggest the price (not the market) is what's stuck; bring a comps-based counter.
- Current owner paid $228k; list at $360k implies a 58% gain — meaningful room to come down on a strong offer.
Risks & watch-outs
- Watch-outs: flood insurance adds $427/mo.
- Climate carrying-cost: in FEMA flood zone AE (mandatory federal flood insurance); severe wind risk, 99% chance of damaging wind over 30y; moderate wildfire risk; extreme-heat days projected 7→24/yr by 2055 (HVAC capex compounding) — expect insurance premiums to compound above CPI over the hold.
Questions for the listing agent
- What do current leases actually rent for vs. the listed asking? Can we see a recent rent roll and the last 12 months of T-12 income?
- What's the actual annual flood-insurance premium (NFIP or private), and is the property in a SFHA with mandatory coverage?
- What does the HOA fee cover, when was the last increase, and are there any pending special assessments or reserve-fund shortfalls?
- Is there a deadline driving the sale (1031 exchange, divorce, estate, relocation)? That informs how much negotiation room exists.
- Schools are D-rated, which usually means shorter tenancies and higher turnover. Who's the typical renter profile here, and what's been the actual vacancy rate?
- The area grade is low — what's the realistic commute time and amenity access for the typical tenant pool here? Any planned neighborhood developments (good or bad) we should know about?
- What's the average days-on-market for RENTAL listings here right now (not sales)? A rising rental-DOM trend means longer vacancies and softer asking-rent achievability than the comps imply.
- What's the recent tenant-quality profile in this submarket — average credit score on applications, eviction rate, late-payment / NSF rate, and stable-employment percentage? A property-management company in the area should have these aggregated.
- How much new for-sale + rental construction is in the pipeline within 1–3 miles? Heavy new supply typically softens prices + rents 12–24 months out; constrained supply supports both.
Investment metrics
- 1% rule
- 0.89% ✗
- Cap rate
- 6.18%
- Cash-on-cash
- -0.41%
- DSCR
- 0.98
- GRM
- 9.3
CMA / ARV
No comps found within radius.
Projected returns pro-forma
-3.0% appreciation · 3.3% rent growth · sell at horizon
- IRR
- -25.1%
- Equity multiple
- 0.14×
- Total profit
- $-86,339
- Equity at exit
- $53,677
- IRR
- -19.7%
- Equity multiple
- -0.07×
- Total profit
- $-107,457
- Equity at exit
- $31,126
Cash invested: $100,800 (down + closing). Projections, not guarantees.
Landlord ↔ Tenant lean methodology
- Overall (STATE)
- 87 Strongly Landlord-Friendly
- State Texas
- 87 Strongly Landlord-Friendly · R+5
- County
- — inherits STATE
- City
- — inherits STATE
ZIP-level market 77302
- Rents YoY
- 3.3%
- Active inventory
- 1117
- Price-to-rent
- 9.3×
Monthly cashflow live
- Estimated rent
- $3,220 medium interval (Pro) →
- Mortgage (P&I)
- −$1,888
- Tax est. 1.5%
- −$450 /mo · $5,400/yr
- Insurance
- −$150
- Flood insurance flood zone
- −$427 /mo · $5,118/yr
- HOA
- −$90
- Vacancy / Maint / Mgmt
- −$676
- Net cashflow
- $-461
Break-even live
Sensitivity live
| Price | -10% $-212 | -5% $-336 | +0% $-461 | +5% $-585 | +10% $-710 |
|---|---|---|---|---|---|
| Rent | -10% $-715 | -5% $-588 | +0% $-461 | +5% $-334 | +10% $-206 |
| Rate | -1.0pp $-279 | -0.5pp $-369 | base $-461 | +0.5pp $-554 | +1.0pp $-649 |
UW: 25.0% down · 7.5% · 30yr · 1.5% tax · 5.0% vac · 8.0% maint · 8.0% mgmt
Financing live
Cash to close
- Down payment
- $90,000
- Closing costs
- $10,800
- Reserves months
- —
- Total cash needed
- —
Loan-product check · same deal, 3 products live
Conventional
25% down · 7.5% · 30yr
- Down + closing
- —
- Monthly P&I
- —
- Monthly cashflow
- —
- DSCR
- —
- Eligible?
- —
Personal DTI + credit; lowest rate.
DSCR
20% down · 8.5% · 30yr
- Down + closing
- —
- Monthly P&I
- —
- Monthly cashflow
- —
- DSCR
- —
- Eligible?
- —
No personal income docs; deal must DSCR.
Hard money
10% down · 12.0% · 12mo
- Down + closing
- —
- Monthly P&I
- —
- Monthly cashflow
- —
- DSCR
- —
- Eligible?
- —
Short-term bridge; refi at stabilization.
Rent comps 2 comps
| Address | Beds | Baths | Sqft | Rent | $/sqft | DOM | Units | Dist |
|---|---|---|---|---|---|---|---|---|
| 493 Monticello Park Conroe, TX | 5.0 | 3.5 | 2921 | $3,400 | $1.16 | 26d | 1 | 1.09mi |
| 461 Stephen F Austin Dr Conroe, TX | 4.0 | 2.5 | 3023 | $3,036 | $1.00 | 7d | 1 | 1.12mi |
HOA detail
- Monthly dues
- $90 · $1,080/yr
Listing history 28 events
-
2026-03-12status Pending
-
2026-03-01$360,000 Active
-
2025-09-10historical
-
2025-08-21$360,000 Active
-
2025-08-21historical
-
2025-06-19price $360,000
-
2025-05-26price $370,000
-
2025-03-24$380,000 Active
-
2025-02-26status Pending
-
2025-02-10status Option Pending
-
2025-02-06historical
-
2024-10-24$380,000 Active
-
2024-04-08soldstatus
-
2024-03-13soldstatus $228,000
-
2019-03-11soldstatus
-
2019-02-28soldstatus Sold
-
2019-01-25status Pending, Continue to Show
-
2019-01-22status Option Pending
-
2018-10-26$10,990 Active
-
2018-10-25historical
-
2018-09-05price $10,990
-
2018-08-06$12,000 Active
-
2018-08-06historical
-
2018-07-13price $18,000
-
2018-05-07$20,000 Active
-
2007-06-19soldstatus
-
2007-05-10soldstatus $4,482
-
1993-03-02soldstatus
ⓘ Source: listings_history table (triggers on properties + properties_extension) + one-shot
backfill from property_details.listing_events for pre-trigger history.
Climate risk First Street
- Flood 8/10 Severe FEMA zone AE · 97% chance over 30 yrs
- Wildfire 5/10 Major
- Heat 9/10 Extreme 7 d/yr ≥112°F today · 24 d/yr by 30 yrs out
- Wind 8/10 Severe 99% chance of damaging wind over 30 yrs
- Air quality 3/10 Moderate 2 unhealthy d/yr today · 3 by 30 yrs out
Nearby sold comps map
Loading sold comps map…
Walkable amenities ~0.75 mi
Loading nearby amenities…
Taxation est. · year 1
- Rental income
- $38,638
- − Mortgage interest
- −$20,166
- − Property taxes
- −$5,400
- − Insurance
- −$6,919
- − Repairs & maintenance
- −$3,091
- − Management
- −$3,091
- − HOA
- −$1,080
- − Depreciation
- −$10,473
- Taxable loss
- −$11,581
- Est. tax savings @ 24.0%
- +$2,779
- After-tax cash flow
- $-2,749/yr
For passive investors: Depreciation is non-cash, so a rental often shows a tax loss while cash-flowing — sheltering income. Rental losses are passive: they offset passive income freely, and up to $25,000/yr can offset ordinary (W-2) income if you actively participate and your MAGI is under $100k (phasing out to $0 by $150k); unused losses carry forward. On sale, claimed depreciation is recaptured at up to 25%, and gains may owe capital-gains tax (a 1031 exchange can defer both). Figures are a year-1 estimate at your 24.0% rate — not tax advice; consult a CPA.
Schools (NCES district)
- District
- Conroe ISD
- NCES district ID
- 4815000
- Math proficiency
- 57% ▼ -6.00%
- Reading proficiency
- 57% ▼ -1.00%
- Median HH income
- $71,541
- Composite
- 50.65/100
- National rank
- #1833
- State rank
- #69 of 826 in TX
Livability — Conroe
- Score
- 74/100
- State rank
- #169
- US rank
- #4447
Category grades
Schools grade is shown separately in the Schools card above.
Census & demographics
- County
- Montgomery County · 663,713 people
- City population
- 205,417
- Metro
- Houston-The Woodlands-Sugar Land, TX
- Population (ZIP)
- 21,546
- Household income
- $84,673
- Rent vs Own
- Severe rent burden
- 205.0
Population outlook (Montgomery County) Hauer SSP2
- Today (2025)
- 713,896 people
- By 2030
- 805,263 · +12.8%
- By 2040
- 992,708 · +39.1%
- By 2050
- 1,179,590 · +65.2%
- By 2075
- 1,628,084 · +128.1%
- By 2100
- 1,937,880 · +171.5%
Race, ethnicity, and origin ACS 2023
- Neighborhood character
- Majority White (63%)
- Race & ethnicity
- White 63% Hispanic / Latino 29% Two or more races 19% Black 3% Asian 1%
- Hispanic origin (detail)
- Mexican 26% Puerto Rican 1%
- Common ancestry
- Lithuanian 3% Italian 2% Slovak 2%
- Foreign-born
- 13% · Canada, Vietnam, China
- Languages at home
- 78% English-only · Spanish 20% Russian/Polish/Slavic 1% Other Indo-European 0%
Political lean MEDSL · Montgomery
- 2024 margin
- Solid R (+45.5) · D 26.8% · R 72.3%
- 2008→2024 swing
- +7.2pp toward D · 2008: -52.7pp · 2024: -45.5pp
- All cycles
- 2024: R+45.5 2020: R+43.8 2016: R+51.4 2012: R+60.7 2008: R+52.7
Not yet ingested
- Civics
- —
Market trends
- HPI YoY
- ▼ -187.56%
- Current HPI
- 262.1879
- Rent YoY
- ▲ 3.30%
- Metro
- Houston-The Woodlands-Sugar Land, TX
- State GDP YoY
- ▲ 3.95%
- F500 in state
- 110
Industry mix (Fortune 500 HQ in TX)
| Industry | F500 HQs | Revenue |
|---|---|---|
| Energy | 16 | $1,198B |
|
||
| Technology | 5 | $198B |
|
||
| Engineering / Construction | 4 | $72B |
|
||
| Energy Services | 3 | $60B |
|
||
| Utilities | 3 | $41B |
|
||
| Healthcare | 2 | $330B |
|
||
Price history
+7932.1% since first listed28 events — show timeline
- 2026-03-12 Pending — HARMLS
- 2026-03-01 Listed $360,000 HARMLS
- 2025-09-10 Listing Removed — HARMLS
- 2025-08-21 Listing Removed — HARMLS
- 2025-08-21 Listed $360,000 HARMLS
- 2025-06-19 Price Changed $360,000 HARMLS
- 2025-05-26 Price Changed $370,000 HARMLS
- 2025-03-24 Listed $380,000 HARMLS
- 2025-02-26 Pending — HARMLS
- 2025-02-10 Pending — HARMLS
- 2025-02-06 Listing Removed — HARMLS
- 2024-10-24 Listed $380,000 HARMLS
- 2024-04-08 Sold (Public Records) — Public Records
- 2024-03-13 Sold (Public Records) $228,000 Public Records
- 2019-03-11 Sold (Public Records) — Public Records
- 2019-02-28 Sold (MLS) — HARMLS
- 2019-01-25 Pending — HARMLS
- 2019-01-22 Pending — HARMLS
- 2018-10-26 Listed $10,990 HARMLS
- 2018-10-25 Listing Removed — HARMLS
- 2018-09-05 Price Changed $10,990 HARMLS
- 2018-08-06 Listing Removed — HARMLS
- 2018-08-06 Listed $12,000 HARMLS
- 2018-07-13 Price Changed $18,000 HARMLS
- 2018-05-07 Listed $20,000 HARMLS
- 2007-06-19 Sold (Public Records) — Public Records
- 2007-05-10 Sold (Public Records) $4,482 Public Records
- 1993-03-02 Sold (Public Records) — Public Records
Property tax history
+6.4%/yrLatest (2025): $363 · -0.4% YoY. Source: county tax records.
Cash-flow waterfall
monthlySold comps — $/sqft
last 12 mo · ≤1 miLoading sold comps…