None · Masury, OH
Flood risk No data
- FEMA flood zone
- —
- Chance of flooding over 30 yrs
- —
- Est. flood insurance / yr
- —
Fire risk No data
- Est. fire insurance / yr
- —
Heat risk No data
- Hot days now (above threshold)
- —
- Hot days in 30 yrs
- —
Wind risk No data
- Chance of severe wind over 30 yrs
- —
Air-quality risk No data
- Unhealthy air days now
- —
- Unhealthy air days in 30 yrs
- —
Risk factors via First Street. Map © Google.
Why this score? — see what drove the C- grade
The composite is a weighted blend of 9 inputs, each scored 0–100. Each bar is that input's sub-score; the figure is the points it added to the 100-point composite (weight × sub-score).
- Cash flow +16.4/30.0
- Appreciation +10.0/10.0
- ARV discount +7.5/15.0
- DSCR +5.1/10.0
- 1% rule +4.5/10.0
- Schools +3.6/10.0
- Livability +3.0/5.0
- Rent growth +2.5/5.0
- Condition / age +2.2/5.0
$119,900
🖨 Deal sheet 📄 Offer letter ✓ Due diligence
Listing remarks
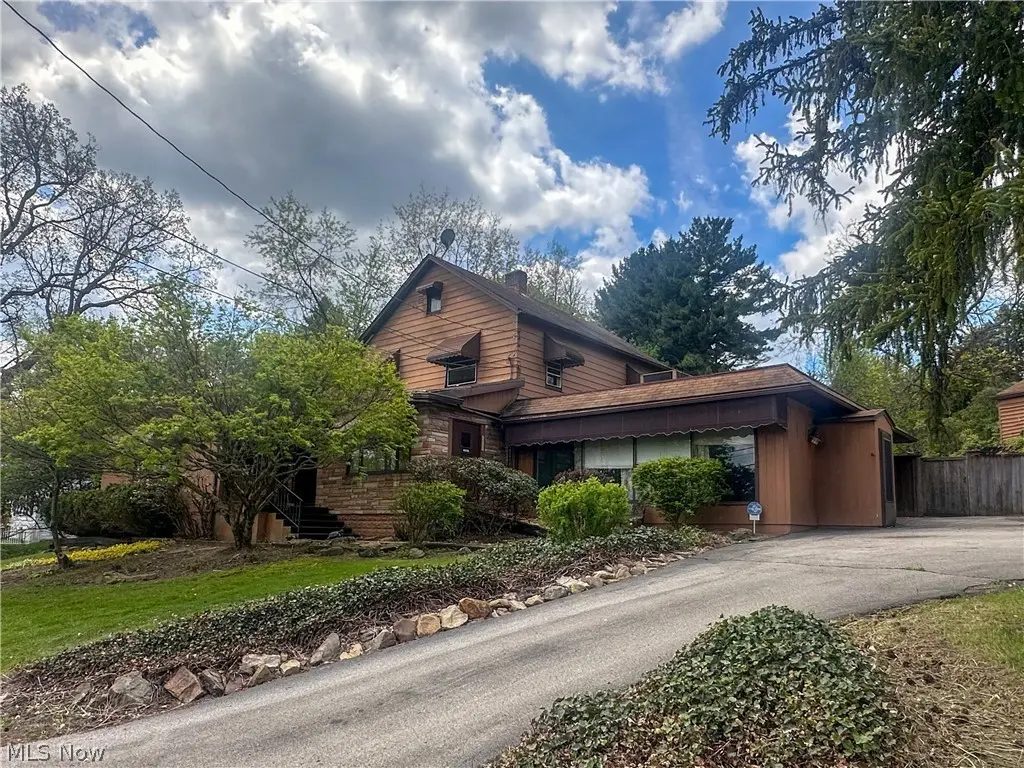
This is a great opportunity for someone who owns their own business and wants a short commute! Live in one side of this spacious four-bedroom home and work on the other. Formerly used as a florist shop with a nice storefront, coolers, workspace and a kitchen, this is the perfect place to set up your small business. It offers plenty of parking, a two-car detached garage and two ways to enter/exit. On the other side, you'll find ample space to live and relax with a large living room, wood-burning fireplace, eat-in kitchen with appliances included, 3-4 bedrooms, 2 full baths, a basement, and a wonderfully private backyard with a covered patio and yard. An addition in 1968 expanded the original
Key facts
- 0.34 acre lot
- 2 garage spots
- Built 1901
Property features AI
Exterior
- Parking: Detached garage; Two garage spaces; Additional paved driveway parking
- Utilities: Public water; Public sewer
- Home design: Two-story home; Corner city lot; Irregular lot
- Construction: Stone, vinyl siding, and wood siding exterior; Asphalt/fiberglass and flat roof; Block foundation; Year built (public records)
- Exterior features: Private yard; Deck; Patio; Porch; Back yard fencing
Interior
- Kitchen: Eat-in kitchen; Range; Dishwasher; Disposal; Refrigerator
- Bedrooms: Three bedrooms (two on the second floor, one main-level bedroom)
- Flooring: Carpet in multiple rooms and bedrooms; Tile in bonus room, kitchen, and family room
- Bathrooms: Two full bathrooms (one on the main level)
- Heating & cooling: Forced air gas heating; Central air conditioning; Has cooling and heating
- Interior features: Built-in features; Entrance foyer; Eat-in kitchen; Storage; Full basement
- Laundry & utility: Washer and dryer; Laundry located in the basement
Neighborhood map
What this means for you Summary
Snapshot
- This is a 4-bed/2.0-bath single-family listed at $120k. Condition is rated fair.
Deal economics
- At list price, monthly cash flow is $67 ($806/yr) — positive.
- The deal already cash-flows at list — no discount required.
- To meet the 1% rule (rent ≥ 1% of price), the offer needs to be $113k (5.4% below list).
- Recommended offer: $113k (5.4% below list) — sets the bar for 1% rule.
Location & tenants
- Location reads 60/100 on livability (#961 in OH) — a middle-class / working-renter tenant base. Strengths: cost of living A+, crime A, housing B; Watch: schools D-, amenities F, commute F.
- Brookfield Local (rural): math 32% / reading 54% proficiency, ranked #524 of 656 in OH (top 80%) — families likely to look elsewhere, expect single-tenant / working-renter base with shorter leases.
- Market conditions: 11 active listings in the ZIP; lower-income renter base — watch delinquency; 129 units permitted in Trumbull County in 2024 (0 in 5+ unit buildings).
- This rent runs 32% of the median local income ($43k/yr) — at the standard rent-burdened threshold; future hikes will face affordability resistance.
Forward outlook
- In year one you build about $13k of equity ($829 loan paydown + $12k appreciation (10.0% local appreciation)).
- Trumbull County population projected at -22% by 2050 — secular population decline; favor cash flow + early exit over multi-decade hold.
- At projected returns (10.0% appreciation + 3.0% rent growth), your $34k cash investment doubles in ~3 years — after that, you're playing with house money.
- By year 3, paydown + projected appreciation supports a ~$32k cash-out refi (75% LTV) — recoverable capital for the next deal without selling this one.
Negotiation context
- It's been on market 53 days — a 3% lower offer ($116k) is reasonable based on typical stale-listing flexibility.
Risks & watch-outs
- Watch-outs: built in 1901 — expect roof / HVAC / electrical / plumbing capex.
Questions for the listing agent
- It's been on market 53 days. Have you received any prior offers? Is the seller open to a 5% concession, seller financing, or rate buy-down credit?
- Have any recent inspections been done? Can we get a copy of the seller's disclosures and any deferred-maintenance estimates?
- Built in 1901 — when were the roof, HVAC, electrical panel, plumbing, and water heater last replaced?
- Is there a deadline driving the sale (1031 exchange, divorce, estate, relocation)? That informs how much negotiation room exists.
- Schools are D-rated, which usually means shorter tenancies and higher turnover. Who's the typical renter profile here, and what's been the actual vacancy rate?
- What's the average days-on-market for RENTAL listings here right now (not sales)? A rising rental-DOM trend means longer vacancies and softer asking-rent achievability than the comps imply.
- What's the recent tenant-quality profile in this submarket — average credit score on applications, eviction rate, late-payment / NSF rate, and stable-employment percentage? A property-management company in the area should have these aggregated.
- How much new for-sale + rental construction is in the pipeline within 1–3 miles? Heavy new supply typically softens prices + rents 12–24 months out; constrained supply supports both.
Investment metrics
- 1% rule
- 0.95% ✗
- Cap rate
- 6.97%
- Cash-on-cash
- 2.40%
- DSCR
- 1.11
- GRM
- 8.8
CMA / ARV
No comps found within radius.
Projected returns pro-forma
10.0% appreciation · 3.0% rent growth · sell at horizon
- IRR
- 26.0%
- Equity multiple
- 3.07×
- Total profit
- $69,597
- Equity at exit
- $108,015
- IRR
- 22.8%
- Equity multiple
- 7.01×
- Total profit
- $201,621
- Equity at exit
- $232,939
Cash invested: $33,572 (down + closing). Projections, not guarantees.
Landlord ↔ Tenant lean methodology
- Overall (STATE)
- 73 Landlord-Friendly
- State Ohio
- 73 Landlord-Friendly · R+6
- County
- — inherits STATE
- City
- — inherits STATE
ZIP-level market 44438
- Home prices YoY
- 13.0%
- Active inventory
- 11
- Price-to-rent
- 8.8×
Monthly cashflow live
- Estimated rent
- $1,134 medium interval (Pro) →
- Mortgage (P&I)
- −$629
- Tax est. 1.5%
- −$150 /mo · $1,798/yr
- Insurance
- −$50
- HOA
- −$0
- Vacancy / Maint / Mgmt
- −$238
- Net cashflow
- $67
Break-even live
UW: 25.0% down · 7.5% · 30yr · 1.5% tax · 5.0% vac · 8.0% maint · 8.0% mgmt
Financing live
Cash to close
- Down payment
- $29,975
- Closing costs
- $3,597
- Reserves months
- —
- Total cash needed
- —
Loan-product check · same deal, 3 products live
Conventional
25% down · 7.5% · 30yr
- Down + closing
- —
- Monthly P&I
- —
- Monthly cashflow
- —
- DSCR
- —
- Eligible?
- —
Personal DTI + credit; lowest rate.
DSCR
20% down · 8.5% · 30yr
- Down + closing
- —
- Monthly P&I
- —
- Monthly cashflow
- —
- DSCR
- —
- Eligible?
- —
No personal income docs; deal must DSCR.
Hard money
10% down · 12.0% · 12mo
- Down + closing
- —
- Monthly P&I
- —
- Monthly cashflow
- —
- DSCR
- —
- Eligible?
- —
Short-term bridge; refi at stabilization.
Listing history 16 events
-
2026-06-19days on market $119,900 Active 53 DOM
-
2026-06-18days on market $119,900 Active 52 DOM
-
2026-06-17days on market $119,900 Active 51 DOM
-
2026-06-16days on market $119,900 Active 50 DOM
-
2026-06-15days on market $119,900 Active 49 DOM
-
2026-06-14days on market $119,900 Active 47 DOM
-
2026-06-13pricedays on market $119,900 Active 46 DOM
-
2026-06-10days on market $169,900 Active 44 DOM
-
2026-06-09days on market $169,900 Active 43 DOM
-
2026-06-08days on market $169,900 Active 42 DOM
-
2026-06-07days on market $169,900 Active 41 DOM
-
2026-06-02days on market $169,900 Active 36 DOM
-
2026-06-01days on market $169,900 Active 35 DOM
-
2026-05-31days on market $169,900 Active 34 DOM
-
2026-05-30days on market $169,900 Active 33 DOM
-
2026-04-24$169,900 Active 1055-char remark
ⓘ Source: listings_history table (triggers on properties + properties_extension) + one-shot
backfill from property_details.listing_events for pre-trigger history.
Nearby sold comps map
Loading sold comps map…
Walkable amenities ~0.75 mi
Loading nearby amenities…
Taxation est. · year 1
- Rental income
- $13,607
- − Mortgage interest
- −$6,716
- − Property taxes
- −$1,798
- − Insurance
- −$600
- − Repairs & maintenance
- −$1,089
- − Management
- −$1,089
- − Depreciation
- −$3,488
- Taxable loss
- −$1,172
- Est. tax savings @ 24.0%
- +$281
- After-tax cash flow
- $1,088/yr
For passive investors: Depreciation is non-cash, so a rental often shows a tax loss while cash-flowing — sheltering income. Rental losses are passive: they offset passive income freely, and up to $25,000/yr can offset ordinary (W-2) income if you actively participate and your MAGI is under $100k (phasing out to $0 by $150k); unused losses carry forward. On sale, claimed depreciation is recaptured at up to 25%, and gains may owe capital-gains tax (a 1031 exchange can defer both). Figures are a year-1 estimate at your 24.0% rate — not tax advice; consult a CPA.
Condition & rehab AI · 13 photos
This home requires significant repairs and updates to its roof, exterior siding, flooring, and bathrooms. However, with these improvements, it has the potential to become a move-in-ready property with increased resale and rental value.
Repairs flagged
- Major roof — The roof appears to be in poor condition, with visible wear and tear.
- Moderate exterior siding — The exterior siding shows signs of wear and discoloration.
- Major flooring — The flooring in the kitchen and living areas appears to be carpeted and in poor condition.
- Moderate interior walls — The interior walls show signs of wear and discoloration.
- Major bathrooms — The bathrooms appear to be in poor condition, with outdated fixtures and tiles.
Value-add opportunities
- Both new roof — A new roof would significantly increase the home's value and appeal to potential buyers or renters.
- Both exterior siding repair and painting — Repairing and repainting the exterior siding would improve the home's curb appeal and increase its value.
- Both flooring replacement — Replacing the carpeted flooring with hardwood or tile would improve the home's appearance and increase its value.
- Both bathroom updates — Updating the bathrooms with new fixtures and tiles would improve the home's functionality and increase its value.
Renovation cost estimate screening
| Repair item | Severity | Est. cost |
|---|---|---|
| roof · The roof appears to be in poor condition, with visible wear and tear. | Major | $15,000–50,000 |
| exterior siding · The exterior siding shows signs of wear and discoloration. | Moderate | $3,000–15,000 |
| flooring · The flooring in the kitchen and living areas appears to be carpeted and in poor condition. | Major | $15,000–50,000 |
| interior walls · The interior walls show signs of wear and discoloration. | Moderate | $3,000–15,000 |
| bathrooms · The bathrooms appear to be in poor condition, with outdated fixtures and tiles. | Major | $15,000–50,000 |
| Total estimated repair cost · 5 items | $51,000–180,000 |
Value-add ROI direction
- Both new roof — A new roof would significantly increase the home's value and appeal to potential buyers or renters. ↑
- Both exterior siding repair and painting — Repairing and repainting the exterior siding would improve the home's curb appeal and increase its value. ↑
- Both flooring replacement — Replacing the carpeted flooring with hardwood or tile would improve the home's appearance and increase its value. ↑
- Both bathroom updates — Updating the bathrooms with new fixtures and tiles would improve the home's functionality and increase its value. ↑
ⓘ Cost ranges are severity-bucket heuristics (US national rule-of-thumb). Get contractor quotes + a written scope before underwriting a rehab budget.
Schools (NCES district)
- District
- Brookfield Local
- NCES district ID
- 3905012
- Math proficiency
- 32% ▼ -24.00%
- Reading proficiency
- 54% ▼ -9.00%
- Median HH income
- $38,050
- Composite
- 35.75/100
- National rank
- #4850
- State rank
- #524 of 656 in OH
Livability — Masury
- Score
- 60/100
- State rank
- #961
- US rank
- #18547
Category grades
Schools grade is shown separately in the Schools card above.
Census & demographics
- Census place
- Masury, OH
- County
- Trumbull · 193,293 people
- Metro
- Youngstown-Warren, OH
- Population (ZIP)
- 5,045
- Household income
- $42,934
- Rent vs Own
- Severe rent burden
- 12.9
Population outlook (Trumbull County) Hauer SSP2
- Today (2025)
- 191,696 people
- By 2030
- 184,015 · -4.0%
- By 2040
- 166,810 · -13.0%
- By 2050
- 149,857 · -21.8%
- By 2075
- 115,769 · -39.6%
- By 2100
- 83,617 · -56.4%
Race, ethnicity, and origin ACS 2023
- Neighborhood character
- Predominantly White (87%)
- Race & ethnicity
- White 87% Two or more races 11% Black 2% Hispanic / Latino 1%
- Common ancestry
- Romanian 4% Danish 1% Lithuanian 1%
- Foreign-born
- 0%
Political lean MEDSL · Trumbull
- 2024 margin
- R (+16.8) · D 41.2% · R 58.0%
- 2008→2024 swing
- -39.2pp toward R · 2008: 22.4pp · 2024: -16.8pp
- All cycles
- 2024: R+16.8 2020: R+10.6 2016: R+6.4 2012: D+22.2 2008: D+22.4
Not yet ingested
- Civics
- —
Market trends
- HPI YoY
- ▲ 22.03%
- Current HPI
- 191.982
- Rent YoY
- —
- Metro
- —
- State GDP YoY
- ▲ 1.98%
- F500 in state
- 48
Industry mix (Fortune 500 HQ in OH)
| Industry | F500 HQs | Revenue |
|---|---|---|
| Insurance | 3 | $145B |
|
||
| Industrial Machinery | 3 | $49B |
|
||
| Financial Services | 3 | $24B |
|
||
| Consumer Goods | 2 | $93B |
|
||
| Aerospace / Defense | 2 | $47B |
|
||
| Utilities | 2 | $33B |
|
||
Price history
-29.4% since first listed2 events — show timeline
- 2026-06-10 Price Changed $119,900 MLSNOW
- 2026-04-24 Listed $169,900 MLSNOW
Cash-flow waterfall
monthlySold comps — $/sqft
last 12 mo · ≤1 miLoading sold comps…