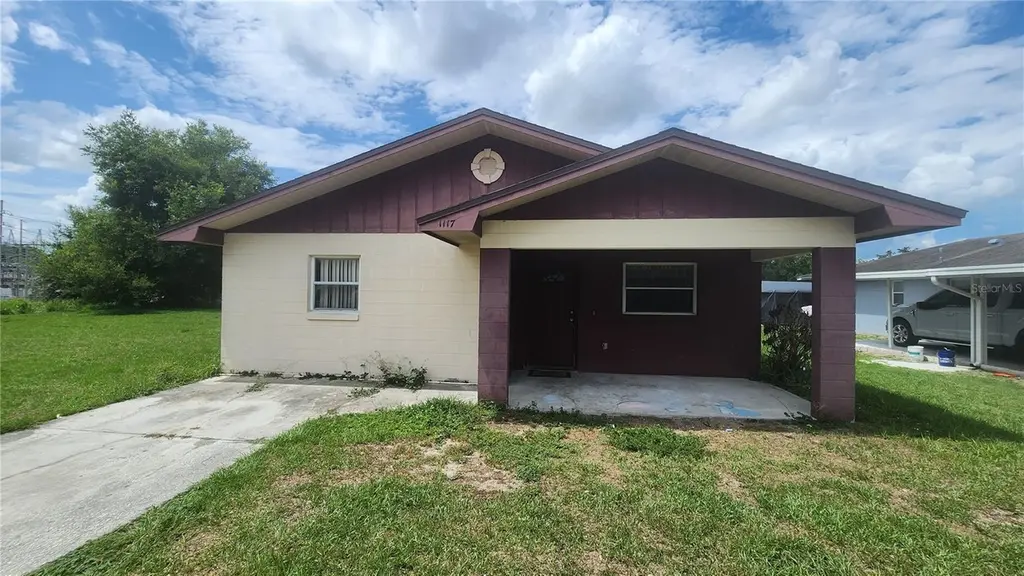
1117 Blossom Cir N · Lakeland, FL
Flood risk 1/10 · Minimal
- FEMA flood zone
- X (unshaded)
- Chance of flooding over 30 yrs
- 0.0%
- Est. flood insurance / yr
- $507 – $1,088
Fire risk 2/10 · Minimal
- Est. fire insurance / yr
- $947 – $1,759
Heat risk 8/10 · Major
- Hot days now (above 108°F)
- 7 days/yr
- Hot days in 30 yrs
- 23 days/yr
Wind risk 9/10 · Severe
- Chance of severe wind over 30 yrs
- 99.0%
Air-quality risk 2/10 · Minimal
- Unhealthy air days now
- 1 days/yr
- Unhealthy air days in 30 yrs
- 1 days/yr
Risk factors via First Street. Map © Google.
Why this score? — see what drove the C- grade
The composite is a weighted blend of 9 inputs, each scored 0–100. Each bar is that input's sub-score; the figure is the points it added to the 100-point composite (weight × sub-score).
- Cash flow +21.2/30.0
- ARV discount +7.5/15.0
- DSCR +6.7/10.0
- 1% rule +5.9/10.0
- Livability +3.9/5.0
- Schools +3.5/10.0
- Rent growth +2.7/5.0
- Condition / age +2.5/5.0
- Appreciation +0.0/10.0
$160,000
🖨 Deal sheet (PDF) 📄 Offer letter ✓ Due diligence
Listing remarks
Under contract-accepting backup offers. This 3-bedroom, 2-bath block home features an open floor plan with a spacious living and dining room combination. Priced well below market value, this property offers excellent potential for investors or first-time homebuyers. With a little TLC, you can transform this home into a valuable investment property or a comfortable place to call home. Conveniently located near the interstate, shopping centers, gas stations, restaurants, and other everyday amenities, this home combines affordability with a great location. Don't miss out on this opportunity—schedule your showing today!
Key facts
- Open floor plan
- Great location
- 6,695 sq ft lot
Tags
Property features AI
Finance
- HOA & community: No HOA association indicated
Exterior
- Utilities: Public water; Public sewer; Public utilities
- Home design: Single-family residence; One story; North-facing
- Construction: Block construction; Shingle roof; Block foundation; Built on a 0.15-acre lot (approximately 60 x 111)
- Exterior features: Asphalt road access
Interior
- Kitchen: Range; Refrigerator
- Bedrooms: 3 bedrooms
- Flooring: Other flooring
- Bathrooms: 2 full bathrooms
- Heating & cooling: Central heating; Central air conditioning
- Interior features: No notable interior features listed
- Laundry & utility: Washer hookup
Neighborhood map
What this means for you Summary
Snapshot
- This is a 3-bed/2.0-bath single-family listed at $160k.
Deal economics
- At list price, monthly cash flow is $230 ($3k/yr) — positive.
- The deal already cash-flows at list — no discount required.
- Meets the 1% rule at list price ($2k rent vs $160k).
Location & tenants
- Location reads 77/100 on livability (#206 in FL, #3,179 nationally) — a middle-class / working-renter tenant base. Strengths: cost of living A+, housing A+, health & safety A+; Watch: employment D+, amenities F, commute F.
- Polk (suburban): math 39% / reading 43% proficiency, ranked #62 of 73 in FL (top 85%) — families likely to look elsewhere, expect single-tenant / working-renter base with shorter leases.
- Market conditions: Rents flat; 162 active listings in the ZIP; 26 comparable units currently listed for rent nearby; rentals at typical pace (median 22d on market — plan ~3-4 weeks tenant-placement turnaround); 10,384 units permitted in Polk County in 2024 (1,716 in 5+ unit buildings).
- This rent runs 33% of the median local income ($63k/yr) — at the standard rent-burdened threshold; future hikes will face affordability resistance.
Forward outlook
- Local home prices are declining (-3.0%/yr); year-one equity from $1k of loan paydown is wiped out by about $5k of value loss. Plan a longer hold.
- Polk County population projected at +33% by 2050 — long-run rental-demand tailwind backs the buy-and-hold thesis.
Negotiation context
- Only 2 days on market — expect competitive offers; lowballing is unlikely to land.
- 2 sale attempts since 8y ago with the ask held roughly flat each time — persistent listings suggest the price (not the market) is what's stuck; bring a comps-based counter.
- Current owner paid $69k; list at $160k implies a 132% gain — meaningful room to come down on a strong offer.
Risks & watch-outs
- Climate carrying-cost: severe wind risk, 99% chance of damaging wind over 30y; extreme-heat days projected 7→23/yr by 2055 (HVAC capex compounding) — expect insurance premiums to compound above CPI over the hold.
Questions for the listing agent
- Is there a deadline driving the sale (1031 exchange, divorce, estate, relocation)? That informs how much negotiation room exists.
- What's the average days-on-market for RENTAL listings here right now (not sales)? A rising rental-DOM trend means longer vacancies and softer asking-rent achievability than the comps imply.
- What's the recent tenant-quality profile in this submarket — average credit score on applications, eviction rate, late-payment / NSF rate, and stable-employment percentage? A property-management company in the area should have these aggregated.
- How much new for-sale + rental construction is in the pipeline within 1–3 miles? Heavy new supply typically softens prices + rents 12–24 months out; constrained supply supports both.
Investment metrics
- 1% rule
- 1.09% ✓
- Cap rate
- 8.02%
- Cash-on-cash
- 6.17%
- DSCR
- 1.27
- GRM
- 7.6
CMA / ARV
No comps found within radius.
Projected returns pro-forma
-3.0% appreciation · 0.77% rent growth · sell at horizon
- IRR
- -9.4%
- Equity multiple
- 0.66×
- Total profit
- $-15,044
- Equity at exit
- $23,857
- IRR
- -3.4%
- Equity multiple
- 0.80×
- Total profit
- $-9,048
- Equity at exit
- $13,834
Cash invested: $44,800 (down + closing). Projections, not guarantees.
Landlord ↔ Tenant lean methodology
- Overall (STATE)
- 87 Strongly Landlord-Friendly
- State Florida
- 87 Strongly Landlord-Friendly · R+3
- County
- — inherits STATE
- City
- — inherits STATE
ZIP-level market 33805
- Home prices YoY
- -29.8%
- Rents YoY
- 0.8%
- Active inventory
- 162
- Price-to-rent
- 7.6×
Monthly cashflow live
- Estimated rent
- $1,747 high interval (Pro) →
- Mortgage (P&I)
- −$839
- Tax from tax record
- −$244 /mo · $2,933/yr
- Insurance
- −$67
- HOA
- −$0
- Vacancy / Maint / Mgmt
- −$367
- Net cashflow
- $230
Break-even live
Sensitivity live
| Price | -10% $321 | -5% $276 | +0% $230 | +5% $185 | +10% $140 |
|---|---|---|---|---|---|
| Rent | -10% $92 | -5% $161 | +0% $230 | +5% $299 | +10% $368 |
| Rate | -1.0pp $311 | -0.5pp $271 | base $230 | +0.5pp $189 | +1.0pp $147 |
UW: 25.0% down · 7.5% · 30yr · 1.5% tax · 5.0% vac · 8.0% maint · 8.0% mgmt
Financing live
Cash to close
- Down payment
- $40,000
- Closing costs
- $4,800
- Reserves months
- —
- Total cash needed
- —
Loan-product check · same deal, 3 products live
Conventional
25% down · 7.5% · 30yr
- Down + closing
- —
- Monthly P&I
- —
- Monthly cashflow
- —
- DSCR
- —
- Eligible?
- —
Personal DTI + credit; lowest rate.
DSCR
20% down · 8.5% · 30yr
- Down + closing
- —
- Monthly P&I
- —
- Monthly cashflow
- —
- DSCR
- —
- Eligible?
- —
No personal income docs; deal must DSCR.
Hard money
10% down · 12.0% · 12mo
- Down + closing
- —
- Monthly P&I
- —
- Monthly cashflow
- —
- DSCR
- —
- Eligible?
- —
Short-term bridge; refi at stabilization.
Rent comps 26 comps
| Address | Beds | Baths | Sqft | Rent | $/sqft | DOM | Units | Dist |
|---|---|---|---|---|---|---|---|---|
| 1211 Robert King High Dr Lakeland, FL | 3.0 | 1.5 | 1050 | $1,625 | $1.55 | 24d | 1 | 0.17mi |
| 1550 Wright Dr Lakeland, FL | 3.0 | 1.5 | 1139 | $1,650 | $1.45 | 22d | 1 | 0.28mi |
| 820 W 13th St Lakeland, FL | 2.0 | 1.0 | 950 | $1,300 | $1.37 | 24d | 1 | 0.46mi |
| 1704 Martin L King Jr Ave Lakeland, FL | 2.0 | 2.0 | 1050 | $5,000 | $4.76 | 24d | 1 | 0.63mi |
| 408 Bassedena Cir N Lakeland, FL | 3.0 | 2.0 | 1075 | $1,825 | $1.70 | 24d | 1 | 0.73mi |
| 1615 N New York Ave Lakeland, FL | 2.0 | 1.0 | 1300 | $1,195 | $0.92 | 24d | 1 | 0.79mi |
| 1128 Neville Ave Lakeland, FL | 3.0 | 2.0 | 1245 | $1,900 | $1.53 | 15d | 1 | 0.83mi |
| 1105 Jewel Ave Lakeland, FL | 2.0 | 1.0 | 987 | $1,200 | $1.22 | 24d | 1 | 0.92mi |
| 321 Queen Mary Loop Lakeland, FL | 2.0 | 2.0 | 1244 | $1,599 | $1.29 | 4d | 1 | 0.95mi |
| 123 Oconee St Unit 1368863P Lakeland, FL | 2.0 | 1.0 | 990 | $2,441 | $2.47 | 12d | 1 | 0.96mi |
| 1137 Edith Ave Lakeland, FL | 3.0 | 1.0 | 1100 | $1,800 | $1.64 | 4d | 1 | 0.99mi |
| 454 King Edward Ave Lakeland, FL | 2.0 | 2.0 | 1048 | $1,399 | $1.33 | 4d | 1 | 1.00mi |
| 1031 N Florence Ave Unit NA Lakeland, FL | 3.0 | 2.0 | 1100 | $1,495 | $1.36 | 15d | 1 | 1.13mi |
| 1906 Griffin Rd Lakeland, FL | 1.0–3.0 | 1.0–2.0 | 1148 | $2,339 | $2.04 | 4d | 11 | 1.14mi |
| 809 Adams St Lakeland, FL | 3.0 | 1.0 | 1164 | $1,525 | $1.31 | 15d | 1 | 1.20mi |
| 617 Lakehurst St Lakeland, FL | 3.0 | 2.0 | 1100 | $1,900 | $1.73 | 20d | 1 | 1.25mi |
| 2340 Shasta St Lakeland, FL | 3.0–5.0 | 2.0–3.0 | 2098 | $2,185 | $1.04 | 4d | 3 | 1.27mi |
| 850 Martin L King Jr Ave Lakeland, FL | 3.0 | 1.0 | 1222 | $1,495 | $1.22 | 24d | 1 | 1.27mi |
| 738 N Lorri Ave Lakeland, FL | 4.0 | 2.5 | 1500 | $2,600 | $1.73 | 15d | 1 | 1.29mi |
| 1846 Masters Ln Lakeland, FL | 2.0 | 2.0 | 1487 | $1,800 | $1.21 | 22d | 1 | 1.31mi |
| 721 E Lowell St Lakeland, FL | 3.0 | 2.0 | 1298 | $1,595 | $1.23 | 24d | 1 | 1.32mi |
| 720 Lakehurst St Lakeland, FL | 3.0 | 2.0 | 1092 | $1,750 | $1.60 | 24d | 1 | 1.32mi |
| 815 N Davis Ave Lakeland, FL | 3.0 | 2.0 | 960 | $1,450 | $1.51 | 24d | 1 | 1.34mi |
| 3697 Hampton Hills Dr Lakeland, FL | 4.0 | 2.0 | 1746 | $2,150 | $1.23 | 24d | 1 | 1.37mi |
| 806 N Swindell Ave Lakeland, FL | 3.0 | 2.0 | 995 | $1,450 | $1.46 | 24d | 1 | 1.42mi |
| 1127 N Vermont Ave Lakeland, FL | 4.0 | 2.0 | 1495 | $2,200 | $1.47 | 15d | 1 | 1.44mi |
Listing history 4 events
-
2026-06-03remarks 623-char remark
-
2026-06-03statusdays on market $160,000 Pending 2 DOM
-
2026-06-01remarks 583-char remark
-
2026-06-01$160,000 Active 1 DOM
ⓘ Source: listings_history table (triggers on properties + properties_extension) + one-shot
backfill from property_details.listing_events for pre-trigger history.
Tax reassessment forecast FL · Resets to sale price
- Current annual tax
- $2,933 · $244/mo
- Projected year-2 tax
- $2,933 · $244/mo
- Expected delta
- $0/yr ($0/mo · 0.0%)
ⓘ Screening estimate from a state-policy table — verify with the county assessor before closing.
Climate risk First Street
- Flood 1/10 Low FEMA zone X (unshaded) · 0% chance over 30 yrs
- Wildfire 2/10 Low
- Heat 8/10 Severe 7 d/yr ≥108°F today · 23 d/yr by 30 yrs out
- Wind 9/10 Extreme 99% chance of damaging wind over 30 yrs
- Air quality 2/10 Low 1 unhealthy d/yr today · 1 by 30 yrs out
Nearby sold comps map
Loading sold comps map…
Walkable amenities ~0.75 mi
Loading nearby amenities…
Taxation est. · year 1
- Rental income
- $20,967
- − Mortgage interest
- −$8,962
- − Property taxes
- −$2,933
- − Insurance
- −$800
- − Repairs & maintenance
- −$1,677
- − Management
- −$1,677
- − Depreciation
- −$4,655
- Taxable income
- $263
- Est. tax owed @ 24.0%
- −$63
- After-tax cash flow
- $2,700/yr
For passive investors: Depreciation is non-cash, so a rental often shows a tax loss while cash-flowing — sheltering income. Rental losses are passive: they offset passive income freely, and up to $25,000/yr can offset ordinary (W-2) income if you actively participate and your MAGI is under $100k (phasing out to $0 by $150k); unused losses carry forward. On sale, claimed depreciation is recaptured at up to 25%, and gains may owe capital-gains tax (a 1031 exchange can defer both). Figures are a year-1 estimate at your 24.0% rate — not tax advice; consult a CPA.
Schools (NCES district)
- District
- Polk
- NCES district ID
- 1201590
- Math proficiency
- 39% ▼ -11.00%
- Reading proficiency
- 43% ▼ -4.00%
- Median HH income
- $43,979
- Composite
- 34.74/100
- National rank
- #5132
- State rank
- #62 of 73 in FL
Livability — Lakeland
- Score
- 77/100
- State rank
- #206
- US rank
- #3179
Category grades
Schools grade is shown separately in the Schools card above.
Census & demographics
- Census place
- Lakeland, FL
- County
- Polk County · 740,051 people
- City population
- 277,690
- Metro
- Lakeland-Winter Haven, FL
- Population (ZIP)
- 28,751
- Household income
- $62,661
- Rent vs Own
- Severe rent burden
- 1179.0
Population outlook (Polk County) Hauer SSP2
- Today (2025)
- 752,975 people
- By 2030
- 804,621 · +6.9%
- By 2040
- 906,117 · +20.3%
- By 2050
- 1,000,476 · +32.9%
- By 2075
- 1,197,520 · +59.0%
- By 2100
- 1,271,518 · +68.9%
Race, ethnicity, and origin ACS 2023
- Neighborhood character
- Diverse neighborhood (Simpson 0.68)
- Race & ethnicity
- White 38% Black 37% Hispanic / Latino 20% Two or more races 8% Asian 1%
- Hispanic origin (detail)
- Mexican 5% Puerto Rican 9% Cuban 2%
- Common ancestry
- Hispanic 2% Lithuanian 1% Romanian 1%
- Foreign-born
- 12% · Canada, Jamaica
- Languages at home
- 79% English-only · Spanish 16% French/Haitian/Cajun 2% Other Asian/Pacific 1%
Political lean MEDSL · Polk
- 2024 margin
- Strong R (+20.7) · D 39.2% · R 59.9%
- 2008→2024 swing
- -14.6pp toward R · 2008: -6.1pp · 2024: -20.7pp
- All cycles
- 2024: R+20.7 2020: R+14.4 2016: R+14.1 2012: R+6.8 2008: R+6.1
Not yet ingested
- Civics
- —
Market trends
- HPI YoY
- ▼ -158.44%
- Current HPI
- 372.7317
- Rent YoY
- ▲ 0.77%
- Metro
- Lakeland-Winter Haven, FL
- State GDP YoY
- ▲ 3.28%
- F500 in state
- 36
Industry mix (Fortune 500 HQ in FL)
| Industry | F500 HQs | Revenue |
|---|---|---|
| Industrial Technology | 2 | $29B |
|
||
| Insurance | 2 | $17B |
|
||
| Retail | 1 | $60B |
|
||
| Technology Distribution | 1 | $58B |
|
||
| Homebuilding | 1 | $35B |
|
||
| Technology Manufacturing | 1 | $35B |
|
||
Price history
+166.7% since first listed6 events — show timeline
- 2026-05-31 Listed $160,000 Stellar MLS as Distributed by MLS Grid
- 2019-06-11 Listing Removed — Stellar MLS as Distributed by MLS Grid
- 2019-03-11 Price Changed $142,900 Stellar MLS as Distributed by MLS Grid
- 2018-12-11 Listed $155,900 Stellar MLS as Distributed by MLS Grid
- 1999-07-01 Sold (Public Records) $69,000 Public Records
- 1990-07-01 Sold (Public Records) $60,000 Public Records
Property tax history
+28.2%/yrLatest (2025): $2,933 · +4.8% YoY. Source: county tax records.
Cash-flow waterfall
monthlySold comps — $/sqft
last 12 mo · ≤1 miLoading sold comps…