 🏗️ New Construction
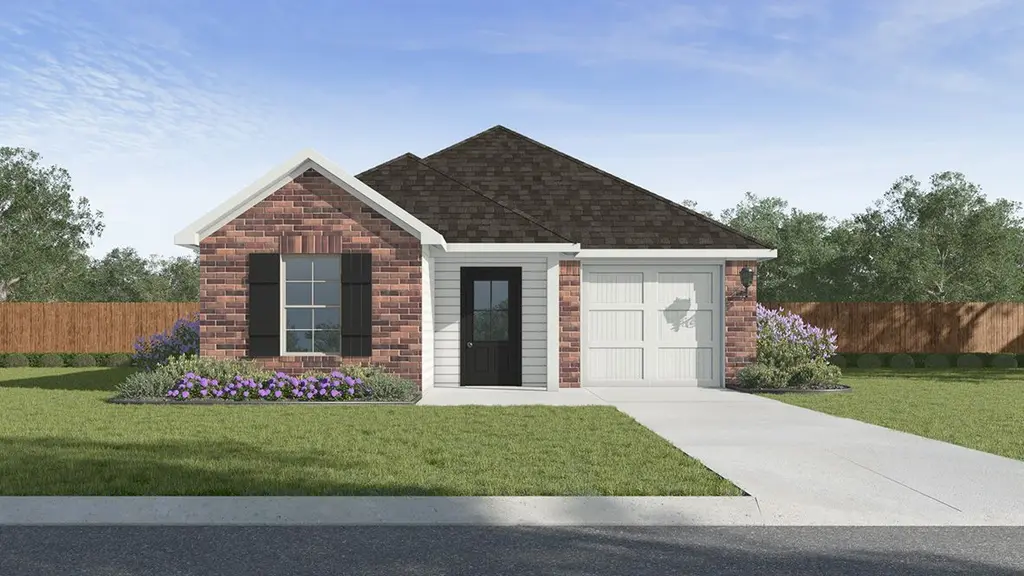
Bella Plan · Duson, LA
Flood risk No data
- FEMA flood zone
- —
- Chance of flooding over 30 yrs
- —
- Est. flood insurance / yr
- —
Fire risk No data
- Est. fire insurance / yr
- —
Heat risk No data
- Hot days now (above threshold)
- —
- Hot days in 30 yrs
- —
Wind risk No data
- Chance of severe wind over 30 yrs
- —
Air-quality risk No data
- Unhealthy air days now
- —
- Unhealthy air days in 30 yrs
- —
Risk factors via First Street. Map © Google.
Why this score? — see what drove the D+ grade
The composite is a weighted blend of 9 inputs, each scored 0–100. Each bar is that input's sub-score; the figure is the points it added to the 100-point composite (weight × sub-score).
- Cash flow +16.3/30.0
- ARV discount +7.5/15.0
- DSCR +5.0/10.0
- Condition / age +5.0/5.0
- 1% rule +4.4/10.0
- Livability +3.3/5.0
- Schools +3.2/10.0
- Rent growth +2.5/5.0
- Appreciation +0.0/10.0
$210,500
🖨 Deal sheet (PDF) 📄 Offer letter ✓ Due diligence
Listing remarks
Welcome to the Bella! A new home in Cane Place in Duson, Louisiana. The Bella is a thoughtfully designed single-story home that blends comfort, efficiency, and everyday functionality. This 3 bed, 2 bath layout offers a smart use of space while maintaining an open and inviting feel. Upon entry from the front porch, you're welcomed into a central space that flows seamlessly from the living area into the dining area and kitchen. The kitchen is well-appointed with ample counter space, a pantry for extra storage, stainless steel appliances, and convenient access to the dining room. The covered patio sits just off the living room, extending your living space outdoors and providing a perfect spot
Key facts
- Ample counter space
- Walk-in closet
- Ensuite bath
Tags
Property features AI
Finance
- Financial info: List price $210,500
Exterior
- Parking: 1-car garage (1 total parking space)
- Home design: Single-family plan; Inventory type: Plan
- Exterior features: Living area approximately 1,370 (living area provided)
Interior
- Bedrooms: 3 bedrooms
- Bathrooms: 2 full bathrooms
- Interior features: Plan: Bella (new construction plan)
Neighborhood map
What this means for you Summary
Snapshot
- This is a 3-bed/2.0-bath single-family listed at $210k. Condition is rated excellent.
Deal economics
- At list price, monthly cash flow is $109 ($1k/yr) — positive.
- The deal already cash-flows at list — no discount required.
- To meet the 1% rule (rent ≥ 1% of price), the offer needs to be $190k (9.7% below list).
- Recommended offer: $190k (9.7% below list) — sets the bar for 1% rule.
- Cap rate 6.9% vs local median 5.4% in Duson — meaningfully above typical; check what's discounted (condition, days-on-market, listing class) to confirm the premium yield is real.
Location & tenants
- Location reads 66/100 on livability (#134 in LA) — a middle-class / working-renter tenant base. Strengths: cost of living A+, housing A+, health & safety B+; Watch: amenities F, commute F, employment F.
- Acadia Parish (rural): math 32% / reading 44% proficiency, ranked #28 of 98 in LA (top 29%) — families likely to look elsewhere, expect single-tenant / working-renter base with shorter leases; 62% free/reduced lunch — lower-income household profile, screen leases tightly.
- Zoned schools: Mire Elementary School (math 44% / reading 52%, grade D, #144 of 646 statewide, top 22%, 666 students, 55% FRL); Rayne High School (math 30% / reading 47%, grade F, #88 of 265 statewide, top 33%, 640 students, 63% FRL) — zoned schools at 59% FRL track the district average.
- Market conditions: 197 active listings in the ZIP; 1 comparable units currently listed for rent nearby; 137 units permitted in Acadia Parish in 2024 (0 in 5+ unit buildings).
Forward outlook
- Local home prices are declining (-3.0%/yr); year-one equity from $1k of loan paydown is wiped out by about $6k of value loss. Plan a longer hold.
Negotiation context
- Only 12 days on market — expect competitive offers; lowballing is unlikely to land.
Questions for the listing agent
- Is there a deadline driving the sale (1031 exchange, divorce, estate, relocation)? That informs how much negotiation room exists.
- The area grade is low — what's the realistic commute time and amenity access for the typical tenant pool here? Any planned neighborhood developments (good or bad) we should know about?
- What's the average days-on-market for RENTAL listings here right now (not sales)? A rising rental-DOM trend means longer vacancies and softer asking-rent achievability than the comps imply.
- What's the recent tenant-quality profile in this submarket — average credit score on applications, eviction rate, late-payment / NSF rate, and stable-employment percentage? A property-management company in the area should have these aggregated.
- How much new for-sale + rental construction is in the pipeline within 1–3 miles? Heavy new supply typically softens prices + rents 12–24 months out; constrained supply supports both.
Investment metrics
- 1% rule
- 0.94% ✗
- Cap rate
- 6.94%
- Cash-on-cash
- 2.32%
- DSCR
- 1.10
- GRM
- 8.8
CMA / ARV
- ARV (on-the-fly)
- $201,390
- Comps found
- 12
Show comp detail 12 sales within ~0.75 mi
| Address | Dist | Beds/Ba | Sqft | Sold | Price | $/sf | Match |
|---|---|---|---|---|---|---|---|
| 141 Ivywood Ct | 0.21mi | 3/2.0 | 1,447 (+6%) | 4mo | $220,500 | $152 | 77 |
| 500 4th St | 0.36mi | 3/2.0 | 1,296 (-5%) | 3mo | $60,000 | $46 | 72 |
| 307 Meadow Ridge Ln | 0.57mi | 3/2.0 | 1,321 (-4%) | 2mo | $199,035 | $151 | 66 |
| 205 Meadow Ridge Ln | 0.61mi | 3/2.0 | 1,321 (-4%) | 1mo | $199,880 | $151 | 65 |
| 119 Rosebrook Ln | 0.65mi | 3/2.0 | 1,422 (+4%) | 4mo | $209,339 | $147 | 60 |
| 118 Ember Ridge Ln | 0.71mi | 3/2.0 | 1,422 (+4%) | 2mo | $208,187 | $146 | 59 |
| 118 Rosebrook Ln | 0.68mi | 3/2.0 | 1,321 (-4%) | 6mo | $201,080 | $152 | 57 |
| 305 Meadow Ridge Ln | 0.57mi | 3/2.0 | 1,482 (+8%) | 4mo | $217,946 | $147 | 57 |
| 111 Ember Ridge Ln | 0.69mi | 3/2.0 | 1,422 (+4%) | 6mo | $208,040 | $146 | 56 |
| 409 Meadow Ridge Ln | 0.57mi | 3/2.0 | 1,498 (+9%) | 2mo | $221,370 | $148 | 56 |
| 401 Meadow Ridge Ln | 0.57mi | 3/2.0 | 1,498 (+9%) | 5mo | $220,746 | $147 | 54 |
| 113 Ember Ridge Ln | 0.69mi | 3/2.0 | 1,498 (+9%) | 6mo | $217,910 | $145 | 48 |
Match score weights: distance 35% · size 25% · config 20% · recency 20%. Top-matched comps best support the ARV.
Projected returns pro-forma
-3.0% appreciation · 3.0% rent growth · sell at horizon
- IRR
- -12.6%
- Equity multiple
- 0.55×
- Total profit
- $-25,648
- Equity at exit
- $30,028
- IRR
- -3.5%
- Equity multiple
- 0.76×
- Total profit
- $-13,258
- Equity at exit
- $17,413
Cash invested: $56,389 (down + closing). Projections, not guarantees.
Landlord ↔ Tenant lean methodology
- Overall (STATE)
- 90 Strongly Landlord-Friendly
- State Louisiana
- 90 Strongly Landlord-Friendly · R+12
- County
- — inherits STATE
- City
- — inherits STATE
ZIP-level market 70529
- Home prices YoY
- -11.1%
- Active inventory
- 197
- Price-to-rent
- 9.2×
Monthly cashflow live
- Estimated rent
- $1,900 medium interval (Pro) →
- Mortgage (P&I)
- −$1,056
- Tax est. 1.5%
- −$252 /mo · $3,021/yr
- Insurance
- −$84
- HOA
- −$0
- Vacancy / Maint / Mgmt
- −$399
- Net cashflow
- $109
Break-even live
Sensitivity live
| Price | -10% $248 | -5% $179 | +0% $109 | +5% $40 | +10% $-30 |
|---|---|---|---|---|---|
| Rent | -10% $-41 | -5% $34 | +0% $109 | +5% $184 | +10% $259 |
| Rate | -1.0pp $211 | -0.5pp $160 | base $109 | +0.5pp $57 | +1.0pp $4 |
UW: 25.0% down · 7.5% · 30yr · 1.5% tax · 5.0% vac · 8.0% maint · 8.0% mgmt
Financing live
Cash to close
- Down payment
- $50,348
- Closing costs
- $6,042
- Reserves months
- —
- Total cash needed
- —
Loan-product check · same deal, 3 products live
Conventional
25% down · 7.5% · 30yr
- Down + closing
- —
- Monthly P&I
- —
- Monthly cashflow
- —
- DSCR
- —
- Eligible?
- —
Personal DTI + credit; lowest rate.
DSCR
20% down · 8.5% · 30yr
- Down + closing
- —
- Monthly P&I
- —
- Monthly cashflow
- —
- DSCR
- —
- Eligible?
- —
No personal income docs; deal must DSCR.
Hard money
10% down · 12.0% · 12mo
- Down + closing
- —
- Monthly P&I
- —
- Monthly cashflow
- —
- DSCR
- —
- Eligible?
- —
Short-term bridge; refi at stabilization.
Rent comps 1 comps
| Address | Beds | Baths | Sqft | Rent | $/sqft | DOM | Units | Dist |
|---|---|---|---|---|---|---|---|---|
| 211 Winter Park PL Duson, LA | 2.0–3.0 | 2.0 | 1275 | $1,900 | $1.49 | 15d | 1 | 0.44mi |
Listing history 10 events
-
2026-06-21days on market $210,500 Active 12 DOM
-
2026-06-21days on market $210,500 Active 11 DOM
-
2026-06-18days on market $210,500 Active 9 DOM
-
2026-06-17days on market $210,500 Active 8 DOM
-
2026-06-16days on market $210,500 Active 7 DOM
-
2026-06-15days on market $210,500 Active 6 DOM
-
2026-06-13days on market $210,500 Active 4 DOM
-
2026-06-12days on market $210,500 Active 3 DOM
-
2026-06-09remarks 699-char remark
-
2026-06-09$210,500 Active 1 DOM
ⓘ Source: listings_history table (triggers on properties + properties_extension) + one-shot
backfill from property_details.listing_events for pre-trigger history.
Nearby sold comps map
Loading sold comps map…
Walkable amenities ~0.75 mi
Loading nearby amenities…
Taxation est. · year 1
- Rental income
- $22,800
- − Mortgage interest
- −$11,281
- − Property taxes
- −$3,021
- − Insurance
- −$1,007
- − Repairs & maintenance
- −$1,824
- − Management
- −$1,824
- − Depreciation
- −$5,859
- Taxable loss
- −$2,015
- Est. tax savings @ 24.0%
- +$484
- After-tax cash flow
- $1,795/yr
For passive investors: Depreciation is non-cash, so a rental often shows a tax loss while cash-flowing — sheltering income. Rental losses are passive: they offset passive income freely, and up to $25,000/yr can offset ordinary (W-2) income if you actively participate and your MAGI is under $100k (phasing out to $0 by $150k); unused losses carry forward. On sale, claimed depreciation is recaptured at up to 25%, and gains may owe capital-gains tax (a 1031 exchange can defer both). Figures are a year-1 estimate at your 24.0% rate — not tax advice; consult a CPA.
Condition & rehab AI · 4 photos
This home is in excellent condition with no visible repairs or maintenance needed. It offers a great opportunity for an investor to enhance its curb appeal and interior aesthetics with minor updates, which would significantly increase its resale and rental value.
Value-add opportunities
- Both Painting exterior and interior — Enhances curb appeal and interior aesthetics
- Both Landscaping improvements — Enhances curb appeal and adds value
- Resale New flooring in bathrooms — Improves appearance and functionality
- Resale New kitchen appliances — Enhances functionality and appeal
Renovation cost estimate screening
Value-add ROI direction
- Both Painting exterior and interior — Enhances curb appeal and interior aesthetics ↑
- Both Landscaping improvements — Enhances curb appeal and adds value ↑
- Resale New flooring in bathrooms — Improves appearance and functionality ↑
- Resale New kitchen appliances — Enhances functionality and appeal ↑
ⓘ Cost ranges are severity-bucket heuristics (US national rule-of-thumb). Get contractor quotes + a written scope before underwriting a rehab budget.
Schools (NCES district)
- District
- Acadia Parish
- NCES district ID
- 2200030
- Math proficiency
- 32% ▼ -39.00%
- Reading proficiency
- 44% ▼ -32.00%
- Median HH income
- $38,012
- Composite
- 31.65/100
- National rank
- #5929
- State rank
- #28 of 98 in LA
Livability — Duson
- Score
- 66/100
- State rank
- #134
- US rank
- #12322
Category grades
Schools grade is shown separately in the Schools card above.
Census & demographics
- Census place
- Duson, LA
- Population (ZIP)
- 13,557
Population outlook (Acadia County) Hauer SSP2
- Today (2025)
- 63,846 people
- By 2030
- 64,141 · +0.5%
- By 2040
- 63,922 · +0.1%
- By 2050
- 62,263 · -2.5%
- By 2075
- 56,507 · -11.5%
- By 2100
- 46,316 · -27.5%
Race, ethnicity, and origin ACS 2023
- Neighborhood character
- Diverse neighborhood (Simpson 0.55)
- Race & ethnicity
- White 62% Black 25% Hispanic / Latino 6% Two or more races 6%
- Hispanic origin (detail)
- Common ancestry
- Lithuanian 16% English 1% Iranian 1%
- Foreign-born
- 6% · Canada
- Languages at home
- 90% English-only · Spanish 5% French/Haitian/Cajun 4%
Political lean MEDSL · Acadia
- 2024 margin
- Solid R (+64.0) · D 17.6% · R 81.5%
- 2008→2024 swing
- -18.3pp toward R · 2008: -45.7pp · 2024: -64.0pp
- All cycles
- 2024: R+64.0 2020: R+60.3 2016: R+56.7 2012: R+49.8 2008: R+45.7
Not yet ingested
- Civics
- —
Market trends
- HPI YoY
- ▼ -23.96%
- Current HPI
- 192.2639
- Rent YoY
- —
- Metro
- —
- State GDP YoY
- ▲ 3.29%
- F500 in state
- 10
Industry mix (Fortune 500 HQ in LA)
| Industry | F500 HQs | Revenue |
|---|---|---|
| Telecommunications | 2 | $23B |
|
||
| Utilities | 1 | $12B |
|
||
| Wholesale / Distribution | 1 | $5B |
|
||
| Advertising | 1 | $2B |
|
||
Cash-flow waterfall
monthlySold comps — $/sqft
last 12 mo · ≤1 miLoading sold comps…