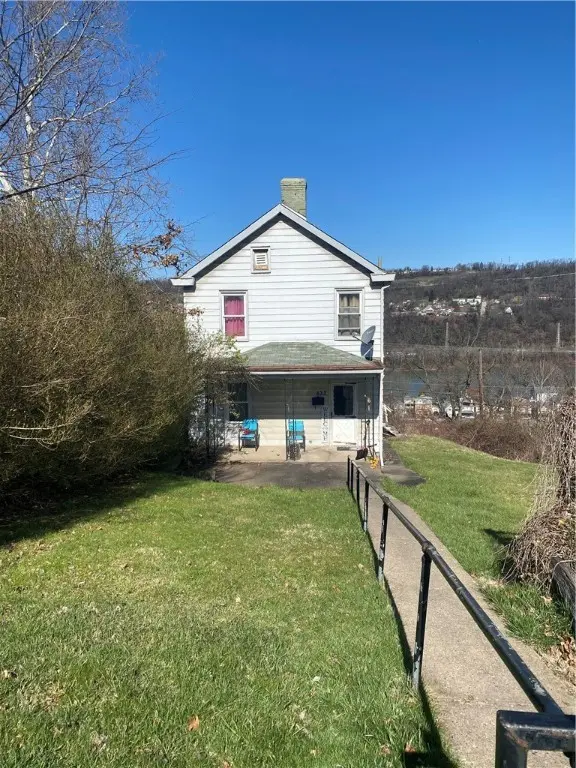
533 Monterey St · McKeesport, PA
Flood risk 1/10 · Minimal
- FEMA flood zone
- X (unshaded)
- Chance of flooding over 30 yrs
- 0.0%
- Est. flood insurance / yr
- $473 – $860
Fire risk 1/10 · Minimal
- Est. fire insurance / yr
- $511 – $949
Heat risk 4/10 · Minor
- Hot days now (above 97°F)
- 7 days/yr
- Hot days in 30 yrs
- 18 days/yr
Wind risk 2/10 · Minimal
- Chance of severe wind over 30 yrs
- —
Air-quality risk 5/10 · Moderate
- Unhealthy air days now
- 8 days/yr
- Unhealthy air days in 30 yrs
- 8 days/yr
Risk factors via First Street. Map © Google.
Why this score? — see what drove the B grade
The composite is a weighted blend of 9 inputs, each scored 0–100. Each bar is that input's sub-score; the figure is the points it added to the 100-point composite (weight × sub-score).
- Cash flow +30.0/30.0
- ARV discount +13.6/15.0
- 1% rule +10.0/10.0
- DSCR +10.0/10.0
- Livability +3.3/5.0
- Rent growth +2.5/5.0
- Condition / age +2.5/5.0
- Schools +1.6/10.0
- Appreciation +0.0/10.0
$58,900
🖨 Deal sheet 📄 Offer letter ✓ Due diligence
Listing remarks MLS
Investor special! Tenant occupied. Own your first investment property or add to your portfolio. 2-bedroom 1 bath two-story single-family house. Or flip this property for extra cash. This opportunity can be yours. Call or text today!
Key facts
- 5,806 sq ft lot
- Built 1928
- Listed 190 days
Neighborhood map
What this means for you Summary
Snapshot
- This is a 2-bed/1.0-bath single-family listed at $59k.
Deal economics
- At list price, monthly cash flow is $502 ($6k/yr) — positive.
- The deal already cash-flows at list — no discount required.
- Meets the 1% rule at list price ($1k rent vs $59k).
- Recommended offer: $52k (12.0% below list) — sets the bar for market timing.
- Cap rate 16.5% vs local median 10.3% in McKeesport — top-decile yield for the area; either an underpriced asset or a hidden risk that comps aren't pricing in. Stress-test before assuming the spread holds.
Location & tenants
- Location reads 66/100 on livability (#1,089 in PA) — a middle-class / working-renter tenant base. Strengths: commute A+, cost of living A+, housing A+; Watch: schools D+, health & safety D, crime F.
- Mckeesport Area SD (suburban): math 11% / reading 28% proficiency, ranked #499 of 539 in PA (top 93%) — low school quality limits family demand, transient renter base, plan for 1-2y turnover; 66% free/reduced lunch — lower-income household profile, screen leases tightly.
- Market conditions: 113 active listings in the ZIP; 11 comparable units currently listed for rent nearby; rentals at typical pace (median 24d on market — plan ~3-4 weeks tenant-placement turnaround); lower-income renter base — watch delinquency; 2,996 units permitted in Allegheny County in 2024 (1,588 in 5+ unit buildings).
- This rent runs 39% of the median local income ($35k/yr) — at the standard rent-burdened threshold; future hikes will face affordability resistance.
Forward outlook
- Local home prices are declining (-3.0%/yr); year-one equity from $407 of loan paydown is wiped out by about $2k of value loss. Plan a longer hold.
- At projected returns (-3.0% appreciation + 3.0% rent growth), your $16k cash investment doubles in ~4 years — after that, you're playing with house money.
Negotiation context
- It's been on market 190 days — a 12% lower offer ($52k) is reasonable based on typical stale-listing flexibility.
- 2 sale attempts since 29y ago with the ask held roughly flat each time — persistent listings suggest the price (not the market) is what's stuck; bring a comps-based counter.
- Current owner paid $14k; list at $59k implies a 306% gain — meaningful room to come down on a strong offer.
Risks & watch-outs
- Watch-outs: built in 1928 — expect roof / HVAC / electrical / plumbing capex.
Questions for the listing agent
- It's been on market 190 days. Have you received any prior offers? Is the seller open to a 12% concession, seller financing, or rate buy-down credit?
- Built in 1928 — when were the roof, HVAC, electrical panel, plumbing, and water heater last replaced?
- Why hasn't it sold? Are there any deal-killer items the seller is aware of (foundation, flood, title, zoning, code violations)?
- Is there a deadline driving the sale (1031 exchange, divorce, estate, relocation)? That informs how much negotiation room exists.
- Schools are D-rated, which usually means shorter tenancies and higher turnover. Who's the typical renter profile here, and what's been the actual vacancy rate?
- Crime grade is F in this area — have there been break-ins, vandalism, or insurance claims at this property in the last 3 years? What carrier currently insures it and at what premium?
- What's the average days-on-market for RENTAL listings here right now (not sales)? A rising rental-DOM trend means longer vacancies and softer asking-rent achievability than the comps imply.
- What's the recent tenant-quality profile in this submarket — average credit score on applications, eviction rate, late-payment / NSF rate, and stable-employment percentage? A property-management company in the area should have these aggregated.
- How much new for-sale + rental construction is in the pipeline within 1–3 miles? Heavy new supply typically softens prices + rents 12–24 months out; constrained supply supports both.
Investment metrics
- 1% rule
- 1.94% ✓
- Cap rate
- 16.52%
- Cash-on-cash
- 36.54%
- DSCR
- 2.63
- GRM
- 4.3
CMA / ARV
- ARV (median comp)
- $68,089
- List price
- $58,900
- Delta
- -13.50%
- Verdict
- UNDERPRICED
- Comps
- 20 within 1.0 mi
Show comp detail 12 sales within ~0.75 mi
| Address | Dist | Beds/Ba | Sqft | Sold | Price | $/sf | Match |
|---|---|---|---|---|---|---|---|
| 505 Manning Ave | 0.17mi | 2/2.0 | 1,072 (-9%) | 3mo | $168,000 | $157 | 71 |
| 411 Archer St | 0.15mi | 3/1.0 (+1) | 1,120 (-5%) | 12mo | $65,139 | $58 | 70 |
| 502 Archer St | 0.10mi | 2/1.0 | 1,024 (-13%) | 5mo | $53,000 | $52 | 70 |
| 435 Pacific St | 0.17mi | 2/1.0 | 1,024 (-13%) | 1mo | $24,000 | $23 | 70 |
| 416 Pine St | 0.30mi | 2/1.5 | 1,280 (+9%) | 4mo | $18,000 | $14 | 66 |
| 308 W 6th Ave | 0.21mi | 3/1.5 (+1) | 1,264 (+8%) | 12mo | $56,000 | $44 | 61 |
| 418 Arctic St | 0.29mi | 3/1.0 (+1) | 1,032 (-12%) | 7mo | $90,000 | $87 | 55 |
| 1023 Bellair Rd | 0.57mi | 3/2.0 (+1) | 1,085 (-8%) | 10mo | $165,000 | $152 | 43 |
| 1107 Norwood Ave | 0.47mi | 3/2.5 (+1) | 1,312 (+12%) | 14mo | $224,000 | $171 | 36 |
| 1304 Mcclelland Dr | 0.70mi | 3/2.0 (+1) | 1,088 (-8%) | 15mo | $138,500 | $127 | 33 |
| 1434 Washington Blvd | 0.68mi | 3/2.0 (+1) | 1,053 (-10%) | 10mo | $153,500 | $146 | 33 |
| 1213 Mcclelland Dr | 0.65mi | 3/2.0 (+1) | 1,330 (+13%) | 10mo | $125,000 | $94 | 31 |
Match score weights: distance 35% · size 25% · config 20% · recency 20%. Top-matched comps best support the ARV.
Projected returns pro-forma
-3.0% appreciation · 3.0% rent growth · sell at horizon
- IRR
- 32.4%
- Equity multiple
- 2.36×
- Total profit
- $22,456
- Equity at exit
- $8,782
- IRR
- 39.4%
- Equity multiple
- 4.69×
- Total profit
- $60,796
- Equity at exit
- $5,093
Cash invested: $16,492 (down + closing). Projections, not guarantees.
Landlord ↔ Tenant lean methodology
- Overall (STATE)
- 62 Landlord-Friendly
- State Pennsylvania
- 62 Landlord-Friendly · EVEN
- County
- — inherits STATE
- City
- — inherits STATE
ZIP-level market 15132
- Home prices YoY
- -32.9%
- Active inventory
- 113
- Price-to-rent
- 4.3×
Monthly cashflow live
- Estimated rent
- $1,143 high interval (Pro) →
- Mortgage (P&I)
- −$309
- Tax from tax record
- −$67 /mo · $809/yr
- Insurance
- −$25
- HOA
- −$0
- Vacancy / Maint / Mgmt
- −$240
- Net cashflow
- $502
Break-even live
UW: 25.0% down · 7.5% · 30yr · 1.5% tax · 5.0% vac · 8.0% maint · 8.0% mgmt
Financing live
Cash to close
- Down payment
- $14,725
- Closing costs
- $1,767
- Reserves months
- —
- Total cash needed
- —
Loan-product check · same deal, 3 products live
Conventional
25% down · 7.5% · 30yr
- Down + closing
- —
- Monthly P&I
- —
- Monthly cashflow
- —
- DSCR
- —
- Eligible?
- —
Personal DTI + credit; lowest rate.
DSCR
20% down · 8.5% · 30yr
- Down + closing
- —
- Monthly P&I
- —
- Monthly cashflow
- —
- DSCR
- —
- Eligible?
- —
No personal income docs; deal must DSCR.
Hard money
10% down · 12.0% · 12mo
- Down + closing
- —
- Monthly P&I
- —
- Monthly cashflow
- —
- DSCR
- —
- Eligible?
- —
Short-term bridge; refi at stabilization.
Rent comps 11 comps
| Address | Beds | Baths | Sqft | Rent | $/sqft | DOM | Units | Dist |
|---|---|---|---|---|---|---|---|---|
| 6 4th St Dravosburg, PA | 2.0 | 1.0 | 1250 | $1,350 | $1.08 | 23d | 1 | 0.71mi |
| 308 Marie St Glassport, PA | 2.0 | 1.0 | 850 | $925 | $1.09 | 17d | 1 | 0.83mi |
| 306 Laredo St McKeesport, PA | 2.0 | 1.0 | 928 | $995 | $1.07 | 43d | 1 | 0.89mi |
| 604 Shaw Ave McKeesport, PA | 2.0 | 1.0–1.5 | 800 | $900 | $1.12 | 12d | 3 | 1.00mi |
| 604 Shaw Ave Unit 101 McKeesport, PA | 2.0 | 1.5 | 1050 | $900 | $0.86 | 14d | 1 | 1.00mi |
| 604 Shaw Ave Unit 102 McKeesport, PA | 1.0 | 1.0 | 750 | $750 | $1.00 | 43d | 1 | 1.00mi |
| 1805 Gray St McKeesport, PA | 3.0 | 1.0 | 1136 | $1,600 | $1.41 | 1d | 1 | 1.11mi |
| 1451 Jenny Lind St McKeesport, PA | 3.0 | 1.5 | 1408 | $1,150 | $0.82 | 23d | 1 | 1.14mi |
| 3101 Homestead Duquesne Rd West Mifflin, PA | 2.0 | 1.0 | 924 | $900 | $0.97 | 43d | 1 | 1.24mi |
| 1744 Highland Ave West Mifflin, PA | 2.0 | 1.0 | 1100 | $1,549 | $1.41 | 4d | 1 | 1.43mi |
| 1704 Anna Ave West Mifflin, PA | 2.0 | 1.5 | 1160 | $1,395 | $1.20 | 23d | 1 | 1.48mi |
Listing history 17 events
-
2026-06-18days on market $58,900 Active 190 DOM
-
2026-06-17days on market $58,900 Active 189 DOM
-
2026-06-16days on market $58,900 Active 188 DOM
-
2026-06-15days on market $58,900 Active 187 DOM
-
2026-06-13days on market $58,900 Active 185 DOM
-
2026-06-13days on market $58,900 Active 184 DOM
-
2026-06-09days on market $58,900 Active 181 DOM
-
2026-06-08days on market $58,900 Active 180 DOM
-
2026-06-07days on market $58,900 Active 179 DOM
-
2026-06-03days on market $58,900 Active 175 DOM
-
2026-06-02days on market $58,900 Active 174 DOM
-
2026-06-01days on market $58,900 Active 173 DOM
-
2026-05-31days on market $58,900 Active 172 DOM
-
2025-12-10$58,900 Active 232-char remark
Show marketing remark (232 chars)
Investor special! Tenant occupied. Own your first investment property or add to your portfolio. 2-bedroom 1 bath two-story single-family house. Or flip this property for extra cash. This opportunity can be yours. Call or text today!
-
1998-04-09soldstatus $14,500
-
1998-04-07soldstatus $14,500 116-char remark
Show marketing remark (116 chars)
NICE 2 STY NEWER WINDS UPPER 10TH WARD, LOW TAXES, MOVE IN COND. EAT-IN KIT, FORMAL DR 2 PORCHES. L/BOX ON BACK DOOR
-
1997-10-28$28,000 116-char remark
Show marketing remark (116 chars)
NICE 2 STY NEWER WINDS UPPER 10TH WARD, LOW TAXES, MOVE IN COND. EAT-IN KIT, FORMAL DR 2 PORCHES. L/BOX ON BACK DOOR
ⓘ Source: listings_history table (triggers on properties + properties_extension) + one-shot
backfill from property_details.listing_events for pre-trigger history.
Tax reassessment forecast PA · Partial reset (capped growth)
- Current annual tax
- $809 · $67/mo
- Projected year-2 tax
- $870 · $72/mo
- Expected delta
- +$61/yr (+$5/mo · 7.5%)
ⓘ Screening estimate from a state-policy table — verify with the county assessor before closing.
Climate risk First Street
- Flood 1/10 Low FEMA zone X (unshaded) · 0% chance over 30 yrs
- Wildfire 1/10 Low
- Heat 4/10 Moderate 7 d/yr ≥97°F today · 18 d/yr by 30 yrs out
- Wind 2/10 Low
- Air quality 5/10 Major 8 unhealthy d/yr today · 8 by 30 yrs out
Nearby sold comps map
Loading sold comps map…
Walkable amenities ~0.75 mi
Loading nearby amenities…
Taxation est. · year 1
- Rental income
- $13,718
- − Mortgage interest
- −$3,299
- − Property taxes
- −$809
- − Insurance
- −$294
- − Repairs & maintenance
- −$1,097
- − Management
- −$1,097
- − Depreciation
- −$1,713
- Taxable income
- $5,406
- Est. tax owed @ 24.0%
- −$1,297
- After-tax cash flow
- $4,729/yr
For passive investors: Depreciation is non-cash, so a rental often shows a tax loss while cash-flowing — sheltering income. Rental losses are passive: they offset passive income freely, and up to $25,000/yr can offset ordinary (W-2) income if you actively participate and your MAGI is under $100k (phasing out to $0 by $150k); unused losses carry forward. On sale, claimed depreciation is recaptured at up to 25%, and gains may owe capital-gains tax (a 1031 exchange can defer both). Figures are a year-1 estimate at your 24.0% rate — not tax advice; consult a CPA.
Schools (NCES district)
- District
- Mckeesport Area SD
- NCES district ID
- 4214940
- Math proficiency
- 11% ▼ -9.00%
- Reading proficiency
- 28% ▼ -10.00%
- Median HH income
- $33,779
- Composite
- 15.88/100
- National rank
- #9257
- State rank
- #499 of 539 in PA
Livability — McKeesport
- Score
- 66/100
- State rank
- #1089
- US rank
- #12321
Category grades
Schools grade is shown separately in the Schools card above.
Census & demographics
- Census place
- McKeesport, PA
- County
- Allegheny County · 1,022,028 people
- City population
- 25,010
- Metro
- Pittsburgh, PA
- Population (ZIP)
- 18,898
- Household income
- $35,397
- Rent vs Own
- Severe rent burden
- 1239.0
Population outlook (Allegheny County) Hauer SSP2
- Today (2025)
- 1,250,282 people
- By 2030
- 1,256,482 · +0.5%
- By 2040
- 1,256,318 · +0.5%
- By 2050
- 1,244,169 · -0.5%
- By 2075
- 1,197,693 · -4.2%
- By 2100
- 1,093,187 · -12.6%
Race, ethnicity, and origin ACS 2023
- Neighborhood character
- Diverse neighborhood (Simpson 0.62)
- Race & ethnicity
- White 50% Black 35% Two or more races 10% Hispanic / Latino 4% Asian 1%
- Common ancestry
- Romanian 5% Serbian 2% Scotch-Irish 2%
- Foreign-born
- 2% · Canada, China
- Languages at home
- 96% English-only · Spanish 3%
Political lean MEDSL · Allegheny
- 2024 margin
- Strong D (+20.3) · D 59.7% · R 39.4%
- 2008→2024 swing
- +4.8pp toward D · 2008: 15.5pp · 2024: 20.3pp
- All cycles
- 2024: D+20.3 2020: D+20.4 2016: D+16.4 2012: D+14.4 2008: D+15.5
Not yet ingested
- Civics
- —
Market trends
- HPI YoY
- ▼ -71.01%
- Current HPI
- 145.195
- Rent YoY
- —
- Metro
- Pittsburgh, PA
- State GDP YoY
- ▲ 1.68%
- F500 in state
- 34
Industry mix (Fortune 500 HQ in PA)
| Industry | F500 HQs | Revenue |
|---|---|---|
| Healthcare | 2 | $309B |
|
||
| Insurance | 2 | $27B |
|
||
| Telecommunications / Media | 1 | $124B |
|
||
| Industrial Distribution | 1 | $22B |
|
||
| Financial Services | 1 | $20B |
|
||
| Chemicals / Materials | 1 | $18B |
|
||
Price history
+110.4% since first listed4 events — show timeline
- 2025-12-10 Listed $58,900 West Penn MLS
- 1998-04-09 Sold (Public Records) $14,500 Public Records
- 1998-04-07 Sold (MLS) $14,500 West Penn MLS
- 1997-10-28 Listed $28,000 West Penn MLS
Property tax history
+24.8%/yrLatest (2026): $809 · +0.0% YoY. Source: county tax records.
Cash-flow waterfall
monthlySold comps — $/sqft
last 12 mo · ≤1 miLoading sold comps…