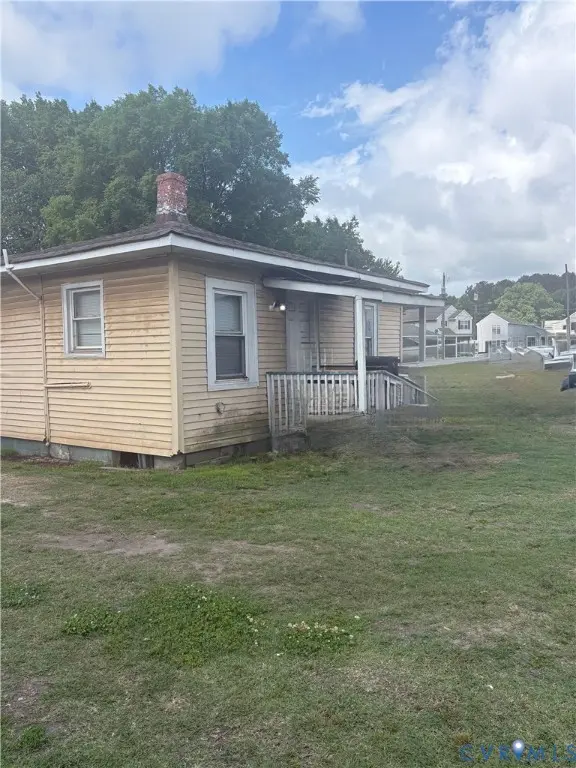
308 Pleasant St · Suffolk, VA
Flood risk 1/10 · Minimal
- FEMA flood zone
- X (unshaded)
- Chance of flooding over 30 yrs
- 0.0%
- Est. flood insurance / yr
- $507 – $1,088
Fire risk 3/10 · Minor
- Est. fire insurance / yr
- $666 – $1,236
Heat risk 9/10 · Severe
- Hot days now (above 109°F)
- 7 days/yr
- Hot days in 30 yrs
- 16 days/yr
Wind risk 8/10 · Major
- Chance of severe wind over 30 yrs
- 80.0%
Air-quality risk 2/10 · Minimal
- Unhealthy air days now
- 0 days/yr
- Unhealthy air days in 30 yrs
- 1 days/yr
Risk factors via First Street. Map © Google.
Why this score? — see what drove the C- grade
The composite is a weighted blend of 9 inputs, each scored 0–100. Each bar is that input's sub-score; the figure is the points it added to the 100-point composite (weight × sub-score).
- Cash flow +18.4/30.0
- ARV discount +9.7/15.0
- DSCR +5.8/10.0
- Schools +4.8/10.0
- Rent growth +4.0/5.0
- Livability +3.9/5.0
- 1% rule +3.6/10.0
- Condition / age +2.5/5.0
- Appreciation +0.0/10.0
$169,000
🖨 Deal sheet 📄 Offer letter ✓ Due diligence
Listing remarks
Unique investment opportunity featuring three parcels being sold together as one package in the heart of Suffolk, Virginia. This package includes a residential home, vacant land parcel, and commercial/store property, offering endless possibilities for residential, business, rental, or redevelopment use. Conveniently located near shopping, dining, medical facilities, and major highways while still providing room for expansion and vision. Residential structure conveys as-is. Commercial/store building included in sale along with additional land parcel. Buyer to verify zoning, permitted uses, acreage, utilities, and all property information. Sale includes multiple parcels: # 100716000, # 100717
Key facts
- 2,613 sq ft lot
- Built 1940
- Listed 12 days
Property features AI
Exterior
- Parking: Off-street parking
- Security: Smoke detector(s)
- Utilities: Public water; Public sewer
- Home design: Single-story home
- Construction: Wood siding, hardboard, and drywall construction; Composition roof; Built as existing/resale
- Exterior features: Deck
Interior
- Kitchen: Electric cooking; Stove; Exhaust fan
- Bedrooms: Bedrooms located on the first floor
- Flooring: Partially carpeted; Vinyl
- Bathrooms: One full bathroom with tub and shower
- Heating & cooling: Baseboard electric heating; Window unit(s) for cooling
- Interior features: Bedroom on main level; Partially carpeted and vinyl flooring
- Laundry & utility: Electric water heater
Neighborhood map
What this means for you Summary
Snapshot
- This is a 2-bed/1.0-bath single-family listed at $169k.
Deal economics
- At list price, monthly cash flow is $159 ($2k/yr) — positive.
- The deal already cash-flows at list — no discount required.
- To meet the 1% rule (rent ≥ 1% of price), the offer needs to be $146k (13.6% below list).
- Recommended offer: $146k (13.6% below list) — sets the bar for 1% rule.
- Cap rate 7.4% vs local median 3.5% in Suffolk — top-decile yield for the area; either an underpriced asset or a hidden risk that comps aren't pricing in. Stress-test before assuming the spread holds.
Location & tenants
- Location reads 77/100 on livability (#88 in VA, #2,896 nationally) — a middle-class / working-renter tenant base. Strengths: housing A+, health & safety A+, schools A; Watch: crime C-, commute F.
- Suffolk City Public School District (suburban): math 41% / reading 69% proficiency, ranked #72 of 131 in VA (top 55%) — acceptable for families but not a draw, mixed tenant base, ~2y average lease.
- Market conditions: Rents rising fast (+5.8%/yr); 536 active listings in the ZIP; 5 comparable units currently listed for rent nearby; rentals leasing fast (median 2d on market — plan ~1-2 weeks tenant-placement turnaround); solid renter incomes; 680 units permitted in Suffolk city in 2024 (0 in 5+ unit buildings).
Forward outlook
- Local home prices are declining (-3.0%/yr); year-one equity from $1k of loan paydown is wiped out by about $5k of value loss. Plan a longer hold.
- Suffolk County population projected at +11% by 2050 — modest demand growth; plan on rents tracking national, not racing it.
Negotiation context
- Only 13 days on market — expect competitive offers; lowballing is unlikely to land.
- 2 sale attempts since 7y ago; this cycle's ask is 333% above the opening price — seller raised mid-cycle; expect resistance to lowballs.
- Current owner paid $60k; list at $169k implies a 182% gain — meaningful room to come down on a strong offer.
Risks & watch-outs
- Watch-outs: built in 1940 — expect roof / HVAC / electrical / plumbing capex.
- Climate carrying-cost: severe wind risk, 80% chance of damaging wind over 30y; extreme-heat days projected 7→16/yr by 2055 (HVAC capex compounding) — expect insurance premiums to compound above CPI over the hold.
Questions for the listing agent
- Built in 1940 — when were the roof, HVAC, electrical panel, plumbing, and water heater last replaced?
- Is there a deadline driving the sale (1031 exchange, divorce, estate, relocation)? That informs how much negotiation room exists.
- Schools are A-rated — typically a magnet for longer-tenancy family renters. What's the average tenant stay here, and is there a school-zone premium baked into asking?
- What's the average days-on-market for RENTAL listings here right now (not sales)? A rising rental-DOM trend means longer vacancies and softer asking-rent achievability than the comps imply.
- What's the recent tenant-quality profile in this submarket — average credit score on applications, eviction rate, late-payment / NSF rate, and stable-employment percentage? A property-management company in the area should have these aggregated.
- How much new for-sale + rental construction is in the pipeline within 1–3 miles? Heavy new supply typically softens prices + rents 12–24 months out; constrained supply supports both.
Investment metrics
- 1% rule
- 0.86% ✗
- Cap rate
- 7.42%
- Cash-on-cash
- 4.03%
- DSCR
- 1.18
- GRM
- 9.6
CMA / ARV
- ARV (on-the-fly)
- $177,480
- Comps found
- 4
Show comp detail 4 sales within ~0.75 mi
| Address | Dist | Beds/Ba | Sqft | Sold | Price | $/sf | Match |
|---|---|---|---|---|---|---|---|
| 305 Pleasant St | 0.03mi | 2/1.5 | 720 (+3%) | 3mo | $210,000 | $292 | 88 |
| 220 Charlotte Ave | 0.10mi | 2/1.0 | 673 (-3%) | 3mo | $155,000 | $230 | 88 |
| 301 Webb St | 0.13mi | 2/1.0 | 715 (+3%) | 9mo | $180,000 | $252 | 82 |
| 527 Kissimmee Ave | 0.29mi | 2/1.0 | 745 (+7%) | 5mo | $189,900 | $255 | 70 |
Match score weights: distance 35% · size 25% · config 20% · recency 20%. Top-matched comps best support the ARV.
Projected returns pro-forma
-3.0% appreciation · 5.84% rent growth · sell at horizon
- IRR
- -7.3%
- Equity multiple
- 0.72×
- Total profit
- $-13,061
- Equity at exit
- $25,198
- IRR
- 5.2%
- Equity multiple
- 1.42×
- Total profit
- $19,985
- Equity at exit
- $14,612
Cash invested: $47,320 (down + closing). Projections, not guarantees.
Landlord ↔ Tenant lean methodology
- Overall (STATE)
- 55 Moderately Landlord-Leaning
- State Virginia
- 55 Moderately Landlord-Leaning · D+2
- County
- — inherits STATE
- City
- — inherits STATE
ZIP-level market 23434
- Rents YoY
- 5.8%
- Active inventory
- 536
- Price-to-rent
- 9.6×
Monthly cashflow live
- Estimated rent
- $1,461 high interval (Pro) →
- Mortgage (P&I)
- −$886
- Tax from tax record
- −$39 /mo · $464/yr
- Insurance
- −$70
- HOA
- −$0
- Vacancy / Maint / Mgmt
- −$307
- Net cashflow
- $159
Break-even live
UW: 25.0% down · 7.5% · 30yr · 1.5% tax · 5.0% vac · 8.0% maint · 8.0% mgmt
Financing live
Cash to close
- Down payment
- $42,250
- Closing costs
- $5,070
- Reserves months
- —
- Total cash needed
- —
Loan-product check · same deal, 3 products live
Conventional
25% down · 7.5% · 30yr
- Down + closing
- —
- Monthly P&I
- —
- Monthly cashflow
- —
- DSCR
- —
- Eligible?
- —
Personal DTI + credit; lowest rate.
DSCR
20% down · 8.5% · 30yr
- Down + closing
- —
- Monthly P&I
- —
- Monthly cashflow
- —
- DSCR
- —
- Eligible?
- —
No personal income docs; deal must DSCR.
Hard money
10% down · 12.0% · 12mo
- Down + closing
- —
- Monthly P&I
- —
- Monthly cashflow
- —
- DSCR
- —
- Eligible?
- —
Short-term bridge; refi at stabilization.
Rent comps 5 comps
| Address | Beds | Baths | Sqft | Rent | $/sqft | DOM | Units | Dist |
|---|---|---|---|---|---|---|---|---|
| 114 Nancy Dr Suffolk, VA | 2.0–3.0 | 1.0 | 860 | $1,195 | $1.39 | 1d | 4 | 0.50mi |
| 408 Wellons St Suffolk, VA | 1.0 | 1.0 | 750 | $1,486 | $1.98 | 1d | 3 | 0.86mi |
| 303 Bank St Unit C Suffolk, VA | 1.0 | 1.0 | 650 | $1,100 | $1.69 | 23d | 1 | 0.94mi |
| 181 N Main St Suffolk, VA | 2.0 | 1.0–2.0 | 804 | $1,885 | $2.34 | 1d | 15 | 1.03mi |
| 120 S 10th St Suffolk, VA | 2.0 | 1.0 | 736 | $1,250 | $1.70 | 43d | 1 | 1.41mi |
Listing history 12 events
-
2026-06-18days on market $169,000 Active 13 DOM
-
2026-06-17days on market $169,000 Active 12 DOM
-
2026-06-16days on market $169,000 Active 11 DOM
-
2026-06-15days on market $169,000 Active 10 DOM
-
2026-06-13days on market $169,000 Active 8 DOM
-
2026-06-09days on market $169,000 Active 4 DOM
-
2026-06-08days on market $169,000 Active 3 DOM
-
2026-06-07statusdays on market $169,000 Active 2 DOM
-
2026-06-03days on market $169,000 Coming Soon 3 DOM
-
2026-06-02days on market $169,000 Coming Soon 2 DOM
-
2026-06-01remarks 699-char remark
-
2026-06-01$169,000 Coming Soon 1 DOM
ⓘ Source: listings_history table (triggers on properties + properties_extension) + one-shot
backfill from property_details.listing_events for pre-trigger history.
Tax reassessment forecast VA · Resets to sale price
- Current annual tax
- $464 · $39/mo
- Projected year-2 tax
- $1,386 · $115/mo
- Expected delta
- +$921/yr (+$77/mo · 198.4%)
ⓘ Screening estimate from a state-policy table — verify with the county assessor before closing.
Climate risk First Street
- Flood 1/10 Low FEMA zone X (unshaded) · 0% chance over 30 yrs
- Wildfire 3/10 Moderate
- Heat 9/10 Extreme 7 d/yr ≥109°F today · 16 d/yr by 30 yrs out
- Wind 8/10 Severe 80% chance of damaging wind over 30 yrs
- Air quality 2/10 Low 0 unhealthy d/yr today · 1 by 30 yrs out
Nearby sold comps map
Loading sold comps map…
Walkable amenities ~0.75 mi
Loading nearby amenities…
Taxation est. · year 1
- Rental income
- $17,532
- − Mortgage interest
- −$9,467
- − Property taxes
- −$464
- − Insurance
- −$845
- − Repairs & maintenance
- −$1,403
- − Management
- −$1,403
- − Depreciation
- −$4,916
- Taxable loss
- −$966
- Est. tax savings @ 24.0%
- +$232
- After-tax cash flow
- $2,137/yr
For passive investors: Depreciation is non-cash, so a rental often shows a tax loss while cash-flowing — sheltering income. Rental losses are passive: they offset passive income freely, and up to $25,000/yr can offset ordinary (W-2) income if you actively participate and your MAGI is under $100k (phasing out to $0 by $150k); unused losses carry forward. On sale, claimed depreciation is recaptured at up to 25%, and gains may owe capital-gains tax (a 1031 exchange can defer both). Figures are a year-1 estimate at your 24.0% rate — not tax advice; consult a CPA.
Schools (NCES district)
- District
- Suffolk City Public School District
- NCES district ID
- 5103710
- Math proficiency
- 41% ▼ -43.00%
- Reading proficiency
- 69% ▼ -8.00%
- Median HH income
- $65,573
- Composite
- 48.31/100
- National rank
- #2151
- State rank
- #72 of 131 in VA
Livability — Suffolk
- Score
- 77/100
- State rank
- #88
- US rank
- #2896
Category grades
Schools grade is shown separately in the Schools card above.
Census & demographics
- Census place
- Suffolk, VA
- County
- Suffolk City · 88,108 people
- City population
- 88,108
- Metro
- Virginia Beach-Norfolk-Newport News, VA-NC
- Population (ZIP)
- 54,387
- Household income
- $79,877
- Rent vs Own
- Severe rent burden
- 1934.0
Population outlook (Suffolk County) Hauer SSP2
- Today (2025)
- 95,269 people
- By 2030
- 98,269 · +3.1%
- By 2040
- 103,177 · +8.3%
- By 2050
- 105,777 · +11.0%
- By 2075
- 110,963 · +16.5%
- By 2100
- 103,711 · +8.9%
Race, ethnicity, and origin ACS 2023
- Neighborhood character
- Diverse neighborhood (Simpson 0.58)
- Race & ethnicity
- Black 49% White 41% Two or more races 5% Hispanic / Latino 4% Asian 1%
- Common ancestry
- Lithuanian 1% Slovak 1% Italian 1%
- Foreign-born
- 3% · Canada
- Languages at home
- 96% English-only · Spanish 2%
Political lean MEDSL · Suffolk
- 2024 margin
- D (+15.9) · D 57.4% · R 41.5% · Other 1.2%
- 2008→2024 swing
- +2.7pp toward D · 2008: 13.2pp · 2024: 15.9pp
- All cycles
- 2024: D+15.9 2020: D+17.3 2016: D+13.8 2012: D+15.1 2008: D+13.2
Not yet ingested
- Civics
- —
Market trends
- HPI YoY
- ▼ -383.80%
- Current HPI
- 158.5866
- Rent YoY
- ▲ 5.84%
- Metro
- Virginia Beach-Norfolk-Newport News, VA-NC
- State GDP YoY
- ▲ 2.40%
- F500 in state
- 50
Industry mix (Fortune 500 HQ in VA)
| Industry | F500 HQs | Revenue |
|---|---|---|
| Aerospace / Defense | 4 | $236B |
|
||
| Technology / Defense | 3 | $32B |
|
||
| Financial Services | 2 | $176B |
|
||
| Utilities | 2 | $27B |
|
||
| Insurance | 2 | $25B |
|
||
| Technology | 2 | $15B |
|
||
Price history
+333.3% since first listed9 events — show timeline
- 2026-05-31 Coming Soon $169,000 CVRMLS
- 2020-06-30 Sold (Public Records) $60,000 Public Records
- 2020-06-19 Pending — REINMLS
- 2020-06-03 Listing Removed — REINMLS
- 2020-01-25 Contingent — REINMLS
- 2019-11-08 Relisted — REINMLS
- 2019-09-12 Pending — REINMLS
- 2019-07-14 Price Changed $33,000 REINMLS
- 2019-06-03 Listed $39,000 REINMLS
Property tax history
+4.7%/yrLatest (2025): $464 · +1.9% YoY. Source: county tax records.
Cash-flow waterfall
monthlySold comps — $/sqft
last 12 mo · ≤1 miLoading sold comps…