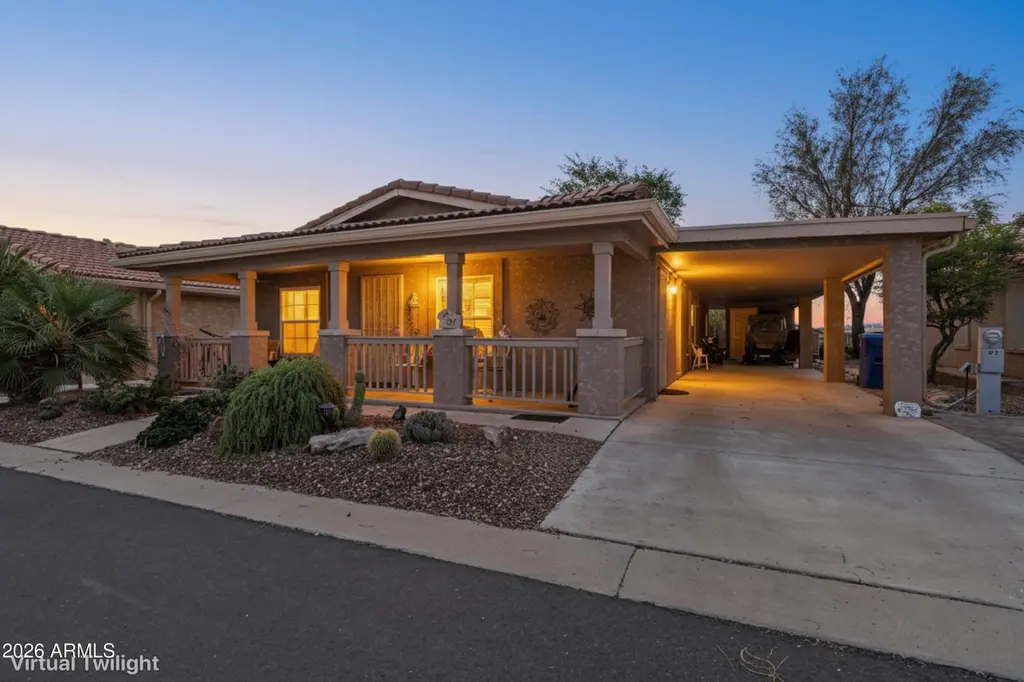
7373 E US Highway 60 -- #97 · Gold Canyon, AZ
Flood risk No data
- FEMA flood zone
- —
- Chance of flooding over 30 yrs
- —
- Est. flood insurance / yr
- —
Fire risk No data
- Est. fire insurance / yr
- —
Heat risk No data
- Hot days now (above threshold)
- —
- Hot days in 30 yrs
- —
Wind risk No data
- Chance of severe wind over 30 yrs
- —
Air-quality risk No data
- Unhealthy air days now
- —
- Unhealthy air days in 30 yrs
- —
Risk factors via First Street. Map © Google.
Why this score? — see what drove the C+ grade
The composite is a weighted blend of 9 inputs, each scored 0–100. Each bar is that input's sub-score; the figure is the points it added to the 100-point composite (weight × sub-score).
- Cash flow +30.0/30.0
- DSCR +10.0/10.0
- 1% rule +9.5/10.0
- Condition / age +3.8/5.0
- Livability +2.9/5.0
- Rent growth +2.5/5.0
- Schools +1.5/10.0
- ARV discount +1.3/15.0
- Appreciation +0.0/10.0
$229,000
🖨 Deal sheet 📄 Offer letter ✓ Due diligence
Listing remarks
A rare chance to own a 3-bedroom home in the highly sought-after Montesa community, where the lifestyle is just as impressive as the breathtaking Superstition Mountain views. Filled with natural light and lovingly maintained, this home offers a spacious layout that feels both open and inviting. Enjoy a large living room, a thoughtfully designed kitchen with island, pantry, and dining area, plus generously spaced bedrooms for added privacy. Step outside to the perfect patio for morning coffee or evening drinks, with the walking path just nearby. Montesa is packed with resort-style amenities including pickleball, bocce ball, tennis courts, social clubs, pool, spa, and a private hilltop vista
Key facts
- Large living room
- Walking path
- 3 parking spots
Tags
Property features AI
Finance
- Other: Directions: Turn into Montesa, go through gate, stay right and turn right onto the 3rd street, Vern Cruz. #97 is the 2nd home on the left.
- HOA & community: Land lease (monthly fee); Land lease amount: $1,070 per month; No association fees included; Community amenities: pool, heated community spa, pickleball courts, fitness center, community media room
Exterior
- Parking: 2 covered parking spaces; 1 open parking space; Direct access parking; 2 carport spaces
- Security: Gated community; Guarded entry with security guard
- Utilities: City water; Public sewer
- Home design: Manufactured/Mobile home; Leasehold ownership; Mountain views
- Construction: Stucco construction; Wood frame construction
- Exterior features: Stucco and wood frame exterior; Tile roof; RV hookup; Gravel/stone front and back; Desert front and back
Interior
- Kitchen: Refrigerator; Dishwasher; Disposal; Built-in electric oven; Kitchen island; Pantry; Eat-in kitchen
- Bedrooms: Up to 3 possible bedrooms
- Flooring: Laminate; Tile
- Bathrooms: 2 full bathrooms
- Heating & cooling: Electric heating; Ceiling heating; Central air; Ceiling fans; Programmable thermostat
- Interior features: High-speed internet; Double vanities; Eat-in kitchen; No interior steps; Vaulted ceilings; Kitchen island; Pantry; 3/4 bath in primary bedroom; Dual-pane windows; Solar tubes; Zero-grade entry; Storage
- Laundry & utility: Inside laundry
Neighborhood map
What this means for you Summary
Snapshot
- This is a 3-bed/2.0-bath manufactured listed at $229k. Condition is rated good.
Deal economics
- At list price, monthly cash flow is $1k ($12k/yr) — positive.
- The deal already cash-flows at list — no discount required.
- Meets the 1% rule at list price ($3k rent vs $229k).
- Recommended offer: $226k (1.5% below list) — sets the bar for market timing.
- Cap rate 11.7% vs local median 3.9% in Gold Canyon — top-decile yield for the area; either an underpriced asset or a hidden risk that comps aren't pricing in. Stress-test before assuming the spread holds.
Location & tenants
- Location reads 57/100 on livability (#225 in AZ) — a working-class tenant base; expect higher turnover. Strengths: crime A+, housing A+, employment A; Watch: schools D+, amenities F, commute F.
- Apache Junction Unified District (4443) (suburban): math 15% / reading 20% proficiency, ranked #195 of 249 in AZ (top 78%) — low school quality limits family demand, transient renter base, plan for 1-2y turnover.
- Market conditions: 425 active listings in the ZIP; 9 comparable units currently listed for rent nearby; rentals at typical pace (median 24d on market — plan ~3-4 weeks tenant-placement turnaround); solid renter incomes; 9,504 units permitted in Pinal County in 2024 (776 in 5+ unit buildings).
- At $3,318/mo this rent would consume 46% of the median local household income ($86k/yr) (locally 160% of renters already pay >50% of income on rent) — very limited rent-growth headroom before tenants either downsize or default.
Forward outlook
- Local home prices are declining (-3.0%/yr); year-one equity from $2k of loan paydown is wiped out by about $7k of value loss. Plan a longer hold.
- At projected returns (-3.0% appreciation + 3.0% rent growth), your $64k cash investment doubles in ~7 years — after that, you're playing with house money.
Negotiation context
- It's been on market 28 days — a 2% lower offer ($226k) is reasonable based on typical stale-listing flexibility.
Questions for the listing agent
- Is there a deadline driving the sale (1031 exchange, divorce, estate, relocation)? That informs how much negotiation room exists.
- Schools are D-rated, which usually means shorter tenancies and higher turnover. Who's the typical renter profile here, and what's been the actual vacancy rate?
- What's the average days-on-market for RENTAL listings here right now (not sales)? A rising rental-DOM trend means longer vacancies and softer asking-rent achievability than the comps imply.
- What's the recent tenant-quality profile in this submarket — average credit score on applications, eviction rate, late-payment / NSF rate, and stable-employment percentage? A property-management company in the area should have these aggregated.
- How much new for-sale + rental construction is in the pipeline within 1–3 miles? Heavy new supply typically softens prices + rents 12–24 months out; constrained supply supports both.
Investment metrics
- 1% rule
- 1.45% ✓
- Cap rate
- 11.73%
- Cash-on-cash
- 19.43%
- DSCR
- 1.86
- GRM
- 5.8
CMA / ARV
- ARV (on-the-fly)
- $201,376
- Comps found
- 3
Show comp detail 3 sales within ~0.75 mi
| Address | Dist | Beds/Ba | Sqft | Sold | Price | $/sf | Match |
|---|---|---|---|---|---|---|---|
| 7373 E US Hwy 60 -- #88 | 0.10mi | 3/2.0 | 1,728 (-0%) | 20mo | $220,000 | $127 | 78 |
| 7373 E US Hwy 60 -- #409 | 0.10mi | 2/2.0 (-1) | 1,540 (-11%) | 1mo | $166,500 | $108 | 71 |
| 7373 E US Highway 60 -- #169 | 0.10mi | 2/2.0 (-1) | 1,558 (-10%) | 9mo | $180,000 | $116 | 66 |
Match score weights: distance 35% · size 25% · config 20% · recency 20%. Top-matched comps best support the ARV.
Projected returns pro-forma
-3.0% appreciation · 3.0% rent growth · sell at horizon
- IRR
- 11.4%
- Equity multiple
- 1.45×
- Total profit
- $29,071
- Equity at exit
- $34,145
- IRR
- 20.4%
- Equity multiple
- 2.73×
- Total profit
- $110,669
- Equity at exit
- $19,800
Cash invested: $64,120 (down + closing). Projections, not guarantees.
Landlord ↔ Tenant lean methodology
- Overall (STATE)
- 87 Strongly Landlord-Friendly
- State Arizona
- 87 Strongly Landlord-Friendly · R+3
- County
- — inherits STATE
- City
- — inherits STATE
ZIP-level market 85118
- Home prices YoY
- -32.4%
- Active inventory
- 425
- Price-to-rent
- 5.8×
Monthly cashflow live
- Estimated rent
- $3,318 high interval (Pro) →
- Mortgage (P&I)
- −$1,201
- Tax est. 1.5%
- −$286 /mo · $3,435/yr
- Insurance
- −$95
- HOA
- −$0
- Vacancy / Maint / Mgmt
- −$697
- Net cashflow
- $1,038
Break-even live
UW: 25.0% down · 7.5% · 30yr · 1.5% tax · 5.0% vac · 8.0% maint · 8.0% mgmt
Financing live
Cash to close
- Down payment
- $57,250
- Closing costs
- $6,870
- Reserves months
- —
- Total cash needed
- —
Loan-product check · same deal, 3 products live
Conventional
25% down · 7.5% · 30yr
- Down + closing
- —
- Monthly P&I
- —
- Monthly cashflow
- —
- DSCR
- —
- Eligible?
- —
Personal DTI + credit; lowest rate.
DSCR
20% down · 8.5% · 30yr
- Down + closing
- —
- Monthly P&I
- —
- Monthly cashflow
- —
- DSCR
- —
- Eligible?
- —
No personal income docs; deal must DSCR.
Hard money
10% down · 12.0% · 12mo
- Down + closing
- —
- Monthly P&I
- —
- Monthly cashflow
- —
- DSCR
- —
- Eligible?
- —
Short-term bridge; refi at stabilization.
Rent comps 9 comps
| Address | Beds | Baths | Sqft | Rent | $/sqft | DOM | Units | Dist |
|---|---|---|---|---|---|---|---|---|
| 6497 S Ginty Dr Gold Canyon, AZ | 2.0 | 2.0 | 1673 | $4,300 | $2.57 | 24d | 1 | 0.29mi |
| 6382 S Fairway Dr Gold Canyon, AZ | 2.0 | 2.0 | 1570 | $3,900 | $2.48 | 24d | 1 | 0.51mi |
| 8320 E Masters Rd Gold Canyon, AZ | 2.0 | 2.0 | 1732 | $3,900 | $2.25 | 1d | 1 | 0.62mi |
| 6816 S Russet Sky Way Gold Canyon, AZ | 3.0 | 2.0 | 1366 | $1,800 | $1.32 | 24d | 1 | 0.84mi |
| 6494 S Foothills Dr Gold Canyon, AZ | 3.0 | 2.0 | 1450 | $2,300 | $1.59 | 16d | 1 | 1.13mi |
| 8401 E Golden Cholla Dr Gold Canyon, AZ | 3.0 | 2.0 | 2229 | $1,800 | $0.81 | 24d | 1 | 1.13mi |
| 8950 E Yucca Blossom Dr Gold Canyon, AZ | 3.0 | 2.0 | 1952 | $1,999 | $1.02 | 5d | 1 | 1.28mi |
| 6838 E Las Animas Trl Gold Canyon, AZ | 3.0 | 3.0 | 1638 | $3,500 | $2.14 | 5d | 1 | 1.35mi |
| 4670 S Jalapa Ln Gold Canyon, AZ | 3.0 | 2.0 | 1780 | $4,300 | $2.42 | 24d | 1 | 1.41mi |
Listing history 14 events
-
2026-06-18days on market $229,000 Active 28 DOM
-
2026-06-17days on market $229,000 Active 27 DOM
-
2026-06-16days on market $229,000 Active 26 DOM
-
2026-06-15days on market $229,000 Active 25 DOM
-
2026-06-13days on market $229,000 Active 23 DOM
-
2026-06-09days on market $229,000 Active 19 DOM
-
2026-06-08days on market $229,000 Active 18 DOM
-
2026-06-07days on market $229,000 Active 17 DOM
-
2026-06-04days on market $229,000 Active 14 DOM
-
2026-06-03days on market $229,000 Active 13 DOM
-
2026-06-02days on market $229,000 Active 12 DOM
-
2026-06-01days on market $229,000 Active 11 DOM
-
2026-05-31days on market $229,000 Active 10 DOM
-
2026-05-21$229,000 Active
ⓘ Source: listings_history table (triggers on properties + properties_extension) + one-shot
backfill from property_details.listing_events for pre-trigger history.
Nearby sold comps map
Loading sold comps map…
Walkable amenities ~0.75 mi
Loading nearby amenities…
Taxation est. · year 1
- Rental income
- $39,810
- − Mortgage interest
- −$12,828
- − Property taxes
- −$3,435
- − Insurance
- −$1,145
- − Repairs & maintenance
- −$3,185
- − Management
- −$3,185
- − Depreciation
- −$6,662
- Taxable income
- $9,371
- Est. tax owed @ 24.0%
- −$2,249
- After-tax cash flow
- $10,210/yr
For passive investors: Depreciation is non-cash, so a rental often shows a tax loss while cash-flowing — sheltering income. Rental losses are passive: they offset passive income freely, and up to $25,000/yr can offset ordinary (W-2) income if you actively participate and your MAGI is under $100k (phasing out to $0 by $150k); unused losses carry forward. On sale, claimed depreciation is recaptured at up to 25%, and gains may owe capital-gains tax (a 1031 exchange can defer both). Figures are a year-1 estimate at your 24.0% rate — not tax advice; consult a CPA.
Condition & rehab AI · 20 photos
This home is in good condition with cosmetic updates needed to modernize the kitchen and bathrooms. The property is move-in ready with a great location and resort-style amenities.
Repairs flagged
- Moderate kitchen cabinets — dated and in need of updating
- Moderate bathroom fixtures — dated and in need of updating
Value-add opportunities
- Both update kitchen cabinets and countertops — modernizing the kitchen will appeal to buyers and renters
- Both update bathroom fixtures — modernizing the bathrooms will appeal to buyers and renters
- Both paint interior walls — fresh paint will make the home more appealing and easier to sell
Renovation cost estimate screening
| Repair item | Severity | Est. cost |
|---|---|---|
| kitchen cabinets · dated and in need of updating | Moderate | $3,000–15,000 |
| bathroom fixtures · dated and in need of updating | Moderate | $3,000–15,000 |
| Total estimated repair cost · 2 items | $6,000–30,000 |
Value-add ROI direction
- Both update kitchen cabinets and countertops — modernizing the kitchen will appeal to buyers and renters ↑
- Both update bathroom fixtures — modernizing the bathrooms will appeal to buyers and renters ↑
- Both paint interior walls — fresh paint will make the home more appealing and easier to sell ↑
ⓘ Cost ranges are severity-bucket heuristics (US national rule-of-thumb). Get contractor quotes + a written scope before underwriting a rehab budget.
Schools (NCES district)
- District
- Apache Junction Unified District (4443)
- NCES district ID
- 0400790
- Math proficiency
- 15% ▼ -17.00%
- Reading proficiency
- 20% ▼ -13.00%
- Median HH income
- $44,930
- Composite
- 15.34/100
- National rank
- #9325
- State rank
- #195 of 249 in AZ
Livability — Gold Canyon
- Score
- 57/100
- State rank
- #225
- US rank
- #21732
Category grades
Schools grade is shown separately in the Schools card above.
Census & demographics
- Census place
- Gold Canyon, AZ
- County
- Pinal County · 399,947 people
- City population
- 14,932
- Metro
- Phoenix-Mesa-Chandler, AZ
- Population (ZIP)
- 14,932
- Household income
- $86,393
- Rent vs Own
- Severe rent burden
- 160.0
Population outlook (Pinal County) Hauer SSP2
- Today (2025)
- 437,574 people
- By 2030
- 446,903 · +2.1%
- By 2040
- 452,589 · +3.4%
- By 2050
- 444,126 · +1.5%
- By 2075
- 430,300 · -1.7%
- By 2100
- 393,536 · -10.1%
Race, ethnicity, and origin ACS 2023
- Neighborhood character
- Predominantly White (86%)
- Race & ethnicity
- White 86% Hispanic / Latino 8% Two or more races 6%
- Hispanic origin (detail)
- Mexican 7%
- Common ancestry
- Portuguese 7% Romanian 4% Slovak 4%
- Foreign-born
- 5% · Canada
- Languages at home
- 96% English-only · Spanish 3%
Political lean MEDSL · Pinal
- 2024 margin
- Strong R (+22.1) · D 38.5% · R 60.6%
- 2008→2024 swing
- -7.6pp toward R · 2008: -14.5pp · 2024: -22.1pp
- All cycles
- 2024: R+22.1 2020: R+17.3 2016: R+19.3 2012: R+17.1 2008: R+14.5
Not yet ingested
- Civics
- —
Market trends
- HPI YoY
- ▼ -122.27%
- Current HPI
- 255.6958
- Rent YoY
- —
- Metro
- Phoenix-Mesa-Chandler, AZ
- State GDP YoY
- ▲ 4.54%
- F500 in state
- 20
Industry mix (Fortune 500 HQ in AZ)
| Industry | F500 HQs | Revenue |
|---|---|---|
| Technology | 2 | $13B |
|
||
| Mining / Metals | 1 | $23B |
|
||
| Environmental Services | 1 | $16B |
|
||
| Metals / Steel | 1 | $14B |
|
||
| Technology Distribution | 1 | $9B |
|
||
| Homebuilding | 1 | $8B |
|
||
Price history
1 event — show timeline
- 2026-05-21 Listed $229,000 ARMLS
Cash-flow waterfall
monthlySold comps — $/sqft
last 12 mo · ≤1 miLoading sold comps…