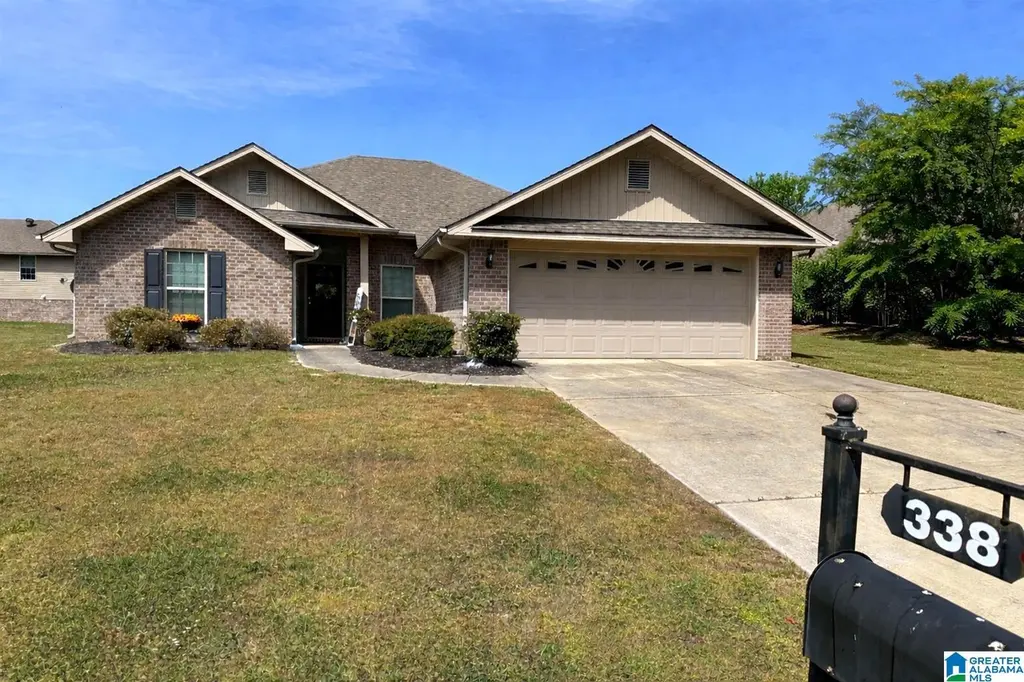
338 Ivy Hills Cir · Calera, AL
Flood risk 1/10 · Minimal
- FEMA flood zone
- X (unshaded)
- Chance of flooding over 30 yrs
- 0.0%
- Est. flood insurance / yr
- $507 – $1,088
Fire risk 5/10 · Moderate
- Est. fire insurance / yr
- $916 – $1,700
Heat risk 7/10 · Major
- Hot days now (above 106°F)
- 7 days/yr
- Hot days in 30 yrs
- 20 days/yr
Wind risk 6/10 · Moderate
- Chance of severe wind over 30 yrs
- 50.0%
Air-quality risk 2/10 · Minimal
- Unhealthy air days now
- 2 days/yr
- Unhealthy air days in 30 yrs
- 2 days/yr
Risk factors via First Street. Map © Google.
Why this score? — see what drove the D grade
The composite is a weighted blend of 9 inputs, each scored 0–100. Each bar is that input's sub-score; the figure is the points it added to the 100-point composite (weight × sub-score).
- Cash flow +12.7/30.0
- ARV discount +8.4/15.0
- Schools +3.9/10.0
- DSCR +3.8/10.0
- Rent growth +3.4/5.0
- 1% rule +3.3/10.0
- Livability +3.0/5.0
- Condition / age +2.5/5.0
- Appreciation +0.0/10.0
$259,900
🖨 Deal sheet (PDF) 📄 Offer letter ✓ Due diligence
Listing remarks MLS
Fantastic investment opportunity with an established tenant already in place! This charming 4-bedroom, 2-bath home in the Old Ivy subdivision features a welcoming living room with a cozy fireplace. The kitchen offers an eat-in dining area, select stainless steel appliances, and recessed lighting. Additional highlights include a 2-car garage.
Key facts
- 7,840 sq ft lot
- 2 garage spots
- Built 2018
Neighborhood map
What this means for you Summary
Snapshot
- This is a 4-bed/2.0-bath single-family listed at $260k.
Deal economics
- At list price, monthly cash flow is $-29 ($-345/yr) — negative.
- To cash-flow at today's rent, offer at most $255k (2.0% below list).
- To meet the 1% rule (rent ≥ 1% of price), the offer needs to be $215k (17.3% below list).
- Recommended offer: $215k (17.3% below list) — sets the bar for 1% rule.
- Cap rate 6.2% vs local median 4.5% in Calera — top-decile yield for the area; either an underpriced asset or a hidden risk that comps aren't pricing in. Stress-test before assuming the spread holds.
Location & tenants
- Location reads 59/100 on livability (#325 in AL) — a working-class tenant base; expect higher turnover. Strengths: cost of living A+, housing A+, employment A-; Watch: amenities F, commute F, health & safety F.
- Shelby County (suburban): math 30% / reading 58% proficiency, ranked #16 of 129 in AL (top 12%) — families likely to look elsewhere, expect single-tenant / working-renter base with shorter leases.
- Zoned schools: Calera Intermediate School (math 22% / reading 46%, grade F, #311 of 627 statewide, top 50%, 766 students, 68% FRL); Calera Middle (math 9% / reading 45%, grade F, #147 of 257 statewide, top 58%, 755 students, 61% FRL); Calera High (math 18% / reading 21%, grade F, #169 of 305 statewide, top 59%, 1,066 students, 59% FRL) — zoned schools average 63% FRL vs 26% district-wide (37 pts higher); higher-poverty schools than district average — tighter screening recommended.
- Zoned-school proficiency averages 27% at this address vs 44% district-wide (-17 pts) — the specific schools serving this property underperform the Shelby County average; the district grade overstates school quality for this exact location.
- Market conditions: Rents rising (+3.7%/yr); 373 active listings in the ZIP; 6 comparable units currently listed for rent nearby; rentals at typical pace (median 21d on market — plan ~3-4 weeks tenant-placement turnaround); solid renter incomes; 987 units permitted in Shelby County in 2024 (0 in 5+ unit buildings).
- This rent runs 30% of the median local income ($85k/yr) — at the standard rent-burdened threshold; future hikes will face affordability resistance.
Forward outlook
- Local home prices are declining (-3.0%/yr); year-one equity from $2k of loan paydown is wiped out by about $8k of value loss. Plan a longer hold.
- Shelby County population projected at +23% by 2050 — long-run rental-demand tailwind backs the buy-and-hold thesis.
Negotiation context
- It's been on market 40 days — a 3% lower offer ($252k) is reasonable based on typical stale-listing flexibility.
- 5 sale attempts since 10y ago with the ask held roughly flat each time — persistent listings suggest the price (not the market) is what's stuck; bring a comps-based counter.
- Current owner paid $226k; 15% above their basis — modest negotiation headroom, anchor on the comps not their cost.
Risks & watch-outs
- Climate carrying-cost: major wind risk, 50% chance of damaging wind over 30y; moderate wildfire risk; extreme-heat days projected 7→20/yr by 2055 (HVAC capex compounding) — expect insurance premiums to compound above CPI over the hold.
Questions for the listing agent
- What do current leases actually rent for vs. the listed asking? Can we see a recent rent roll and the last 12 months of T-12 income?
- It's been on market 40 days. Have you received any prior offers? Is the seller open to a 17% concession, seller financing, or rate buy-down credit?
- What does the HOA fee cover, when was the last increase, and are there any pending special assessments or reserve-fund shortfalls?
- Is there a deadline driving the sale (1031 exchange, divorce, estate, relocation)? That informs how much negotiation room exists.
- Schools are D-rated, which usually means shorter tenancies and higher turnover. Who's the typical renter profile here, and what's been the actual vacancy rate?
- The area grade is low — what's the realistic commute time and amenity access for the typical tenant pool here? Any planned neighborhood developments (good or bad) we should know about?
- What's the average days-on-market for RENTAL listings here right now (not sales)? A rising rental-DOM trend means longer vacancies and softer asking-rent achievability than the comps imply.
- What's the recent tenant-quality profile in this submarket — average credit score on applications, eviction rate, late-payment / NSF rate, and stable-employment percentage? A property-management company in the area should have these aggregated.
- How much new for-sale + rental construction is in the pipeline within 1–3 miles? Heavy new supply typically softens prices + rents 12–24 months out; constrained supply supports both.
Investment metrics
- 1% rule
- 0.83% ✗
- Cap rate
- 6.16%
- Cash-on-cash
- -0.47%
- DSCR
- 0.98
- GRM
- 10.1
CMA / ARV
- ARV (median comp)
- $265,063
- List price
- $259,900
- Delta
- -1.95%
- Verdict
- FAIR
- Comps
- 20 within 1.0 mi
Show comp detail 12 sales within ~0.75 mi
| Address | Dist | Beds/Ba | Sqft | Sold | Price | $/sf | Match |
|---|---|---|---|---|---|---|---|
| 338 Ivy Hills Cir | 0.00mi | 4/2.0 | 1,755 (0%) | 1mo | $260,000 | $148 | 99 |
| 408 Koslin Loop | 0.24mi | 4/2.0 | 1,774 (+1%) | 1mo | $309,900 | $175 | 86 |
| 716 Spruce Cir | 0.45mi | 4/2.0 | 1,774 (+1%) | 1mo | $324,900 | $183 | 77 |
| 122 E Willow Cir | 0.23mi | 3/2.0 (-1) | 1,698 (-3%) | 3mo | $380,000 | $224 | 77 |
| 255 Ivy Hills Cir | 0.21mi | 4/2.0 | 1,884 (+7%) | 2mo | $269,000 | $143 | 76 |
| 106 Rosewood Cir | 0.17mi | 4/3.0 | 1,846 (+5%) | 5mo | $280,000 | $152 | 75 |
| 109 Ivy Trce | 0.28mi | 4/2.0 | 1,884 (+7%) | 2mo | $239,000 | $127 | 72 |
| 605 Klynes Dr | 0.24mi | 4/2.0 | 1,613 (-8%) | 7mo | $268,700 | $167 | 70 |
| 566 Boxwood Bnd | 0.62mi | 4/2.0 | 1,774 (+1%) | 3mo | $319,900 | $180 | 67 |
| 320 Oakmont Cir | 0.24mi | 4/2.0 | 1,497 (-15%) | 0mo | $284,900 | $190 | 64 |
| 404 Koslin Loop | 0.24mi | 4/2.0 | 1,497 (-15%) | 1mo | $289,900 | $194 | 63 |
| 535 Boxwood Bnd | 0.66mi | 3/2.0 (-1) | 1,617 (-8%) | 6mo | $289,900 | $179 | 46 |
Match score weights: distance 35% · size 25% · config 20% · recency 20%. Top-matched comps best support the ARV.
Projected returns pro-forma
-3.0% appreciation · 3.67% rent growth · sell at horizon
- IRR
- -16.4%
- Equity multiple
- 0.42×
- Total profit
- $-42,497
- Equity at exit
- $38,752
- IRR
- -7.0%
- Equity multiple
- 0.54×
- Total profit
- $-33,340
- Equity at exit
- $22,471
Cash invested: $72,772 (down + closing). Projections, not guarantees.
Landlord ↔ Tenant lean methodology
- Overall (STATE)
- 90 Strongly Landlord-Friendly
- State Alabama
- 90 Strongly Landlord-Friendly · R+15
- County
- — inherits STATE
- City
- — inherits STATE
ZIP-level market 35040
- Home prices YoY
- -16.5%
- Rents YoY
- 3.7%
- Active inventory
- 373
- Price-to-rent
- 10.1×
Monthly cashflow live
- Estimated rent
- $2,148 high interval (Pro) →
- Mortgage (P&I)
- −$1,363
- Tax from tax record
- −$244 /mo · $2,922/yr
- Insurance
- −$108
- HOA
- −$11
- Vacancy / Maint / Mgmt
- −$451
- Net cashflow
- $-29
Break-even live
Sensitivity live
| Price | -10% $118 | -5% $45 | +0% $-29 | +5% $-102 | +10% $-176 |
|---|---|---|---|---|---|
| Rent | -10% $-198 | -5% $-114 | +0% $-29 | +5% $56 | +10% $141 |
| Rate | -1.0pp $102 | -0.5pp $37 | base $-29 | +0.5pp $-96 | +1.0pp $-165 |
UW: 25.0% down · 7.5% · 30yr · 1.5% tax · 5.0% vac · 8.0% maint · 8.0% mgmt
Financing live
Cash to close
- Down payment
- $64,975
- Closing costs
- $7,797
- Reserves months
- —
- Total cash needed
- —
Loan-product check · same deal, 3 products live
Conventional
25% down · 7.5% · 30yr
- Down + closing
- —
- Monthly P&I
- —
- Monthly cashflow
- —
- DSCR
- —
- Eligible?
- —
Personal DTI + credit; lowest rate.
DSCR
20% down · 8.5% · 30yr
- Down + closing
- —
- Monthly P&I
- —
- Monthly cashflow
- —
- DSCR
- —
- Eligible?
- —
No personal income docs; deal must DSCR.
Hard money
10% down · 12.0% · 12mo
- Down + closing
- —
- Monthly P&I
- —
- Monthly cashflow
- —
- DSCR
- —
- Eligible?
- —
Short-term bridge; refi at stabilization.
Rent comps 6 comps
| Address | Beds | Baths | Sqft | Rent | $/sqft | DOM | Units | Dist |
|---|---|---|---|---|---|---|---|---|
| 108 Hollow Ct Calera, AL | 4.0 | 2.5 | 2128 | $2,075 | $0.98 | 5d | 1 | 0.16mi |
| 201 Ivy Hills Cir Calera, AL | 4.0 | 2.0 | 2033 | $1,975 | $0.97 | 45d | 1 | 0.32mi |
| 1004 Medinah Dr Calera, AL | 3.0 | 2.0 | 1823 | $1,850 | $1.01 | 21d | 1 | 1.16mi |
| 309 Oakmont CIR Calera, AL | 5.0 | 3.0 | 2012 | $1,980 | $0.98 | 3d | 1 | 1.22mi |
| 313 Oakmont CIR Calera, AL | 4.0 | 2.0 | 1774 | $1,995 | $1.12 | 45d | 1 | 1.23mi |
| 324 Oakmont CIR Calera, AL | 3.0 | 2.0 | 1272 | $1,795 | $1.41 | 3d | 1 | 1.23mi |
HOA detail
- Monthly dues
- $11 · $132/yr
Listing history 18 events
-
2026-05-31days on market $259,900 Active 40 DOM
-
2026-04-21$259,900 Active 343-char remark
Show marketing remark (343 chars)
Fantastic investment opportunity with an established tenant already in place! This charming 4-bedroom, 2-bath home in the Old Ivy subdivision features a welcoming living room with a cozy fireplace. The kitchen offers an eat-in dining area, select stainless steel appliances, and recessed lighting. Additional highlights include a 2-car garage.
-
2026-04-15historical $259,900 343-char remark
Show marketing remark (343 chars)
Fantastic investment opportunity with an established tenant already in place! This charming 4-bedroom, 2-bath home in the Old Ivy subdivision features a welcoming living room with a cozy fireplace. The kitchen offers an eat-in dining area, select stainless steel appliances, and recessed lighting. Additional highlights include a 2-car garage.
-
2025-07-22historical $1,600
-
2025-06-30price $1,600
-
2025-06-13price $1,745
-
2025-05-24$1,780
-
2021-06-22soldstatus $226,000
-
2021-06-18soldstatus $226,000 Sold 443-char remark
Show marketing remark (443 chars)
WELCOME to Old Ivy - a charming subdivision in the heart of Calera! This home a little over 2 years old and is MOVE-IN-READY! With spacious bedrooms, open floor plan and a great kitchen for entertaining, this home has all the character you want! Spacious master bathroom and large walk-in closet. With three additional bedrooms and a full bath at a price you can afford, this one won’t last long! Wonderful location only miles from I-65!
-
2021-05-17historical Contingent 443-char remark
Show marketing remark (443 chars)
WELCOME to Old Ivy - a charming subdivision in the heart of Calera! This home a little over 2 years old and is MOVE-IN-READY! With spacious bedrooms, open floor plan and a great kitchen for entertaining, this home has all the character you want! Spacious master bathroom and large walk-in closet. With three additional bedrooms and a full bath at a price you can afford, this one won’t last long! Wonderful location only miles from I-65!
-
2021-05-14$205,000 Active 443-char remark
Show marketing remark (443 chars)
WELCOME to Old Ivy - a charming subdivision in the heart of Calera! This home a little over 2 years old and is MOVE-IN-READY! With spacious bedrooms, open floor plan and a great kitchen for entertaining, this home has all the character you want! Spacious master bathroom and large walk-in closet. With three additional bedrooms and a full bath at a price you can afford, this one won’t last long! Wonderful location only miles from I-65!
-
2021-05-12historical $205,000 443-char remark
Show marketing remark (443 chars)
WELCOME to Old Ivy - a charming subdivision in the heart of Calera! This home a little over 2 years old and is MOVE-IN-READY! With spacious bedrooms, open floor plan and a great kitchen for entertaining, this home has all the character you want! Spacious master bathroom and large walk-in closet. With three additional bedrooms and a full bath at a price you can afford, this one won’t last long! Wonderful location only miles from I-65!
-
2018-06-13soldstatus $347,646
-
2018-06-06soldstatus $172,900 Sold
-
2018-04-25historical Contingent
-
2018-04-11$172,900 Active
-
2017-04-25soldstatus $157,900 Sold
-
2016-10-22$160,900 Active
ⓘ Source: listings_history table (triggers on properties + properties_extension) + one-shot
backfill from property_details.listing_events for pre-trigger history.
Tax reassessment forecast AL · Resets to sale price
- Current annual tax
- $2,922 · $244/mo
- Projected year-2 tax
- $2,922 · $244/mo
- Expected delta
- $0/yr ($0/mo · 0.0%)
ⓘ Screening estimate from a state-policy table — verify with the county assessor before closing.
Climate risk First Street
- Flood 1/10 Low FEMA zone X (unshaded) · 0% chance over 30 yrs
- Wildfire 5/10 Major
- Heat 7/10 Severe 7 d/yr ≥106°F today · 20 d/yr by 30 yrs out
- Wind 6/10 Major 50% chance of damaging wind over 30 yrs
- Air quality 2/10 Low 2 unhealthy d/yr today · 2 by 30 yrs out
Nearby sold comps map
Loading sold comps map…
Walkable amenities ~0.75 mi
Loading nearby amenities…
Taxation est. · year 1
- Rental income
- $25,778
- − Mortgage interest
- −$14,558
- − Property taxes
- −$2,922
- − Insurance
- −$1,300
- − Repairs & maintenance
- −$2,062
- − Management
- −$2,062
- − HOA
- −$132
- − Depreciation
- −$7,561
- Taxable loss
- −$4,819
- Est. tax savings @ 24.0%
- +$1,157
- After-tax cash flow
- $812/yr
For passive investors: Depreciation is non-cash, so a rental often shows a tax loss while cash-flowing — sheltering income. Rental losses are passive: they offset passive income freely, and up to $25,000/yr can offset ordinary (W-2) income if you actively participate and your MAGI is under $100k (phasing out to $0 by $150k); unused losses carry forward. On sale, claimed depreciation is recaptured at up to 25%, and gains may owe capital-gains tax (a 1031 exchange can defer both). Figures are a year-1 estimate at your 24.0% rate — not tax advice; consult a CPA.
Schools (NCES district)
- District
- Shelby County
- NCES district ID
- 0103030
- Math proficiency
- 30% ▼ -28.00%
- Reading proficiency
- 58% ▲ 2.00%
- Median HH income
- $66,672
- Composite
- 39.29/100
- National rank
- #3995
- State rank
- #16 of 129 in AL
Livability — Calera
- Score
- 59/100
- State rank
- #325
- US rank
- #19917
Category grades
Schools grade is shown separately in the Schools card above.
Census & demographics
- Census place
- Calera, AL
- County
- Shelby County · 188,970 people
- City population
- 19,304
- Metro
- Birmingham-Hoover, AL
- Population (ZIP)
- 19,304
- Household income
- $84,554
- Rent vs Own
- Severe rent burden
- 388.0
Population outlook (Shelby County) Hauer SSP2
- Today (2025)
- 237,024 people
- By 2030
- 249,868 · +5.4%
- By 2040
- 272,778 · +15.1%
- By 2050
- 291,062 · +22.8%
- By 2075
- 326,049 · +37.6%
- By 2100
- 335,870 · +41.7%
Race, ethnicity, and origin ACS 2023
- Neighborhood character
- Diverse neighborhood (Simpson 0.56)
- Race & ethnicity
- White 59% Black 30% Hispanic / Latino 9% Two or more races 3%
- Hispanic origin (detail)
- Mexican 7%
- Common ancestry
- Slovak 3% Italian 1% Serbian 1%
- Foreign-born
- 6% · Canada, China
- Languages at home
- 91% English-only · Spanish 6% Arabic 1% Chinese 1%
Political lean MEDSL · Shelby
- 2024 margin
- Solid R (+40.9) · D 29.0% · R 69.9% · Other 1.1%
- 2008→2024 swing
- +12.6pp toward D · 2008: -53.4pp · 2024: -40.9pp
- All cycles
- 2024: R+40.9 2020: R+40.4 2016: R+50.3 2012: R+55.6 2008: R+53.4
Not yet ingested
- Civics
- —
Market trends
- HPI YoY
- ▼ -43.58%
- Current HPI
- 220.2843
- Rent YoY
- ▲ 3.67%
- Metro
- Birmingham-Hoover, AL
- State GDP YoY
- ▲ 2.94%
- F500 in state
- 4
Industry mix (Fortune 500 HQ in AL)
| Industry | F500 HQs | Revenue |
|---|---|---|
| Financial Services | 1 | $8B |
|
||
| Healthcare | 1 | $5B |
|
||
Price history
+61.5% since first listed17 events — show timeline
- 2026-04-21 Listed $259,900 Greater Alabama MLS
- 2026-04-15 Coming Soon $259,900 Greater Alabama MLS
- 2025-07-22 Rental Removed $1,600 RENTLY
- 2025-06-30 Price Changed $1,600 RENTLY
- 2025-06-13 Price Changed $1,745 RENTLY
- 2025-05-24 Listed for Rent $1,780 RENTLY
- 2021-06-22 Sold (Public Records) $226,000 Public Records
- 2021-06-18 Sold (MLS) $226,000 Greater Alabama MLS
- 2021-05-17 Contingent — Greater Alabama MLS
- 2021-05-14 Listed $205,000 Greater Alabama MLS
- 2021-05-12 Coming Soon $205,000 Greater Alabama MLS
- 2018-06-13 Sold (Public Records) $347,646 Public Records
- 2018-06-06 Sold (MLS) $172,900 Greater Alabama MLS
- 2018-04-25 Contingent — Greater Alabama MLS
- 2018-04-11 Listed $172,900 Greater Alabama MLS
- 2017-04-25 Sold (MLS) $157,900 Greater Alabama MLS
- 2016-10-22 Listed $160,900 Greater Alabama MLS
Property tax history
+19.9%/yrLatest (2025): $2,922 · +1.2% YoY. Source: county tax records.
Cash-flow waterfall
monthlySold comps — $/sqft
last 12 mo · ≤1 miLoading sold comps…