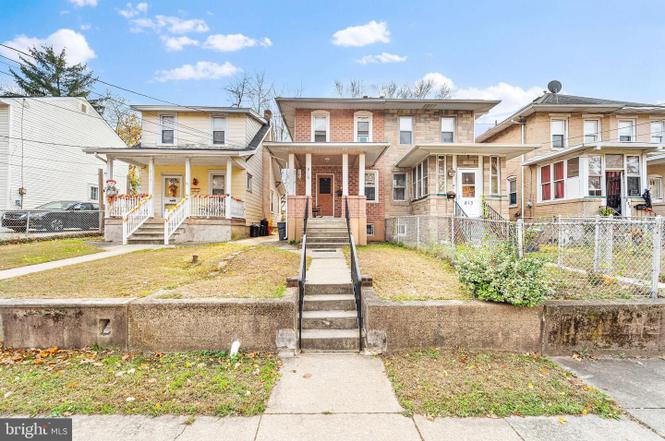
815 Delair Ave · Philadelphia, PA
Flood risk 1/10 · Minimal
- FEMA flood zone
- X (unshaded)
- Chance of flooding over 30 yrs
- 0.0%
- Est. flood insurance / yr
- $507 – $1,088
Fire risk 1/10 · Minimal
- Est. fire insurance / yr
- $526 – $976
Heat risk 6/10 · Moderate
- Hot days now (above 104°F)
- 7 days/yr
- Hot days in 30 yrs
- 15 days/yr
Wind risk 6/10 · Moderate
- Chance of severe wind over 30 yrs
- 27.0%
Air-quality risk 4/10 · Minor
- Unhealthy air days now
- 5 days/yr
- Unhealthy air days in 30 yrs
- 6 days/yr
Risk factors via First Street. Map © Google.
Why this score? — see what drove the C+ grade
The composite is a weighted blend of 9 inputs, each scored 0–100. Each bar is that input's sub-score; the figure is the points it added to the 100-point composite (weight × sub-score).
- Cash flow +23.1/30.0
- ARV discount +15.0/15.0
- DSCR +7.4/10.0
- 1% rule +6.4/10.0
- Livability +3.9/5.0
- Rent growth +2.5/5.0
- Condition / age +2.5/5.0
- Schools +2.0/10.0
- Appreciation +0.0/10.0
$225,000
🖨 Deal sheet 📄 Offer letter ✓ Due diligence
Listing remarks
Spacious 3BD/1BTH located in the Delair section of Pennsauken. Charming brick facade with welcoming front porch. Walk-up attic accessible through third bedroom. Fully-fenced backyard. Property is currently tenant occupied but will be delivered vacant. Tenant requires at least 24 hours notice for showings.
Key facts
- Delair section
- Front porch
- Brick facade
Tags
Neighborhood map
What this means for you Summary
Snapshot
- This is a 3-bed/1.0-bath single-family listed at $225k.
Deal economics
- At list price, monthly cash flow is $403 ($5k/yr) — positive.
- The deal already cash-flows at list — no discount required.
- Meets the 1% rule at list price ($3k rent vs $225k).
- Recommended offer: $198k (12.0% below list) — sets the bar for market timing.
- Cap rate 8.4% vs local median 3.5% in Philadelphia — top-decile yield for the area; either an underpriced asset or a hidden risk that comps aren't pricing in. Stress-test before assuming the spread holds.
Location & tenants
- Location reads 77/100 on livability (#348 in PA, #3,054 nationally) — a middle-class / working-renter tenant base. Strengths: amenities A+, commute A+, cost of living A+; Watch: employment C-, schools D+, crime F.
- Pennsauken Township Board Of Education School District (suburban): math 12% / reading 32% proficiency, ranked #410 of 472 in NJ (top 87%) — low school quality limits family demand, transient renter base, plan for 1-2y turnover.
- Market conditions: 6 comparable units currently listed for rent nearby; rentals at typical pace (median 25d on market — plan ~3-4 weeks tenant-placement turnaround); solid renter incomes; 1,018 units permitted in Camden County in 2024 (509 in 5+ unit buildings).
- This rent runs 37% of the median local income ($84k/yr) — at the standard rent-burdened threshold; future hikes will face affordability resistance.
Forward outlook
- Local home prices are declining (-3.0%/yr); year-one equity from $2k of loan paydown is wiped out by about $7k of value loss. Plan a longer hold.
- Camden County population projected to shrink 8% by 2050 — rents likely to lag national; underwrite the cash flow, not the appreciation.
Negotiation context
- It's been on market 147 days — a 12% lower offer ($198k) is reasonable based on typical stale-listing flexibility.
- 9 sale attempts since 25y ago with the ask held roughly flat each time — persistent listings suggest the price (not the market) is what's stuck; bring a comps-based counter.
- Current owner paid $78k; list at $225k implies a 190% gain — meaningful room to come down on a strong offer.
Risks & watch-outs
- Watch-outs: built in 1928 — expect roof / HVAC / electrical / plumbing capex.
- Climate carrying-cost: major wind risk, 27% chance of damaging wind over 30y; extreme-heat days projected 7→15/yr by 2055 (HVAC capex compounding) — expect insurance premiums to compound above CPI over the hold.
Questions for the listing agent
- It's been on market 147 days. Have you received any prior offers? Is the seller open to a 12% concession, seller financing, or rate buy-down credit?
- Built in 1928 — when were the roof, HVAC, electrical panel, plumbing, and water heater last replaced?
- Why hasn't it sold? Are there any deal-killer items the seller is aware of (foundation, flood, title, zoning, code violations)?
- Is there a deadline driving the sale (1031 exchange, divorce, estate, relocation)? That informs how much negotiation room exists.
- Schools are D-rated, which usually means shorter tenancies and higher turnover. Who's the typical renter profile here, and what's been the actual vacancy rate?
- Crime grade is F in this area — have there been break-ins, vandalism, or insurance claims at this property in the last 3 years? What carrier currently insures it and at what premium?
- What's the average days-on-market for RENTAL listings here right now (not sales)? A rising rental-DOM trend means longer vacancies and softer asking-rent achievability than the comps imply.
- What's the recent tenant-quality profile in this submarket — average credit score on applications, eviction rate, late-payment / NSF rate, and stable-employment percentage? A property-management company in the area should have these aggregated.
- How much new for-sale + rental construction is in the pipeline within 1–3 miles? Heavy new supply typically softens prices + rents 12–24 months out; constrained supply supports both.
Investment metrics
- 1% rule
- 1.14% ✓
- Cap rate
- 8.44%
- Cash-on-cash
- 7.68%
- DSCR
- 1.34
- GRM
- 7.3
CMA / ARV
- ARV (on-the-fly)
- $276,612
- Comps found
- 12
Show comp detail 12 sales within ~0.75 mi
| Address | Dist | Beds/Ba | Sqft | Sold | Price | $/sf | Match |
|---|---|---|---|---|---|---|---|
| 7929 Stow Rd | 0.22mi | 3/1.0 | 1,056 (+2%) | 12mo | $265,000 | $251 | 76 |
| 925 Union Ave | 0.35mi | 3/1.0 | 1,008 (-3%) | 4mo | $300,100 | $298 | 76 |
| 234 Velde Ave | 0.37mi | 3/1.0 | 1,040 (+0%) | 9mo | $235,000 | $226 | 75 |
| 525 Derousse Ave | 0.25mi | 4/1.0 (+1) | 1,074 (+4%) | 12mo | $160,000 | $149 | 67 |
| 7549 Boulevard Ave | 0.31mi | 3/2.0 | 1,002 (-3%) | 19mo | $395,000 | $394 | 60 |
| 7630 River Rd | 0.08mi | 3/2.0 | 1,152 (+11%) | 18mo | $285,000 | $247 | 58 |
| 8427 Balfour Rd | 0.54mi | 3/1.0 | 1,008 (-3%) | 17mo | $271,000 | $269 | 56 |
| 7527 Tripoli Ave | 0.45mi | 3/1.0 | 916 (-12%) | 5mo | $249,900 | $273 | 56 |
| 7325 Remington Ave | 0.38mi | 3/2.0 | 1,132 (+9%) | 15mo | $302,000 | $267 | 51 |
| 8444 Holman Ave | 0.55mi | 3/1.0 | 898 (-13%) | 7mo | $249,900 | $278 | 46 |
| 7319 Bannard Ave | 0.32mi | 3/1.5 | 1,187 (+15%) | 17mo | $299,000 | $252 | 45 |
| 8337 Bannard Ave | 0.47mi | 3/2.0 | 1,144 (+10%) | 16mo | $300,000 | $262 | 44 |
Match score weights: distance 35% · size 25% · config 20% · recency 20%. Top-matched comps best support the ARV.
Projected returns pro-forma
-3.0% appreciation · 3.0% rent growth · sell at horizon
- IRR
- -4.5%
- Equity multiple
- 0.83×
- Total profit
- $-10,708
- Equity at exit
- $33,548
- IRR
- 5.2%
- Equity multiple
- 1.38×
- Total profit
- $24,044
- Equity at exit
- $19,454
Cash invested: $63,000 (down + closing). Projections, not guarantees.
Landlord ↔ Tenant lean methodology
- Overall (STATE)
- 62 Landlord-Friendly
- State Pennsylvania
- 62 Landlord-Friendly · EVEN
- County
- — inherits STATE
- City
- — inherits STATE
ZIP-level market 08110
- Home prices YoY
- -10.9%
- Price-to-rent
- 7.3×
Monthly cashflow live
- Estimated rent
- $2,554 high interval (Pro) →
- Mortgage (P&I)
- −$1,180
- Tax from tax record
- −$341 /mo · $4,092/yr
- Insurance
- −$94
- HOA
- −$0
- Vacancy / Maint / Mgmt
- −$536
- Net cashflow
- $403
Break-even live
UW: 25.0% down · 7.5% · 30yr · 1.5% tax · 5.0% vac · 8.0% maint · 8.0% mgmt
Financing live
Cash to close
- Down payment
- $56,250
- Closing costs
- $6,750
- Reserves months
- —
- Total cash needed
- —
Loan-product check · same deal, 3 products live
Conventional
25% down · 7.5% · 30yr
- Down + closing
- —
- Monthly P&I
- —
- Monthly cashflow
- —
- DSCR
- —
- Eligible?
- —
Personal DTI + credit; lowest rate.
DSCR
20% down · 8.5% · 30yr
- Down + closing
- —
- Monthly P&I
- —
- Monthly cashflow
- —
- DSCR
- —
- Eligible?
- —
No personal income docs; deal must DSCR.
Hard money
10% down · 12.0% · 12mo
- Down + closing
- —
- Monthly P&I
- —
- Monthly cashflow
- —
- DSCR
- —
- Eligible?
- —
Short-term bridge; refi at stabilization.
Rent comps 6 comps
| Address | Beds | Baths | Sqft | Rent | $/sqft | DOM | Units | Dist |
|---|---|---|---|---|---|---|---|---|
| 8117 Stow Rd Pennsauken, NJ | 3.0 | 1.0 | 1056 | $2,450 | $2.32 | 5d | 1 | 0.27mi |
| 7406 Jackson Ave Pennsauken, NJ | 3.0 | 2.0 | 1344 | $2,900 | $2.16 | 17d | 1 | 0.91mi |
| 1535 Gross Ave Pennsauken, NJ | 3.0 | 1.0 | 1272 | $2,150 | $1.69 | 24d | 1 | 1.10mi |
| 2277 Hollinshed Ave Pennsauken, NJ | 3.0 | 1.5 | 1164 | $2,400 | $2.06 | 24d | 1 | 1.32mi |
| 5729 Irving Ave Pennsauken, NJ | 3.0 | 1.5 | 1200 | $2,150 | $1.79 | 16d | 1 | 1.44mi |
| 6366 Rogers Ave Unit 3 Pennsauken Township, NJ | 3.0 | 1.0 | 1100 | $2,100 | $1.91 | 24d | 1 | 1.49mi |
Listing history 20 events
-
2026-04-07status Pending
-
2025-12-23price $225,000
-
2025-11-11$227,500 Active
-
2016-11-01historical
-
2014-04-01$60,000
-
2012-08-28historical
-
2012-07-01$108,000
-
2012-06-06historical
-
2011-06-13$105,000
-
2011-06-10historical
-
2011-02-15$115,000
-
2010-12-31historical
-
2010-02-10$115,000
-
2010-02-07historical
-
2009-08-07$130,000
-
2003-10-21soldstatus $77,500
-
2003-08-28soldstatus $77,500
-
2003-06-18$77,500
-
2002-06-15historical
-
2001-11-12$74,900
ⓘ Source: listings_history table (triggers on properties + properties_extension) + one-shot
backfill from property_details.listing_events for pre-trigger history.
Tax reassessment forecast PA · Partial reset (capped growth)
- Current annual tax
- $4,092 · $341/mo
- Projected year-2 tax
- $4,092 · $341/mo
- Expected delta
- $0/yr ($0/mo · 0.0%)
ⓘ Screening estimate from a state-policy table — verify with the county assessor before closing.
Climate risk First Street
- Flood 1/10 Low FEMA zone X (unshaded) · 0% chance over 30 yrs
- Wildfire 1/10 Low
- Heat 6/10 Major 7 d/yr ≥104°F today · 15 d/yr by 30 yrs out
- Wind 6/10 Major 27% chance of damaging wind over 30 yrs
- Air quality 4/10 Moderate 5 unhealthy d/yr today · 6 by 30 yrs out
Nearby sold comps map
Loading sold comps map…
Walkable amenities ~0.75 mi
Loading nearby amenities…
Taxation est. · year 1
- Rental income
- $30,650
- − Mortgage interest
- −$12,603
- − Property taxes
- −$4,092
- − Insurance
- −$1,125
- − Repairs & maintenance
- −$2,452
- − Management
- −$2,452
- − Depreciation
- −$6,545
- Taxable income
- $1,380
- Est. tax owed @ 24.0%
- −$331
- After-tax cash flow
- $4,506/yr
For passive investors: Depreciation is non-cash, so a rental often shows a tax loss while cash-flowing — sheltering income. Rental losses are passive: they offset passive income freely, and up to $25,000/yr can offset ordinary (W-2) income if you actively participate and your MAGI is under $100k (phasing out to $0 by $150k); unused losses carry forward. On sale, claimed depreciation is recaptured at up to 25%, and gains may owe capital-gains tax (a 1031 exchange can defer both). Figures are a year-1 estimate at your 24.0% rate — not tax advice; consult a CPA.
Schools (NCES district)
- District
- Pennsauken Township Board Of Education School District
- NCES district ID
- 3412870
- Math proficiency
- 12% ▼ -16.00%
- Reading proficiency
- 32% ▼ -3.00%
- Median HH income
- $60,336
- Composite
- 20.48/100
- National rank
- #8573
- State rank
- #410 of 472 in NJ
Livability — Philadelphia
- Score
- 77/100
- State rank
- #348
- US rank
- #3054
Category grades
Schools grade is shown separately in the Schools card above.
Census & demographics
- County
- Camden County
- City population
- 1,559,001
- Metro
- Philadelphia-Camden-Wilmington, PA-NJ-DE-MD
- Population (ZIP)
- 19,158
- Household income
- $83,729
- Rent vs Own
- Severe rent burden
- 404.0
Population outlook (Camden County) Hauer SSP2
- Today (2025)
- 507,964 people
- By 2030
- 502,182 · -1.1%
- By 2040
- 485,602 · -4.4%
- By 2050
- 465,630 · -8.3%
- By 2075
- 419,986 · -17.3%
- By 2100
- 369,492 · -27.3%
Race, ethnicity, and origin ACS 2023
- Neighborhood character
- Diverse neighborhood (Simpson 0.67)
- Race & ethnicity
- Hispanic / Latino 46% Black 30% White 14% Two or more races 13% Asian 7% Native American 2%
- Hispanic origin (detail)
- Mexican 5% Puerto Rican 17% Dominican 16%
- Common ancestry
- Romanian 2% Hispanic 1% Iranian 1%
- Foreign-born
- 28% · Canada, Vietnam, Jamaica
- Languages at home
- 52% English-only · Spanish 35% Vietnamese 4% French/Haitian/Cajun 1%
Political lean MEDSL · Camden
- 2024 margin
- Strong D (+27.4) · D 63.0% · R 35.5% · Other 1.5%
- 2008→2024 swing
- -8.8pp toward R · 2008: 36.2pp · 2024: 27.4pp
- All cycles
- 2024: D+27.4 2020: D+33.5 2016: D+32.4 2012: D+36.6 2008: D+36.2
Not yet ingested
- Civics
- —
Market trends
- HPI YoY
- ▼ -53.44%
- Current HPI
- 436.2879
- Rent YoY
- —
- Metro
- Philadelphia-Camden-Wilmington, PA-NJ-DE-MD
- State GDP YoY
- ▲ 1.68%
- F500 in state
- 34
Industry mix (Fortune 500 HQ in PA)
| Industry | F500 HQs | Revenue |
|---|---|---|
| Healthcare | 2 | $309B |
|
||
| Insurance | 2 | $27B |
|
||
| Telecommunications / Media | 1 | $124B |
|
||
| Industrial Distribution | 1 | $22B |
|
||
| Financial Services | 1 | $20B |
|
||
| Chemicals / Materials | 1 | $18B |
|
||
Price history
+200.4% since first listed20 events — show timeline
- 2026-04-07 Pending — BRIGHT MLS
- 2025-12-23 Price Changed $225,000 BRIGHT MLS
- 2025-11-11 Listed $227,500 BRIGHT MLS
- 2016-11-01 Listing Removed — BRIGHT MLS
- 2014-04-01 Listed $60,000 BRIGHT MLS
- 2012-08-28 Listing Removed — BRIGHT MLS
- 2012-07-01 Listed $108,000 BRIGHT MLS
- 2012-06-06 Listing Removed — BRIGHT MLS
- 2011-06-13 Listed $105,000 BRIGHT MLS
- 2011-06-10 Listing Removed — BRIGHT MLS
- 2011-02-15 Listed $115,000 BRIGHT MLS
- 2010-12-31 Listing Removed — BRIGHT MLS
- 2010-02-10 Listed $115,000 BRIGHT MLS
- 2010-02-07 Listing Removed — BRIGHT MLS
- 2009-08-07 Listed $130,000 BRIGHT MLS
- 2003-10-21 Sold (Public Records) $77,500 Public Records
- 2003-08-28 Sold (MLS) $77,500 BRIGHT MLS
- 2003-06-18 Listed $77,500 BRIGHT MLS
- 2002-06-15 Listing Removed — BRIGHT MLS
- 2001-11-12 Listed $74,900 BRIGHT MLS
Property tax history
+2.2%/yrLatest (2025): $4,092 · +7.6% YoY. Source: county tax records.
Cash-flow waterfall
monthlySold comps — $/sqft
last 12 mo · ≤1 miLoading sold comps…