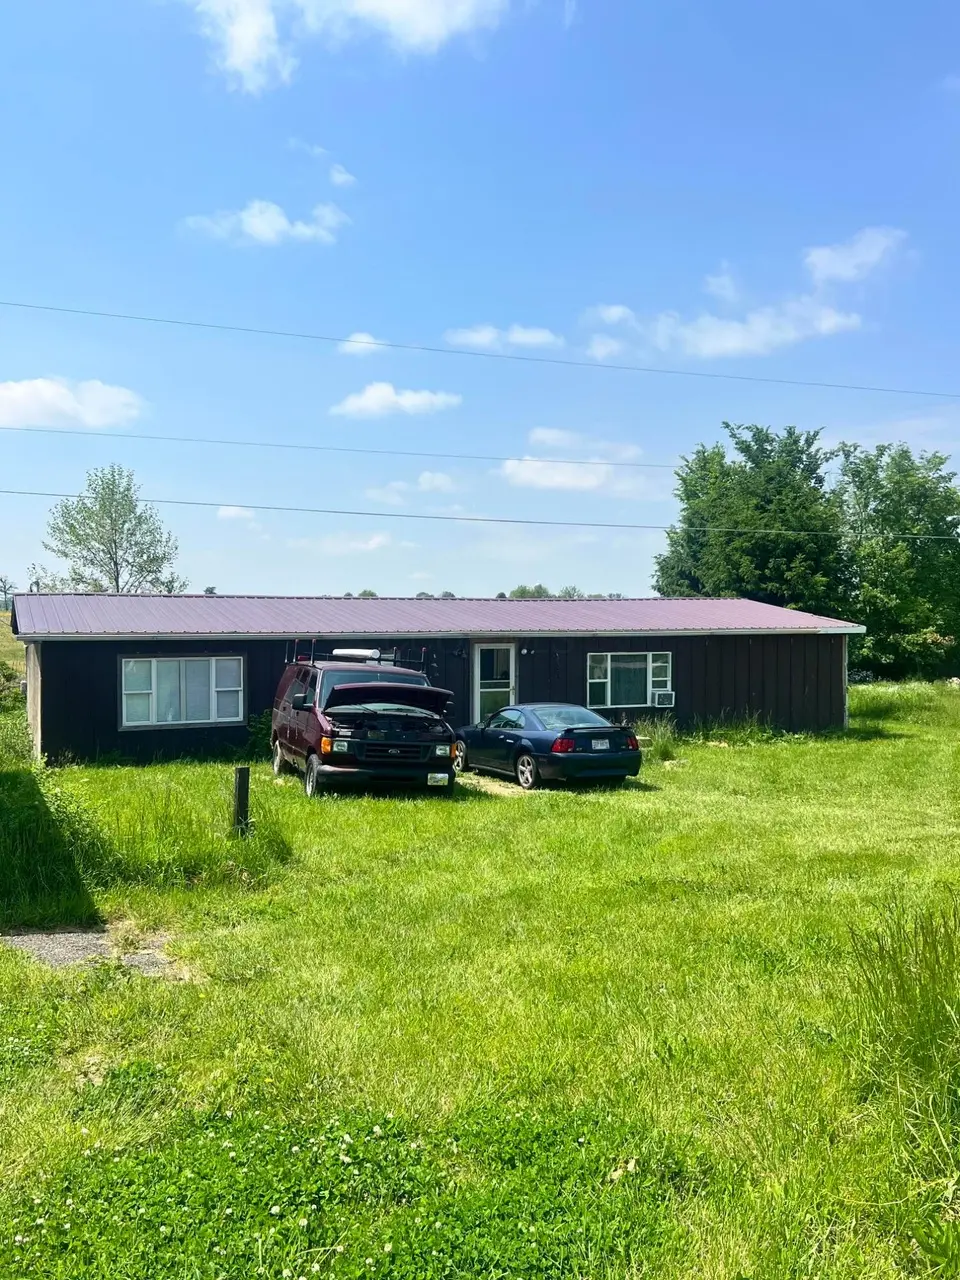
6689 Beaver Run Rd SW · Kirkersville, OH
Flood risk 9/10 · Severe
- FEMA flood zone
- X (unshaded)
- Chance of flooding over 30 yrs
- 0.99%
- Est. flood insurance / yr
- $507 – $1,088
Fire risk 1/10 · Minimal
- Est. fire insurance / yr
- $713 – $1,323
Heat risk 3/10 · Minor
- Hot days now (above 98°F)
- 7 days/yr
- Hot days in 30 yrs
- 18 days/yr
Wind risk 2/10 · Minimal
- Chance of severe wind over 30 yrs
- 1.0%
Air-quality risk 2/10 · Minimal
- Unhealthy air days now
- 1 days/yr
- Unhealthy air days in 30 yrs
- 2 days/yr
Risk factors via First Street. Map © Google.
Why this score? — see what drove the C+ grade
The composite is a weighted blend of 9 inputs, each scored 0–100. Each bar is that input's sub-score; the figure is the points it added to the 100-point composite (weight × sub-score).
- Cash flow +25.8/30.0
- DSCR +8.6/10.0
- ARV discount +7.5/15.0
- 1% rule +6.1/10.0
- Schools +5.4/10.0
- Livability +3.2/5.0
- Rent growth +2.5/5.0
- Condition / age +2.5/5.0
- Appreciation +0.0/10.0
$199,900
🖨 Deal sheet 📄 Offer letter ✓ Due diligence
Listing remarks MLS
Manufactured home on . 95 acres in Harrison Township. Large concrete block garage. Property requires repairs and will not FHA/VA. Property is sold ''as is''. Seller will make no repairs. Proof of funds with all offers. PROPERTY IS IN A FLOOD ZONE
Key facts
- Ranch style home
- 90 amp service
- 0.95 acre lot
Tags
Property features AI
Exterior
- Parking: Detached 2-car garage
- Utilities: Private sewer; Well water
- Home design: Single-family home; One level; Built in 1980; No shared/common walls
- Construction: Block foundation
- Exterior features: Approximately 0.95-acre lot
Interior
- Bedrooms: Three main-level bedrooms
- Flooring: Other flooring
- Bathrooms: Two full bathrooms
- Heating & cooling: Central air conditioning; Electric heating
- Interior features: Insulated windows throughout; Living area approximately 1680
Neighborhood map
What this means for you Summary
Snapshot
- This is a 3-bed/2.0-bath manufactured listed at $200k.
Deal economics
- At list price, monthly cash flow is $417 ($5k/yr) — positive.
- The deal already cash-flows at list — no discount required.
- Meets the 1% rule at list price ($2k rent vs $200k).
- Recommended offer: $197k (1.5% below list) — sets the bar for market timing.
Location & tenants
- Location reads 63/100 on livability (#814 in OH) — a middle-class / working-renter tenant base. Strengths: cost of living A+, housing A+, employment B+; Watch: schools D-, amenities F, commute F.
- Southwest Licking Local (rural): math 59% / reading 62% proficiency, ranked #243 of 656 in OH (top 37%) — acceptable for families but not a draw, mixed tenant base, ~2y average lease.
- Market conditions: 160 active listings in the ZIP; solid renter incomes; 159 units permitted in Licking County in 2024 (0 in 5+ unit buildings).
Forward outlook
- Local home prices are declining (-3.0%/yr); year-one equity from $1k of loan paydown is wiped out by about $6k of value loss. Plan a longer hold.
Negotiation context
- It's been on market 22 days — a 2% lower offer ($197k) is reasonable based on typical stale-listing flexibility.
- 7 sale attempts since 12y ago; this cycle's ask has dropped $20k (9%) from the opening price — seller is motivated, your offer sets the floor, not the list.
- Current owner paid $70k; list at $200k implies a 186% gain — meaningful room to come down on a strong offer.
Risks & watch-outs
- Watch-outs: flood insurance adds $66/mo.
- Climate carrying-cost: severe flood risk — expect insurance premiums to compound above CPI over the hold.
Questions for the listing agent
- What's the actual annual flood-insurance premium (NFIP or private), and is the property in a SFHA with mandatory coverage?
- Is there a deadline driving the sale (1031 exchange, divorce, estate, relocation)? That informs how much negotiation room exists.
- Schools are D-rated, which usually means shorter tenancies and higher turnover. Who's the typical renter profile here, and what's been the actual vacancy rate?
- What's the average days-on-market for RENTAL listings here right now (not sales)? A rising rental-DOM trend means longer vacancies and softer asking-rent achievability than the comps imply.
- What's the recent tenant-quality profile in this submarket — average credit score on applications, eviction rate, late-payment / NSF rate, and stable-employment percentage? A property-management company in the area should have these aggregated.
- How much new for-sale + rental construction is in the pipeline within 1–3 miles? Heavy new supply typically softens prices + rents 12–24 months out; constrained supply supports both.
Investment metrics
- 1% rule
- 1.11% ✓
- Cap rate
- 9.19%
- Cash-on-cash
- 10.36%
- DSCR
- 1.46
- GRM
- 7.5
CMA / ARV
No comps found within radius.
Projected returns pro-forma
-3.0% appreciation · 3.0% rent growth · sell at horizon
- IRR
- -2.8%
- Equity multiple
- 0.90×
- Total profit
- $-5,845
- Equity at exit
- $29,806
- IRR
- 6.9%
- Equity multiple
- 1.52×
- Total profit
- $29,122
- Equity at exit
- $17,284
Cash invested: $55,972 (down + closing). Projections, not guarantees.
Landlord ↔ Tenant lean methodology
- Overall (STATE)
- 73 Landlord-Friendly
- State Ohio
- 73 Landlord-Friendly · R+6
- County
- — inherits STATE
- City
- — inherits STATE
ZIP-level market 43062
- Active inventory
- 160
- Price-to-rent
- 7.5×
Monthly cashflow live
- Estimated rent
- $2,228 medium interval (Pro) →
- Mortgage (P&I)
- −$1,048
- Tax from tax record
- −$145 /mo · $1,746/yr
- Insurance
- −$83
- Flood insurance flood zone
- −$66 /mo · $798/yr
- HOA
- −$0
- Vacancy / Maint / Mgmt
- −$468
- Net cashflow
- $417
Break-even live
UW: 25.0% down · 7.5% · 30yr · 1.5% tax · 5.0% vac · 8.0% maint · 8.0% mgmt
Financing live
Cash to close
- Down payment
- $49,975
- Closing costs
- $5,997
- Reserves months
- —
- Total cash needed
- —
Loan-product check · same deal, 3 products live
Conventional
25% down · 7.5% · 30yr
- Down + closing
- —
- Monthly P&I
- —
- Monthly cashflow
- —
- DSCR
- —
- Eligible?
- —
Personal DTI + credit; lowest rate.
DSCR
20% down · 8.5% · 30yr
- Down + closing
- —
- Monthly P&I
- —
- Monthly cashflow
- —
- DSCR
- —
- Eligible?
- —
No personal income docs; deal must DSCR.
Hard money
10% down · 12.0% · 12mo
- Down + closing
- —
- Monthly P&I
- —
- Monthly cashflow
- —
- DSCR
- —
- Eligible?
- —
Short-term bridge; refi at stabilization.
Listing history 31 events
-
2026-06-18days on market $199,900 Active 22 DOM
-
2026-06-17days on market $199,900 Active 21 DOM
-
2026-06-16days on market $199,900 Active 20 DOM
-
2026-06-15pricedays on market $199,900 Active 19 DOM
-
2026-06-13days on market $220,000 Active 17 DOM
-
2026-06-13days on market $220,000 Active 16 DOM
-
2026-06-09days on market $220,000 Active 13 DOM
-
2026-06-08days on market $220,000 Active 12 DOM
-
2026-06-07days on market $220,000 Active 11 DOM
-
2026-06-05days on market $220,000 Active 8 DOM
-
2026-06-03days on market $220,000 Active 7 DOM
-
2026-06-02days on market $220,000 Active 6 DOM
-
2026-06-01days on market $220,000 Active 5 DOM
-
2026-05-31days on market $220,000 Active 4 DOM
-
2026-05-27$220,000 Active
-
2023-04-03soldstatus $70,000
-
2020-10-25status Contingent Finance and Inspection
-
2020-10-25historical
-
2020-09-21status Contingent Finance and Inspection
-
2020-09-21historical
-
2020-07-27historical Contingent Finance and Inspection
-
2020-07-27historical
-
2020-07-22status Active
-
2020-07-18historical Contingent Finance and Inspection
-
2020-07-17status Active
-
2020-07-06historical Contingent Finance and Inspection
-
2020-07-04$70,000 Active
-
2015-04-06soldstatus $20,000 246-char remark
Show marketing remark (246 chars)
Manufactured home on . 95 acres in Harrison Township. Large concrete block garage. Property requires repairs and will not FHA/VA. Property is sold ''as is''. Seller will make no repairs. Proof of funds with all offers. PROPERTY IS IN A FLOOD ZONE
-
2015-03-10historical 246-char remark
Show marketing remark (246 chars)
Manufactured home on . 95 acres in Harrison Township. Large concrete block garage. Property requires repairs and will not FHA/VA. Property is sold ''as is''. Seller will make no repairs. Proof of funds with all offers. PROPERTY IS IN A FLOOD ZONE
-
2014-11-24$29,900 246-char remark
Show marketing remark (246 chars)
Manufactured home on . 95 acres in Harrison Township. Large concrete block garage. Property requires repairs and will not FHA/VA. Property is sold ''as is''. Seller will make no repairs. Proof of funds with all offers. PROPERTY IS IN A FLOOD ZONE
-
1998-04-02soldstatus $70,000
ⓘ Source: listings_history table (triggers on properties + properties_extension) + one-shot
backfill from property_details.listing_events for pre-trigger history.
Tax reassessment forecast OH · Partial reset (capped growth)
- Current annual tax
- $1,746 · $145/mo
- Projected year-2 tax
- $2,432 · $203/mo
- Expected delta
- +$686/yr (+$57/mo · 39.3%)
ⓘ Screening estimate from a state-policy table — verify with the county assessor before closing.
Climate risk First Street
- Flood 9/10 Extreme FEMA zone X (unshaded) · 99% chance over 30 yrs
- Wildfire 1/10 Low
- Heat 3/10 Moderate 7 d/yr ≥98°F today · 18 d/yr by 30 yrs out
- Wind 2/10 Low 100% chance of damaging wind over 30 yrs
- Air quality 2/10 Low 1 unhealthy d/yr today · 2 by 30 yrs out
Nearby sold comps map
Loading sold comps map…
Walkable amenities ~0.75 mi
Loading nearby amenities…
Taxation est. · year 1
- Rental income
- $26,737
- − Mortgage interest
- −$11,198
- − Property taxes
- −$1,746
- − Insurance
- −$1,797
- − Repairs & maintenance
- −$2,139
- − Management
- −$2,139
- − Depreciation
- −$5,815
- Taxable income
- $1,903
- Est. tax owed @ 24.0%
- −$457
- After-tax cash flow
- $4,543/yr
For passive investors: Depreciation is non-cash, so a rental often shows a tax loss while cash-flowing — sheltering income. Rental losses are passive: they offset passive income freely, and up to $25,000/yr can offset ordinary (W-2) income if you actively participate and your MAGI is under $100k (phasing out to $0 by $150k); unused losses carry forward. On sale, claimed depreciation is recaptured at up to 25%, and gains may owe capital-gains tax (a 1031 exchange can defer both). Figures are a year-1 estimate at your 24.0% rate — not tax advice; consult a CPA.
Schools (NCES district)
- District
- Southwest Licking Local
- NCES district ID
- 3904804
- Math proficiency
- 59% ▼ -13.00%
- Reading proficiency
- 62% ▼ -9.00%
- Median HH income
- $72,711
- Composite
- 53.66/100
- National rank
- #1432
- State rank
- #243 of 656 in OH
Livability — Kirkersville
- Score
- 63/100
- State rank
- #814
- US rank
- #15084
Category grades
Schools grade is shown separately in the Schools card above.
Census & demographics
- County
- Licking County · 109,194 people
- City population
- 413
- Metro
- Columbus, OH
- Population (ZIP)
- 32,037
- Household income
- $105,968
- Rent vs Own
- Severe rent burden
- 316.0
Population outlook (Licking County) Hauer SSP2
- Today (2025)
- 178,210 people
- By 2030
- 180,917 · +1.5%
- By 2040
- 183,885 · +3.2%
- By 2050
- 182,985 · +2.7%
- By 2075
- 178,377 · +0.1%
- By 2100
- 161,075 · -9.6%
Race, ethnicity, and origin ACS 2023
- Neighborhood character
- Predominantly White (79%)
- Race & ethnicity
- White 79% Asian 8% Two or more races 6% Black 5% Hispanic / Latino 4%
- Common ancestry
- Slovak 3% Romanian 2% Scotch-Irish 2%
- Foreign-born
- 9% · India, Canada
- Languages at home
- 88% English-only · Other Indo-European 7% Spanish 2% Arabic 1%
Political lean MEDSL · Licking
- 2024 margin
- Solid R (+30.0) · D 34.5% · R 64.6%
- 2008→2024 swing
- -14.2pp toward R · 2008: -15.8pp · 2024: -30.0pp
- All cycles
- 2024: R+30.0 2020: R+28.1 2016: R+28.9 2012: R+14.7 2008: R+15.8
Not yet ingested
- Civics
- —
Market trends
- HPI YoY
- ▼ -255.15%
- Current HPI
- 236.5135
- Rent YoY
- —
- Metro
- Columbus, OH
- State GDP YoY
- ▲ 1.98%
- F500 in state
- 48
Industry mix (Fortune 500 HQ in OH)
| Industry | F500 HQs | Revenue |
|---|---|---|
| Insurance | 3 | $145B |
|
||
| Industrial Machinery | 3 | $49B |
|
||
| Financial Services | 3 | $24B |
|
||
| Consumer Goods | 2 | $93B |
|
||
| Aerospace / Defense | 2 | $47B |
|
||
| Utilities | 2 | $33B |
|
||
Price history
+214.3% since first listed17 events — show timeline
- 2026-05-27 Listed $220,000 CBRMLS
- 2023-04-03 Sold (Public Records) $70,000 Public Records
- 2020-10-25 Relisted — CBRMLS
- 2020-10-25 Listing Removed — CBRMLS
- 2020-09-21 Relisted — CBRMLS
- 2020-09-21 Listing Removed — CBRMLS
- 2020-07-27 Contingent — CBRMLS
- 2020-07-27 Listing Removed — CBRMLS
- 2020-07-22 Relisted — CBRMLS
- 2020-07-18 Contingent — CBRMLS
- 2020-07-17 Relisted — CBRMLS
- 2020-07-06 Contingent — CBRMLS
- 2020-07-04 Listed $70,000 CBRMLS
- 2015-04-06 Sold (MLS) $20,000 CBRMLS
- 2015-03-10 Listing Removed — CBRMLS
- 2014-11-24 Listed $29,900 CBRMLS
- 1998-04-02 Sold (Public Records) $70,000 Public Records
Property tax history
+0.6%/yrLatest (2025): $1,746 · +5.7% YoY. Source: county tax records.
Cash-flow waterfall
monthlySold comps — $/sqft
last 12 mo · ≤1 miLoading sold comps…