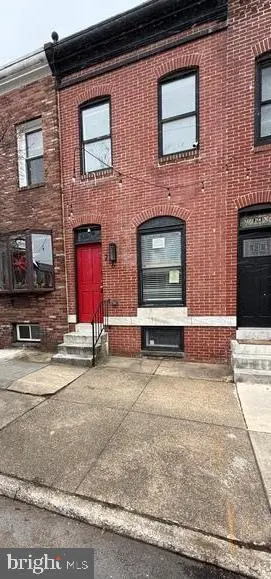
216 S Clinton St · Baltimore, MD
Flood risk 1/10 · Minimal
- FEMA flood zone
- X (unshaded)
- Chance of flooding over 30 yrs
- 0.0%
- Est. flood insurance / yr
- $473 – $860
Fire risk 1/10 · Minimal
- Est. fire insurance / yr
- $755 – $1,403
Heat risk 8/10 · Major
- Hot days now (above 103°F)
- 7 days/yr
- Hot days in 30 yrs
- 15 days/yr
Wind risk 6/10 · Moderate
- Chance of severe wind over 30 yrs
- 27.0%
Air-quality risk 4/10 · Minor
- Unhealthy air days now
- 6 days/yr
- Unhealthy air days in 30 yrs
- 7 days/yr
Risk factors via First Street. Map © Google.
Why this score? — see what drove the D grade
The composite is a weighted blend of 9 inputs, each scored 0–100. Each bar is that input's sub-score; the figure is the points it added to the 100-point composite (weight × sub-score).
- ARV discount +15.0/15.0
- Cash flow +12.7/30.0
- DSCR +3.8/10.0
- Livability +3.8/5.0
- 1% rule +3.0/10.0
- Rent growth +2.8/5.0
- Condition / age +2.5/5.0
- Schools +1.0/10.0
- Appreciation +0.0/10.0
$299,900
🖨 Deal sheet (PDF) 📄 Offer letter ✓ Due diligence
Listing remarks MLS
Prime block of Baltimore homes located on S Clinton St. ! Many renovations have been performed over the past years. This home features high ceilings and an open stairwell. The living room has recessed lighting, bright windows, abundant natural light, custom baulk heads, and an exposed brick wall that has been nicely preserved. There is an eat-in kitchen with stainless steel appliances, granite counter tops, large cabinets, and a center island. Back kitchen door walks out to your 1 car off street all concrete parking pad. There is a main level powder room. On the upper level is the primary and secondary bedroom equipped with recessed lighting, closets, and individual private bathrooms. One bedroom has a walk out back deck for evening relaxation and entertaining. On the lower level is a fully finished family room or bedroom, an area ideal for additional storage and a full bathroom. Main level does need a small amount of drywall repairs and ready to have flooring installed. A very short walk to Patterson park and all the surrounding restaurants.
Key facts
- Custom baulk heads
- Exposed brick wall
- Recessed lighting
Tags
Neighborhood map
What this means for you Summary
Snapshot
- This is a 3-bed/3.5-bath townhouse listed at $300k.
Deal economics
- At list price, monthly cash flow is $-32 ($-380/yr) — negative.
- To cash-flow at today's rent, offer at most $294k (1.9% below list).
- To meet the 1% rule (rent ≥ 1% of price), the offer needs to be $240k (19.9% below list).
- Recommended offer: $240k (19.9% below list) — sets the bar for 1% rule.
Location & tenants
- Location reads 76/100 on livability (#90 in MD, #3,396 nationally) — a middle-class / working-renter tenant base. Strengths: amenities A+, commute A+, housing A+; Watch: crime F.
- Baltimore City Public Schools (urban): math 7% / reading 16% proficiency, ranked #24 of 24 in MD (top 100%) — low school quality limits family demand, transient renter base, plan for 1-2y turnover; 79% free/reduced lunch — lower-income household profile, screen leases tightly.
- Zoned schools: Elmer A. Henderson: A Johns Hopkins Partnership (math 2% / reading 16%, grade F, #650 of 860 statewide, top 77%, 642 students, 80% FRL); Baltimore Polytechnic Institute (math 71% / reading 84%, grade A-, #22 of 222 statewide, top 10%, 1,555 students, 43% FRL) — zoned schools average 62% FRL vs 79% district-wide (17 pts lower); this property's tenant base skews higher-income than the district average.
- Zoned-school proficiency averages 43% at this address vs 12% district-wide (+32 pts) — the actual schools serving this property are materially stronger than the Baltimore City Public Schools average implies; a family-tenant draw the district grade alone would hide.
- Market conditions: Rents rising (+1.3%/yr); 393 active listings in the ZIP; 40 comparable units currently listed for rent nearby; rentals at typical pace (median 26d on market — plan ~3-4 weeks tenant-placement turnaround); solid renter incomes; 1,273 units permitted in Baltimore city in 2024 (1,104 in 5+ unit buildings).
- This rent runs 32% of the median local income ($89k/yr) — at the standard rent-burdened threshold; future hikes will face affordability resistance.
Forward outlook
- Local home prices are declining (-3.0%/yr); year-one equity from $2k of loan paydown is wiped out by about $9k of value loss. Plan a longer hold.
- Baltimore County population projected to shrink 4% by 2050 — rents likely to lag national; underwrite the cash flow, not the appreciation.
Negotiation context
- It's been on market 97 days — a 9% lower offer ($273k) is reasonable based on typical stale-listing flexibility.
- 11 sale attempts since 13y ago with the ask held roughly flat each time — persistent listings suggest the price (not the market) is what's stuck; bring a comps-based counter.
- Current owner paid $257k; 17% above their basis — modest negotiation headroom, anchor on the comps not their cost.
Risks & watch-outs
- Watch-outs: built in 1900 — expect roof / HVAC / electrical / plumbing capex.
- Climate carrying-cost: major wind risk, 27% chance of damaging wind over 30y; extreme-heat days projected 7→15/yr by 2055 (HVAC capex compounding) — expect insurance premiums to compound above CPI over the hold.
Questions for the listing agent
- What do current leases actually rent for vs. the listed asking? Can we see a recent rent roll and the last 12 months of T-12 income?
- It's been on market 97 days. Have you received any prior offers? Is the seller open to a 20% concession, seller financing, or rate buy-down credit?
- Built in 1900 — when were the roof, HVAC, electrical panel, plumbing, and water heater last replaced?
- Why hasn't it sold? Are there any deal-killer items the seller is aware of (foundation, flood, title, zoning, code violations)?
- Is there a deadline driving the sale (1031 exchange, divorce, estate, relocation)? That informs how much negotiation room exists.
- Schools are D-rated, which usually means shorter tenancies and higher turnover. Who's the typical renter profile here, and what's been the actual vacancy rate?
- Crime grade is F in this area — have there been break-ins, vandalism, or insurance claims at this property in the last 3 years? What carrier currently insures it and at what premium?
- The area grade is low — what's the realistic commute time and amenity access for the typical tenant pool here? Any planned neighborhood developments (good or bad) we should know about?
- What's the average days-on-market for RENTAL listings here right now (not sales)? A rising rental-DOM trend means longer vacancies and softer asking-rent achievability than the comps imply.
- What's the recent tenant-quality profile in this submarket — average credit score on applications, eviction rate, late-payment / NSF rate, and stable-employment percentage? A property-management company in the area should have these aggregated.
- How much new for-sale + rental construction is in the pipeline within 1–3 miles? Heavy new supply typically softens prices + rents 12–24 months out; constrained supply supports both.
Investment metrics
- 1% rule
- 0.80% ✗
- Cap rate
- 6.17%
- Cash-on-cash
- -0.45%
- DSCR
- 0.98
- GRM
- 10.4
CMA / ARV
- ARV (median comp)
- $379,760
- List price
- $299,900
- Delta
- -21.03%
- Verdict
- UNDERPRICED
- Comps
- 20 within 1.0 mi
Show comp detail 12 sales within ~0.75 mi
| Address | Dist | Beds/Ba | Sqft | Sold | Price | $/sf | Match |
|---|---|---|---|---|---|---|---|
| 118 S Eaton St | 0.27mi | 3/3.5 | 1,569 (+2%) | 1mo | $330,000 | $210 | 84 |
| 616 S Belnord Ave | 0.52mi | 3/3.0 | 1,608 (+4%) | 1mo | $370,000 | $230 | 66 |
| 36 N Decker Ave | 0.34mi | 3/2.0 | 1,430 (-7%) | 0mo | $325,000 | $227 | 66 |
| 263 S East Ave | 0.07mi | 2/2.0 (-1) | 1,767 (+15%) | 0mo | $375,000 | $212 | 61 |
| 3702 Foster Ave | 0.39mi | 2/2.0 (-1) | 1,632 (+6%) | 1mo | $339,000 | $208 | 60 |
| 902 Grundy St | 0.61mi | 3/2.0 | 1,588 (+3%) | 1mo | $352,500 | $222 | 60 |
| 738 S Macon St | 0.74mi | 3/2.5 | 1,568 (+2%) | 0mo | $348,000 | $222 | 58 |
| 918 S Ellwood Ave | 0.53mi | 3/2.5 | 1,420 (-8%) | 0mo | $392,500 | $276 | 58 |
| 38 S Curley St | 0.31mi | 3/1.0 | 1,729 (+12%) | 1mo | $181,100 | $105 | 55 |
| 2534 E Baltimore St | 0.59mi | 3/3.0 | 1,685 (+9%) | 0mo | $495,000 | $294 | 54 |
| 730 S Decker Ave | 0.42mi | 4/3.5 (+1) | 1,740 (+13%) | 0mo | $564,900 | $325 | 53 |
| 802 S Potomac St | 0.49mi | 3/3.0 | 1,755 (+14%) | 0mo | $435,000 | $248 | 52 |
Match score weights: distance 35% · size 25% · config 20% · recency 20%. Top-matched comps best support the ARV.
Projected returns pro-forma
-3.0% appreciation · 1.31% rent growth · sell at horizon
- IRR
- -18.9%
- Equity multiple
- 0.35×
- Total profit
- $-54,686
- Equity at exit
- $44,716
- IRR
- -14.9%
- Equity multiple
- 0.21×
- Total profit
- $-66,369
- Equity at exit
- $25,930
Cash invested: $83,972 (down + closing). Projections, not guarantees.
Landlord ↔ Tenant lean methodology
- Overall (CITY)
- 12 Strongly Tenant-Friendly
- State Maryland
- 27 Tenant-Leaning · D+14
- County
- — inherits STATE
- City Baltimore
- 12 Strongly Tenant-Friendly · D+58
ZIP-level market 21224
- Rents YoY
- 1.3%
- Active inventory
- 393
- Price-to-rent
- 10.4×
Monthly cashflow live
- Estimated rent
- $2,404 high interval (Pro) →
- Mortgage (P&I)
- −$1,573
- Tax from tax record
- −$233 /mo · $2,794/yr
- Insurance
- −$125
- HOA
- −$0
- Vacancy / Maint / Mgmt
- −$505
- Net cashflow
- $-32
Break-even live
Sensitivity live
| Price | -10% $138 | -5% $53 | +0% $-32 | +5% $-117 | +10% $-201 |
|---|---|---|---|---|---|
| Rent | -10% $-222 | -5% $-127 | +0% $-32 | +5% $63 | +10% $158 |
| Rate | -1.0pp $119 | -0.5pp $45 | base $-32 | +0.5pp $-109 | +1.0pp $-188 |
UW: 25.0% down · 7.5% · 30yr · 1.5% tax · 5.0% vac · 8.0% maint · 8.0% mgmt
Financing live
Cash to close
- Down payment
- $74,975
- Closing costs
- $8,997
- Reserves months
- —
- Total cash needed
- —
Loan-product check · same deal, 3 products live
Conventional
25% down · 7.5% · 30yr
- Down + closing
- —
- Monthly P&I
- —
- Monthly cashflow
- —
- DSCR
- —
- Eligible?
- —
Personal DTI + credit; lowest rate.
DSCR
20% down · 8.5% · 30yr
- Down + closing
- —
- Monthly P&I
- —
- Monthly cashflow
- —
- DSCR
- —
- Eligible?
- —
No personal income docs; deal must DSCR.
Hard money
10% down · 12.0% · 12mo
- Down + closing
- —
- Monthly P&I
- —
- Monthly cashflow
- —
- DSCR
- —
- Eligible?
- —
Short-term bridge; refi at stabilization.
Rent comps 40 comps
| Address | Beds | Baths | Sqft | Rent | $/sqft | DOM | Units | Dist |
|---|---|---|---|---|---|---|---|---|
| 235 S Highland Ave Baltimore, MD | 2.0 | 1.5 | 1222 | $2,000 | $1.64 | 25d | 1 | 0.06mi |
| 249 S East Ave Baltimore, MD | 2.0 | 2.0 | 1680 | $2,250 | $1.34 | 25d | 1 | 0.08mi |
| 106 S Bouldin St Baltimore, MD | 2.0 | 3.0 | 1134 | $2,100 | $1.85 | 22d | 1 | 0.16mi |
| 127 S Robinson St Baltimore, MD | 2.0 | 1.5 | 1400 | $2,000 | $1.43 | 45d | 1 | 0.17mi |
| 3502 E Lombard St Baltimore, MD | 3.0 | 2.0 | 1522 | $1,870 | $1.23 | 45d | 1 | 0.20mi |
| 3710 E Pratt St Baltimore, MD | 2.0 | 3.5 | 1230 | $1,900 | $1.54 | 25d | 1 | 0.22mi |
| 3436 Leverton Ave Baltimore, MD | 3.0 | 3.5 | 1500 | $2,350 | $1.57 | 25d | 1 | 0.23mi |
| 3306 Fleet St Baltimore, MD | 4.0 | 3.0 | 1308 | $3,500 | $2.68 | 45d | 1 | 0.23mi |
| 3304 E Baltimore St Baltimore, MD | 3.0 | 1.5 | 1514 | $1,875 | $1.24 | 45d | 1 | 0.25mi |
| 1 N Clinton St Baltimore, MD | 4.0 | 1.5 | 1200 | $1,700 | $1.42 | 21d | 1 | 0.26mi |
| 3212 E Baltimore St Baltimore, MD | 2.0 | 3.0 | 1931 | $2,350 | $1.22 | 25d | 1 | 0.27mi |
| 3430 E Baltimore St Baltimore, MD | 3.0 | 2.5 | 1316 | $2,250 | $1.71 | 25d | 1 | 0.27mi |
| 115 S Eaton St Baltimore, MD | 3.0 | 2.5 | 1393 | $1,800 | $1.29 | 18d | 1 | 0.29mi |
| 17 N East Ave Baltimore, MD | 2.0 | 2.0 | 1326 | $2,550 | $1.92 | 25d | 1 | 0.31mi |
| 10 N Ellwood Ave Baltimore, MD | 4.0 | 2.5 | 1768 | $2,500 | $1.41 | 45d | 1 | 0.33mi |
| 102 S Curley St Baltimore, MD | 2.0 | 1.5 | 1200 | $1,800 | $1.50 | 6d | 1 | 0.33mi |
| 113 N Clinton St Baltimore, MD | 2.0 | 1.0 | 1300 | $1,995 | $1.53 | 45d | 1 | 0.33mi |
| 622 S Ellwood Ave Baltimore, MD | 3.0 | 2.0 | 1906 | $2,800 | $1.47 | 45d | 1 | 0.33mi |
| 29 N Ellwood Ave Baltimore, MD | 3.0 | 1.5 | 1100 | $2,395 | $2.18 | 25d | 1 | 0.34mi |
| 3905 Bank St Baltimore, MD | 4.0 | 1.0–3.0 | 909 | $2,828 | $3.11 | 0d | 18 | 0.34mi |
| 113 N Decker Ave Baltimore, MD | 3.0 | 3.5 | 1800 | $2,850 | $1.58 | 25d | 1 | 0.39mi |
| 3245 Fait Ave Baltimore, MD | 3.0 | 2.0 | 1470 | $2,900 | $1.97 | 45d | 1 | 0.39mi |
| 4015 Eastern Ave Unit 2L Baltimore, MD | 3.0 | 2.0 | 1100 | $1,800 | $1.64 | 45d | 1 | 0.42mi |
| 822 S Highland Ave Baltimore, MD | 4.0 | 3.0 | 1508 | $3,500 | $2.32 | 23d | 1 | 0.42mi |
| 502 S Haven St Baltimore, MD | 2.0 | 2.5 | 1440 | $2,400 | $1.67 | 18d | 1 | 0.44mi |
| 502 S Haven St Baltimore, MD | 2.0 | 2.5 | 1440 | $2,400 | $1.67 | 25d | 1 | 0.44mi |
| 611 Grundy St Baltimore, MD | 3.0 | 2.0 | 1434 | $2,700 | $1.88 | 25d | 1 | 0.44mi |
| 602 S Streeper St Baltimore, MD | 4.0 | 3.0 | 1980 | $3,200 | $1.62 | 25d | 1 | 0.45mi |
| 11 N Streeper St Baltimore, MD | 3.0 | 3.5 | 1800 | $2,600 | $1.44 | 45d | 1 | 0.45mi |
| 34 N Linwood Ave Baltimore, MD | 2.0 | 1.5 | 1288 | $2,400 | $1.86 | 25d | 1 | 0.45mi |
| 10 N Streeper St Baltimore, MD | 3.0 | 2.5 | 1440 | $2,500 | $1.74 | 25d | 1 | 0.46mi |
| 3036 Hudson St Baltimore, MD | 2.0 | 2.5 | 1428 | $2,600 | $1.82 | 45d | 1 | 0.48mi |
| 150 N Curley St Baltimore, MD | 2.0 | 2.5 | 1266 | $1,850 | $1.46 | 19d | 1 | 0.48mi |
| 3703 Hudson St Baltimore, MD | 4.0 | 3.0 | 1958 | $3,350 | $1.71 | 25d | 1 | 0.51mi |
| 939 S Baylis St Baltimore, MD | 3.0 | 3.0 | 1606 | $3,500 | $2.18 | 19d | 1 | 0.52mi |
| 404 N Robinson St Baltimore, MD | 3.0 | 3.0 | 1320 | $2,100 | $1.59 | 18d | 1 | 0.52mi |
| 404 N Robinson St Baltimore, MD | 3.0 | 3.0 | 1320 | $2,200 | $1.67 | 25d | 1 | 0.52mi |
| 1015 S Clinton St Baltimore, MD | 2.0 | 2.5 | 1880 | $2,800 | $1.49 | 25d | 1 | 0.55mi |
| 2815 Orleans St Baltimore, MD | 2.0 | 1.0 | 1204 | $1,600 | $1.33 | 3d | 1 | 0.59mi |
| 139 N Lakewood Ave Unit 1 Baltimore, MD | 4.0 | 2.0 | 1370 | $2,500 | $1.82 | 45d | 1 | 0.59mi |
Listing history 50 events
-
2026-06-21days on market $299,900 Active 97 DOM
-
2026-06-18days on market $299,900 Active 94 DOM
-
2026-06-17days on market $299,900 Active 93 DOM
-
2026-06-16days on market $299,900 Active 92 DOM
-
2026-06-15days on market $299,900 Active 91 DOM
-
2026-06-13days on market $299,900 Active 89 DOM
-
2026-06-09days on market $299,900 Active 85 DOM
-
2026-06-08days on market $299,900 Active 84 DOM
-
2026-06-07days on market $299,900 Active 83 DOM
-
2026-06-04days on market $299,900 Active 80 DOM
-
2026-06-03days on market $299,900 Active 79 DOM
-
2026-06-02days on market $299,900 Active 78 DOM
-
2026-06-01days on market $299,900 Active 77 DOM
-
2026-05-31days on market $299,900 Active 76 DOM
-
2026-04-18price $309,900 1060-char remark
Show marketing remark (1060 chars)
Prime block of Baltimore homes located on S Clinton St. ! Many renovations have been performed over the past years. This home features high ceilings and an open stairwell. The living room has recessed lighting, bright windows, abundant natural light, custom baulk heads, and an exposed brick wall that has been nicely preserved. There is an eat-in kitchen with stainless steel appliances, granite counter tops, large cabinets, and a center island. Back kitchen door walks out to your 1 car off street all concrete parking pad. There is a main level powder room. On the upper level is the primary and secondary bedroom equipped with recessed lighting, closets, and individual private bathrooms. One bedroom has a walk out back deck for evening relaxation and entertaining. On the lower level is a fully finished family room or bedroom, an area ideal for additional storage and a full bathroom. Main level does need a small amount of drywall repairs and ready to have flooring installed. A very short walk to Patterson park and all the surrounding restaurants.
-
2026-03-16$314,900 Active 1060-char remark
Show marketing remark (1060 chars)
Prime block of Baltimore homes located on S Clinton St. ! Many renovations have been performed over the past years. This home features high ceilings and an open stairwell. The living room has recessed lighting, bright windows, abundant natural light, custom baulk heads, and an exposed brick wall that has been nicely preserved. There is an eat-in kitchen with stainless steel appliances, granite counter tops, large cabinets, and a center island. Back kitchen door walks out to your 1 car off street all concrete parking pad. There is a main level powder room. On the upper level is the primary and secondary bedroom equipped with recessed lighting, closets, and individual private bathrooms. One bedroom has a walk out back deck for evening relaxation and entertaining. On the lower level is a fully finished family room or bedroom, an area ideal for additional storage and a full bathroom. Main level does need a small amount of drywall repairs and ready to have flooring installed. A very short walk to Patterson park and all the surrounding restaurants.
-
2021-12-12status Pending
-
2021-12-11historical
-
2021-11-19historical Active Under Contract
-
2021-11-07price $320,000
-
2021-10-22$340,000 Active
-
2021-10-22historical
-
2021-09-25price $340,000
-
2021-09-01$349,999 Active
-
2014-08-12soldstatus $257,000
-
2014-07-14soldstatus $257,000
-
2014-07-14soldstatus $257,000 Sold
-
2014-04-02status Contract
-
2014-04-01historical
-
2014-03-22price $265,000
-
2014-01-06historical Withdrawn
-
2014-01-06historical
-
2014-01-06price
-
2014-01-06Active
-
2014-01-06price $269,895 Active
-
2014-01-06status Active
-
2014-01-05$269,895
-
2014-01-01historical
-
2013-12-19price $274,000
-
2013-11-12price $274,995 Active
-
2013-11-12status Active
-
2013-10-12status Contract
-
2013-10-04price $263,500
-
2013-09-16price $274,900
-
2013-07-31$281,500 Active
-
2013-07-30$265,000
-
2013-03-27soldstatus $68,200
-
2013-03-19soldstatus $68,200
-
2013-03-19soldstatus $68,200 Sold
-
2013-03-04status Contingent (No Kick Out)
ⓘ Source: listings_history table (triggers on properties + properties_extension) + one-shot
backfill from property_details.listing_events for pre-trigger history.
Tax reassessment forecast MD · Partial reset (capped growth)
- Current annual tax
- $2,794 · $233/mo
- Projected year-2 tax
- $3,031 · $253/mo
- Expected delta
- +$237/yr (+$20/mo · 8.5%)
ⓘ Screening estimate from a state-policy table — verify with the county assessor before closing.
Climate risk First Street
- Flood 1/10 Low FEMA zone X (unshaded) · 0% chance over 30 yrs
- Wildfire 1/10 Low
- Heat 8/10 Severe 7 d/yr ≥103°F today · 15 d/yr by 30 yrs out
- Wind 6/10 Major 27% chance of damaging wind over 30 yrs
- Air quality 4/10 Moderate 6 unhealthy d/yr today · 7 by 30 yrs out
Nearby sold comps map
Loading sold comps map…
Walkable amenities ~0.75 mi
Loading nearby amenities…
Taxation est. · year 1
- Rental income
- $28,843
- − Mortgage interest
- −$16,799
- − Property taxes
- −$2,794
- − Insurance
- −$1,500
- − Repairs & maintenance
- −$2,307
- − Management
- −$2,307
- − Depreciation
- −$8,724
- Taxable loss
- −$5,589
- Est. tax savings @ 24.0%
- +$1,341
- After-tax cash flow
- $961/yr
For passive investors: Depreciation is non-cash, so a rental often shows a tax loss while cash-flowing — sheltering income. Rental losses are passive: they offset passive income freely, and up to $25,000/yr can offset ordinary (W-2) income if you actively participate and your MAGI is under $100k (phasing out to $0 by $150k); unused losses carry forward. On sale, claimed depreciation is recaptured at up to 25%, and gains may owe capital-gains tax (a 1031 exchange can defer both). Figures are a year-1 estimate at your 24.0% rate — not tax advice; consult a CPA.
Schools (NCES district)
- District
- Baltimore City Public Schools
- NCES district ID
- 2400090
- Math proficiency
- 7% ▼ -9.00%
- Reading proficiency
- 16% ▼ -5.00%
- Median HH income
- $42,108
- Composite
- 10.08/100
- National rank
- #9805
- State rank
- #24 of 24 in MD
Livability — Baltimore
- Score
- 76/100
- State rank
- #90
- US rank
- #3396
Category grades
Schools grade is shown separately in the Schools card above.
Census & demographics
- Census place
- Baltimore, MD
- County
- Baltimore City · 558,601 people
- City population
- 588,727
- Metro
- Baltimore-Columbia-Towson, MD
- Population (ZIP)
- 47,465
- Household income
- $89,017
- Rent vs Own
- Severe rent burden
- 1786.0
Population outlook (Baltimore County) Hauer SSP2
- Today (2025)
- 624,249 people
- By 2030
- 621,541 · -0.4%
- By 2040
- 609,756 · -2.3%
- By 2050
- 597,249 · -4.3%
- By 2075
- 552,236 · -11.5%
- By 2100
- 513,934 · -17.7%
Race, ethnicity, and origin ACS 2023
- Neighborhood character
- Diverse neighborhood (Simpson 0.62)
- Race & ethnicity
- White 55% Hispanic / Latino 21% Black 16% Two or more races 7% Asian 4%
- Hispanic origin (detail)
- Mexican 4% Puerto Rican 2% Dominican 1%
- Common ancestry
- Romanian 5% Lithuanian 2% Italian 1%
- Foreign-born
- 17% · Canada, China, Vietnam
- Languages at home
- 76% English-only · Spanish 18% Other Indo-European 2% Russian/Polish/Slavic 1%
Political lean MEDSL · Baltimore
- 2024 margin
- Solid D (+73.0) · D 85.2% · R 12.2% · Other 2.6%
- 2008→2024 swing
- -2.5pp toward R · 2008: 75.5pp · 2024: 73.0pp
- All cycles
- 2024: D+73.0 2020: D+76.6 2016: D+74.6 2012: D+76.4 2008: D+75.5
Not yet ingested
- Civics
- —
Market trends
- HPI YoY
- ▼ -332.23%
- Current HPI
- 241.284
- Rent YoY
- ▲ 1.31%
- Metro
- Baltimore-Columbia-Towson, MD
- State GDP YoY
- ▲ 2.97%
- F500 in state
- 12
Industry mix (Fortune 500 HQ in MD)
| Industry | F500 HQs | Revenue |
|---|---|---|
| Aerospace / Defense | 1 | $71B |
|
||
| Utilities | 1 | $25B |
|
||
| Hotels | 1 | $24B |
|
||
| Consumer Goods | 1 | $7B |
|
||
| Real Estate | 1 | $6B |
|
||
| Chemicals | 1 | $2B |
|
||
Price history
+1006.8% since first listed41 events — show timeline
- 2026-04-18 Price Changed $309,900 BRIGHT MLS
- 2026-03-16 Listed $314,900 BRIGHT MLS
- 2021-12-12 Pending — BRIGHT MLS
- 2021-12-11 Listing Removed — BRIGHT MLS
- 2021-11-19 Contingent — BRIGHT MLS
- 2021-11-07 Price Changed $320,000 BRIGHT MLS
- 2021-10-22 Listing Removed — BRIGHT MLS
- 2021-10-22 Listed $340,000 BRIGHT MLS
- 2021-09-25 Price Changed $340,000 BRIGHT MLS
- 2021-09-01 Listed $349,999 BRIGHT MLS
- 2014-08-12 Sold (Public Records) $257,000 Public Records
- 2014-07-14 Sold (MLS) $257,000 MRIS
- 2014-07-14 Sold (MLS) $257,000 BRIGHT MLS
- 2014-04-02 Pending — MRIS
- 2014-04-01 Listing Removed — BRIGHT MLS
- 2014-03-22 Price Changed $265,000 MRIS
- 2014-01-06 Delisted — MRIS
- 2014-01-06 Listing Removed — BRIGHT MLS
- 2014-01-06 Price Changed — MRIS
- 2014-01-06 Listed — MRIS
- 2014-01-06 Relisted — MRIS
- 2014-01-06 Price Changed $269,895 MRIS
- 2014-01-05 Listed $269,895 BRIGHT MLS
- 2014-01-01 Delisted — MRIS
- 2013-12-19 Price Changed $274,000 MRIS
- 2013-11-12 Relisted — MRIS
- 2013-11-12 Price Changed $274,995 MRIS
- 2013-10-12 Pending — MRIS
- 2013-10-04 Price Changed $263,500 MRIS
- 2013-09-16 Price Changed $274,900 MRIS
- 2013-07-31 Listed $281,500 MRIS
- 2013-07-30 Listed $265,000 BRIGHT MLS
- 2013-03-27 Sold (Public Records) $68,200 Public Records
- 2013-03-19 Sold (MLS) $68,200 MRIS
- 2013-03-19 Sold (MLS) $68,200 BRIGHT MLS
- 2013-03-04 Pending — MRIS
- 2013-03-04 Listing Removed — BRIGHT MLS
- 2013-02-12 Delisted — MRIS
- 2013-02-11 Listed $65,000 MRIS
- 2013-02-10 Listed $65,000 BRIGHT MLS
- 1986-10-24 Sold (Public Records) $28,000 Public Records
Property tax history
+0.0%/yrLatest (2018): $2,794 · -0.0% YoY. Source: county tax records.
Cash-flow waterfall
monthlySold comps — $/sqft
last 12 mo · ≤1 miLoading sold comps…