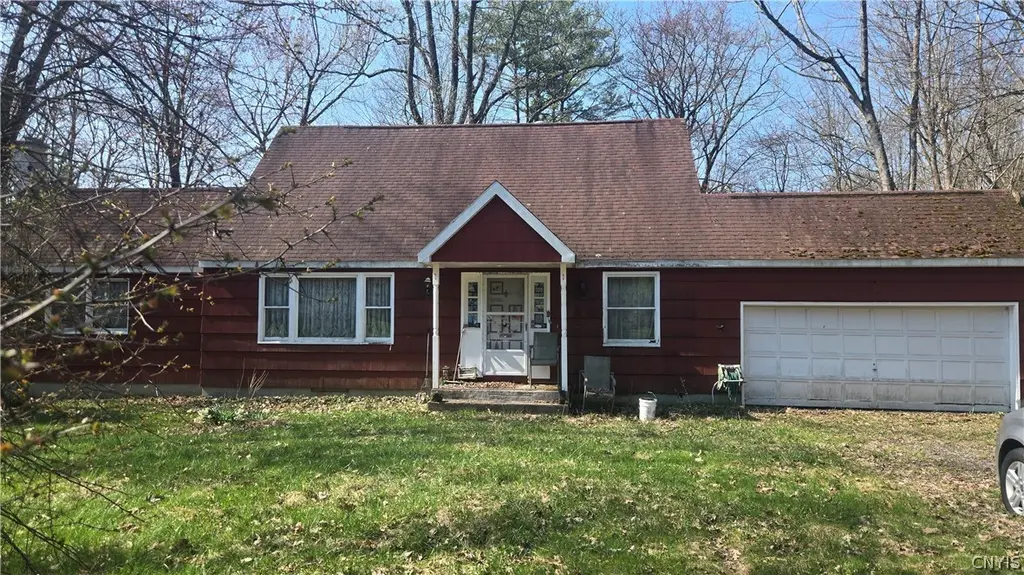
109 Tannery Rd · Constantia, NY
Flood risk 1/10 · Minimal
- FEMA flood zone
- X (unshaded)
- Chance of flooding over 30 yrs
- 0.0%
- Est. flood insurance / yr
- $473 – $860
Fire risk 3/10 · Minor
- Est. fire insurance / yr
- $691 – $1,283
Heat risk 2/10 · Minimal
- Hot days now (above 94°F)
- 7 days/yr
- Hot days in 30 yrs
- 16 days/yr
Wind risk 1/10 · Minimal
- Chance of severe wind over 30 yrs
- —
Air-quality risk 2/10 · Minimal
- Unhealthy air days now
- 1 days/yr
- Unhealthy air days in 30 yrs
- 1 days/yr
Risk factors via First Street. Map © Google.
Why this score? — see what drove the C- grade
The composite is a weighted blend of 9 inputs, each scored 0–100. Each bar is that input's sub-score; the figure is the points it added to the 100-point composite (weight × sub-score).
- Cash flow +12.7/30.0
- Appreciation +10.0/10.0
- ARV discount +7.5/15.0
- 1% rule +7.2/10.0
- DSCR +3.8/10.0
- Schools +3.5/10.0
- Livability +3.2/5.0
- Rent growth +2.5/5.0
- Condition / age +2.5/5.0
$109,000
🖨 Deal sheet 📄 Offer letter ✓ Due diligence
Listing remarks
3 bed 2 full bath home in need of total Renovation. 2.45 Acre lot with small stream behind the home. Home has broker water pipes that caused lots of water damage to the home. most of first floor will need to be gutted. We have added a video tour of the home. * * * * NO INSIDE ACCES IS ALLOWED DUE TO MOLD AND WATER DAMANGE. * * * * Home Sold AS-IS to settle Estate. All contents inside and out will not be removed. buyer my walk the yard. great home to flip or renovate. Cash or Rehab loan needed. home close to Oneida lake, Stores and about 30 mins to Syracuse. There is a Walk Thru Video Link available.
Key facts
- 2.46 acre lot
- 2 garage spots
- Built 1963
Property features AI
Exterior
- Parking: Attached 2-car garage; Driveway
- Utilities: Electricity connected with circuit breakers; Water available/connected (public); Septic tank
- Home design: Single-story home; Resale property
- Construction: Cedar and shake siding; Copper plumbing; Architectural shingle roof; Block foundation; Existing (original) construction
- Exterior features: Dirt driveway; Flag lot; Rural lot; Lot approximately 2.46 acres (dimensions 490 x 205)
Interior
- Kitchen: Eat-in kitchen
- Bedrooms: One main-level bedroom
- Flooring: Carpet; Ceramic tile; Hardwood; Varied flooring
- Bathrooms: Two full bathrooms; One main-level bathroom
- Heating & cooling: Gas heating; Zoned heating; Baseboard heating; Hot water heating; Radiant heating; Zoned cooling
- Interior features: Den; Separate/formal dining room; Eat-in kitchen; Natural woodwork; Main level primary; Full walk-up basement with exterior entry
- Laundry & utility: Laundry in basement; Electric water heater
Neighborhood map
What this means for you Summary
Snapshot
- This is a 3-bed/2.0-bath single-family listed at $109k.
Deal economics
- At list price, monthly cash flow is $-13 ($-155/yr) — negative.
- To cash-flow at today's rent, offer at most $107k (2.1% below list).
- Meets the 1% rule at list price ($1k rent vs $109k).
- Recommended offer: $107k (2.1% below list) — sets the bar for cash-flow.
- Cap rate 6.2% vs local median 3.3% in Constantia — top-decile yield for the area; either an underpriced asset or a hidden risk that comps aren't pricing in. Stress-test before assuming the spread holds.
Location & tenants
- Location reads 65/100 on livability (#672 in NY) — a middle-class / working-renter tenant base. Strengths: crime A+, employment A+, cost of living A+; Watch: schools D-, amenities F, commute F.
- Central Square Central School District (suburban): math 40% / reading 40% proficiency, ranked #507 of 590 in NY (top 86%) — families likely to look elsewhere, expect single-tenant / working-renter base with shorter leases.
- Market conditions: 12 active listings in the ZIP; 172 units permitted in Oswego County in 2024 (27 in 5+ unit buildings).
Forward outlook
- In year one you build about $12k of equity ($754 loan paydown + $11k appreciation (10.0% local appreciation)).
- Oswego County population projected at -23% by 2050 — secular population decline; favor cash flow + early exit over multi-decade hold.
- At projected returns (10.0% appreciation + 3.0% rent growth), your $31k cash investment doubles in ~3 years — after that, you're playing with house money.
- By year 4, paydown + projected appreciation supports a ~$41k cash-out refi (75% LTV) — recoverable capital for the next deal without selling this one.
Negotiation context
- It's been on market 21 days — a 2% lower offer ($107k) is reasonable based on typical stale-listing flexibility.
Risks & watch-outs
- Watch-outs: property tax is 4.9% of price.
Questions for the listing agent
- What do current leases actually rent for vs. the listed asking? Can we see a recent rent roll and the last 12 months of T-12 income?
- Built in 1963 — when were the roof, HVAC, electrical panel, plumbing, and water heater last replaced?
- Property tax is high relative to price — has the assessment been appealed recently, and will the sale trigger a re-assessment?
- Is there a deadline driving the sale (1031 exchange, divorce, estate, relocation)? That informs how much negotiation room exists.
- Schools are D-rated, which usually means shorter tenancies and higher turnover. Who's the typical renter profile here, and what's been the actual vacancy rate?
- What's the average days-on-market for RENTAL listings here right now (not sales)? A rising rental-DOM trend means longer vacancies and softer asking-rent achievability than the comps imply.
- What's the recent tenant-quality profile in this submarket — average credit score on applications, eviction rate, late-payment / NSF rate, and stable-employment percentage? A property-management company in the area should have these aggregated.
- How much new for-sale + rental construction is in the pipeline within 1–3 miles? Heavy new supply typically softens prices + rents 12–24 months out; constrained supply supports both.
Investment metrics
- 1% rule
- 1.22% ✓
- Cap rate
- 6.15%
- Cash-on-cash
- -0.51%
- DSCR
- 0.98
- GRM
- 6.9
CMA / ARV
- ARV (median comp)
- $274,417
- List price
- $109,000
- Delta
- -60.28%
- Verdict
- UNDERPRICED
- Comps
- 14 within 1.0 mi
Show comp detail 3 sales within ~0.75 mi
| Address | Dist | Beds/Ba | Sqft | Sold | Price | $/sf | Match |
|---|---|---|---|---|---|---|---|
| 74 Redfield St | 0.42mi | 3/2.0 | 2,106 (+9%) | 7mo | $285,000 | $135 | 60 |
| 3 Kibbie Lake Rd | 0.66mi | 4/2.5 (+1) | 2,059 (+6%) | 2mo | $252,000 | $122 | 50 |
| 315 County Route 23 | 0.66mi | 3/2.0 | 1,664 (-14%) | 8mo | $167,500 | $101 | 39 |
Match score weights: distance 35% · size 25% · config 20% · recency 20%. Top-matched comps best support the ARV.
Projected returns pro-forma
10.0% appreciation · 3.0% rent growth · sell at horizon
- IRR
- 24.0%
- Equity multiple
- 2.93×
- Total profit
- $58,752
- Equity at exit
- $98,196
- IRR
- 21.3%
- Equity multiple
- 6.70×
- Total profit
- $174,073
- Equity at exit
- $211,763
Cash invested: $30,520 (down + closing). Projections, not guarantees.
Landlord ↔ Tenant lean methodology
- Overall (STATE)
- 15 Strongly Tenant-Friendly
- State New York
- 15 Strongly Tenant-Friendly · D+10
- County
- — inherits STATE
- City
- — inherits STATE
ZIP-level market 13044
- Home prices YoY
- 33.5%
- Active inventory
- 12
- Price-to-rent
- 6.9×
Monthly cashflow live
- Estimated rent
- $1,325 medium interval (Pro) →
- Mortgage (P&I)
- −$572
- Tax from tax record
- −$442 /mo · $5,310/yr
- Insurance
- −$45
- HOA
- −$0
- Vacancy / Maint / Mgmt
- −$278
- Net cashflow
- $-13
Break-even live
UW: 25.0% down · 7.5% · 30yr · 1.5% tax · 5.0% vac · 8.0% maint · 8.0% mgmt
Financing live
Cash to close
- Down payment
- $27,250
- Closing costs
- $3,270
- Reserves months
- —
- Total cash needed
- —
Loan-product check · same deal, 3 products live
Conventional
25% down · 7.5% · 30yr
- Down + closing
- —
- Monthly P&I
- —
- Monthly cashflow
- —
- DSCR
- —
- Eligible?
- —
Personal DTI + credit; lowest rate.
DSCR
20% down · 8.5% · 30yr
- Down + closing
- —
- Monthly P&I
- —
- Monthly cashflow
- —
- DSCR
- —
- Eligible?
- —
No personal income docs; deal must DSCR.
Hard money
10% down · 12.0% · 12mo
- Down + closing
- —
- Monthly P&I
- —
- Monthly cashflow
- —
- DSCR
- —
- Eligible?
- —
Short-term bridge; refi at stabilization.
Listing history 1 events
-
2026-04-30$109,000 Active 613-char remark
ⓘ Source: listings_history table (triggers on properties + properties_extension) + one-shot
backfill from property_details.listing_events for pre-trigger history.
Tax reassessment forecast NY · Partial reset (capped growth)
- Current annual tax
- $5,310 · $442/mo
- Projected year-2 tax
- $5,310 · $442/mo
- Expected delta
- $0/yr ($0/mo · 0.0%)
ⓘ Screening estimate from a state-policy table — verify with the county assessor before closing.
Climate risk First Street
- Flood 1/10 Low FEMA zone X (unshaded) · 0% chance over 30 yrs
- Wildfire 3/10 Moderate
- Heat 2/10 Low 7 d/yr ≥94°F today · 16 d/yr by 30 yrs out
- Wind 1/10 Low
- Air quality 2/10 Low 1 unhealthy d/yr today · 1 by 30 yrs out
Nearby sold comps map
Loading sold comps map…
Walkable amenities ~0.75 mi
Loading nearby amenities…
Taxation est. · year 1
- Rental income
- $15,898
- − Mortgage interest
- −$6,106
- − Property taxes
- −$5,310
- − Insurance
- −$545
- − Repairs & maintenance
- −$1,272
- − Management
- −$1,272
- − Depreciation
- −$3,171
- Taxable loss
- −$1,777
- Est. tax savings @ 24.0%
- +$426
- After-tax cash flow
- $272/yr
For passive investors: Depreciation is non-cash, so a rental often shows a tax loss while cash-flowing — sheltering income. Rental losses are passive: they offset passive income freely, and up to $25,000/yr can offset ordinary (W-2) income if you actively participate and your MAGI is under $100k (phasing out to $0 by $150k); unused losses carry forward. On sale, claimed depreciation is recaptured at up to 25%, and gains may owe capital-gains tax (a 1031 exchange can defer both). Figures are a year-1 estimate at your 24.0% rate — not tax advice; consult a CPA.
Schools (NCES district)
- District
- Central Square Central School District
- NCES district ID
- 3606900
- Math proficiency
- 40% ▼ -18.00%
- Reading proficiency
- 40% ▼ -12.00%
- Median HH income
- $55,807
- Composite
- 35.05/100
- National rank
- #5035
- State rank
- #507 of 590 in NY
Livability — Constantia
- Score
- 65/100
- State rank
- #672
- US rank
- #12597
Category grades
Schools grade is shown separately in the Schools card above.
Census & demographics
- Census place
- Constantia, NY
- Population (ZIP)
- 2,884
Population outlook (Oswego County) Hauer SSP2
- Today (2025)
- 114,465 people
- By 2030
- 109,968 · -3.9%
- By 2040
- 99,205 · -13.3%
- By 2050
- 87,979 · -23.1%
- By 2075
- 65,100 · -43.1%
- By 2100
- 47,117 · -58.8%
Race, ethnicity, and origin ACS 2023
- Neighborhood character
- Predominantly White (91%)
- Race & ethnicity
- White 91% Two or more races 9% Hispanic / Latino 7%
- Hispanic origin (detail)
- Mexican 4% Puerto Rican 2%
- Common ancestry
- Lithuanian 14% Portuguese 4% Romanian 4%
- Foreign-born
- 3% · Canada
- Languages at home
- 93% English-only · Spanish 4% French/Haitian/Cajun 3% German/W. Germanic 1%
Political lean MEDSL · Oswego
- 2024 margin
- Strong R (+24.2) · D 37.9% · R 62.1%
- 2008→2024 swing
- -26.6pp toward R · 2008: 2.5pp · 2024: -24.2pp
- All cycles
- 2024: R+24.2 2020: R+20.2 2016: R+23.2 2012: D+7.9 2008: D+2.5
Not yet ingested
- Civics
- —
Market trends
- HPI YoY
- ▲ 65.34%
- Current HPI
- 260.47
- Rent YoY
- —
- Metro
- —
- State GDP YoY
- ▲ 2.60%
- F500 in state
- 92
Industry mix (Fortune 500 HQ in NY)
| Industry | F500 HQs | Revenue |
|---|---|---|
| Financial Services | 10 | $950B |
|
||
| Consumer Goods | 9 | $162B |
|
||
| Insurance | 4 | $225B |
|
||
| Telecommunications | 2 | $144B |
|
||
| Pharmaceuticals | 2 | $112B |
|
||
| Media / Entertainment | 2 | $69B |
|
||
Price history
2 events — show timeline
- 2026-05-21 Pending — CNYIS
- 2026-04-30 Listed $109,000 CNYIS
Property tax history
+5.6%/yrLatest (2025): $5,310 · +2.4% YoY. Source: county tax records.
Cash-flow waterfall
monthlySold comps — $/sqft
last 12 mo · ≤1 miLoading sold comps…