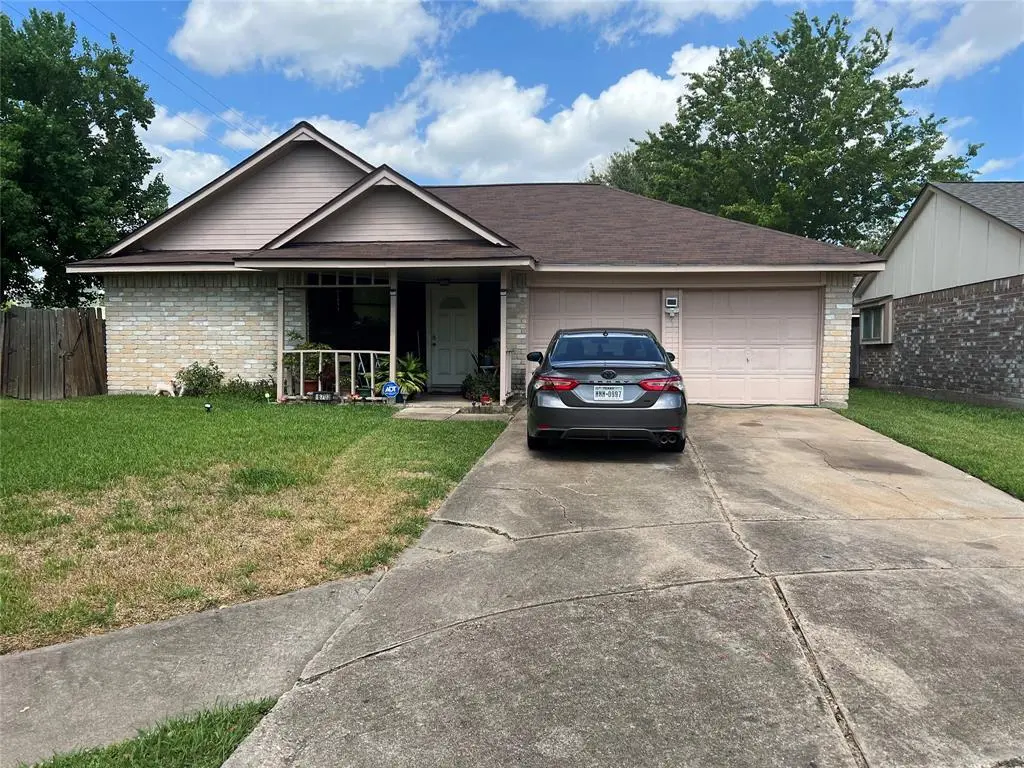
16703 Gold Bridge Ct · Houston, TX
Flood risk 1/10 · Minimal
- FEMA flood zone
- X (unshaded)
- Chance of flooding over 30 yrs
- 0.0%
- Est. flood insurance / yr
- $507 – $1,088
Fire risk 4/10 · Minor
- Est. fire insurance / yr
- $1,222 – $2,270
Heat risk 9/10 · Severe
- Hot days now (above 110°F)
- 7 days/yr
- Hot days in 30 yrs
- 24 days/yr
Wind risk 9/10 · Severe
- Chance of severe wind over 30 yrs
- 99.0%
Air-quality risk 3/10 · Minor
- Unhealthy air days now
- 2 days/yr
- Unhealthy air days in 30 yrs
- 3 days/yr
Risk factors via First Street. Map © Google.
Why this score? — see what drove the C- grade
The composite is a weighted blend of 9 inputs, each scored 0–100. Each bar is that input's sub-score; the figure is the points it added to the 100-point composite (weight × sub-score).
- Cash flow +15.6/30.0
- ARV discount +13.1/15.0
- 1% rule +5.2/10.0
- DSCR +4.8/10.0
- Schools +4.5/10.0
- Livability +3.7/5.0
- Rent growth +2.9/5.0
- Condition / age +2.5/5.0
- Appreciation +0.0/10.0
$165,000
🖨 Deal sheet 📄 Offer letter ✓ Due diligence
Key facts
- 7,013 sq ft lot
- 2 garage spots
- Built 1983
Property features AI
Finance
- Other: Municipal Utility District disclosure provided
Exterior
- Parking: Attached garage with 2 spaces
- Utilities: Public water
- Home design: Residential property; Single-story (all main rooms listed on first level)
- Construction: Brick construction; Built in 1983; Composition roof; Slab foundation
- Exterior features: Corner lot
Interior
- Bedrooms: Primary bedroom on the first level, approximately 20 x 12; Two additional bedrooms on the first level, each approximately 11 x 10
- Bathrooms: Two full bathrooms
- Heating & cooling: Central heating (electric); Central air conditioning (gas)
- Interior features: One fireplace; Living room (First level), approximately 25 x 15
Neighborhood map
What this means for you Summary
Snapshot
- This is a 2-bed/2.0-bath single-family listed at $165k.
Deal economics
- At list price, monthly cash flow is $68 ($820/yr) — positive.
- The deal already cash-flows at list — no discount required.
- Meets the 1% rule at list price ($2k rent vs $165k).
- Cap rate 6.8% vs local median 3.2% in Houston — top-decile yield for the area; either an underpriced asset or a hidden risk that comps aren't pricing in. Stress-test before assuming the spread holds.
Location & tenants
- Location reads 74/100 on livability (#184 in TX, #4,771 nationally) — a middle-class / working-renter tenant base. Strengths: amenities A+, cost of living A+, housing A+; Watch: schools D, crime F.
- Fort Bend ISD (suburban): math 44% / reading 53% proficiency, ranked #140 of 826 in TX (top 17%) — families likely to look elsewhere, expect single-tenant / working-renter base with shorter leases.
- Market conditions: Rents rising (+1.7%/yr); 115 active listings in the ZIP; 15 comparable units currently listed for rent nearby; rentals leasing fast (median 10d on market — plan ~1-2 weeks tenant-placement turnaround); 12,093 units permitted in Fort Bend County in 2024 (815 in 5+ unit buildings).
- This rent runs 30% of the median local income ($67k/yr) — at the standard rent-burdened threshold; future hikes will face affordability resistance.
Forward outlook
- Local home prices are declining (-3.0%/yr); year-one equity from $1k of loan paydown is wiped out by about $5k of value loss. Plan a longer hold.
- Fort Bend County population projected at +75% by 2050 — long-run rental-demand tailwind backs the buy-and-hold thesis.
Negotiation context
- Only 1 days on market — expect competitive offers; lowballing is unlikely to land.
- 5 sale attempts since 4y ago; this cycle's ask has dropped $15k (8%) from the opening price — seller is motivated, your offer sets the floor, not the list.
Risks & watch-outs
- Climate carrying-cost: severe wind risk, 99% chance of damaging wind over 30y; extreme-heat days projected 7→24/yr by 2055 (HVAC capex compounding) — expect insurance premiums to compound above CPI over the hold.
Questions for the listing agent
- Is there a deadline driving the sale (1031 exchange, divorce, estate, relocation)? That informs how much negotiation room exists.
- Schools are D-rated, which usually means shorter tenancies and higher turnover. Who's the typical renter profile here, and what's been the actual vacancy rate?
- Crime grade is F in this area — have there been break-ins, vandalism, or insurance claims at this property in the last 3 years? What carrier currently insures it and at what premium?
- What's the average days-on-market for RENTAL listings here right now (not sales)? A rising rental-DOM trend means longer vacancies and softer asking-rent achievability than the comps imply.
- What's the recent tenant-quality profile in this submarket — average credit score on applications, eviction rate, late-payment / NSF rate, and stable-employment percentage? A property-management company in the area should have these aggregated.
- How much new for-sale + rental construction is in the pipeline within 1–3 miles? Heavy new supply typically softens prices + rents 12–24 months out; constrained supply supports both.
Investment metrics
- 1% rule
- 1.02% ✓
- Cap rate
- 6.79%
- Cash-on-cash
- 1.77%
- DSCR
- 1.08
- GRM
- 8.2
CMA / ARV
- ARV (median comp)
- $188,561
- List price
- $165,000
- Delta
- -1.89%
- Verdict
- FAIR
- Comps
- 20 within 1.0 mi
Show comp detail 12 sales within ~0.75 mi
| Address | Dist | Beds/Ba | Sqft | Sold | Price | $/sf | Match |
|---|---|---|---|---|---|---|---|
| 5419 Quail Cove Ln | 0.24mi | 3/2.0 (+1) | 1,243 (-4%) | 7mo | $205,000 | $165 | 72 |
| 5422 Quail Cove Ln | 0.27mi | 3/2.0 (+1) | 1,375 (+6%) | 3mo | $215,000 | $156 | 70 |
| 16715 Gold Bridge Ct | 0.03mi | 3/2.0 (+1) | 1,458 (+12%) | 6mo | $149,900 | $103 | 67 |
| 16314 Edgemont Dr | 0.48mi | 3/2.0 (+1) | 1,328 (+2%) | 2mo | $180,000 | $136 | 67 |
| 5007 Ridgecreek Dr | 0.63mi | 3/2.0 (+1) | 1,336 (+3%) | 0mo | $199,000 | $149 | 60 |
| 16222 Coyridge Ln | 0.67mi | 3/2.0 (+1) | 1,275 (-2%) | 2mo | $235,000 | $184 | 59 |
| 5606 Lyden Ridge Dr | 0.66mi | 3/2.0 (+1) | 1,258 (-3%) | 1mo | $194,900 | $155 | 59 |
| 16123 Canaridge Dr | 0.73mi | 3/2.0 (+1) | 1,265 (-2%) | 0mo | $220,000 | $174 | 56 |
| 6431 Marinwood Dr | 0.60mi | 3/2.0 (+1) | 1,405 (+8%) | 1mo | $270,000 | $192 | 52 |
| 16319 Clearmont Dr | 0.63mi | 3/2.0 (+1) | 1,177 (-9%) | 1mo | $175,000 | $149 | 49 |
| 5111 Raven Ridge Dr | 0.73mi | 3/2.0 (+1) | 1,181 (-9%) | 1mo | $175,000 | $148 | 46 |
| 4923 Cotton Ridge Trl | 0.75mi | 3/2.0 (+1) | 1,403 (+8%) | 5mo | $230,000 | $164 | 42 |
Match score weights: distance 35% · size 25% · config 20% · recency 20%. Top-matched comps best support the ARV.
Projected returns pro-forma
-3.0% appreciation · 1.72% rent growth · sell at horizon
- IRR
- -15.0%
- Equity multiple
- 0.47×
- Total profit
- $-24,429
- Equity at exit
- $24,602
- IRR
- -8.8%
- Equity multiple
- 0.48×
- Total profit
- $-23,830
- Equity at exit
- $14,266
Cash invested: $46,200 (down + closing). Projections, not guarantees.
Landlord ↔ Tenant lean methodology
- Overall (STATE)
- 87 Strongly Landlord-Friendly
- State Texas
- 87 Strongly Landlord-Friendly · R+5
- County
- — inherits STATE
- City
- — inherits STATE
ZIP-level market 77053
- Rents YoY
- 1.7%
- Active inventory
- 115
- Price-to-rent
- 8.2×
Monthly cashflow live
- Estimated rent
- $1,685 high interval (Pro) →
- Mortgage (P&I)
- −$865
- Tax from tax record
- −$329 /mo · $3,947/yr
- Insurance
- −$69
- HOA
- −$0
- Vacancy / Maint / Mgmt
- −$354
- Net cashflow
- $68
Break-even live
UW: 25.0% down · 7.5% · 30yr · 1.5% tax · 5.0% vac · 8.0% maint · 8.0% mgmt
Financing live
Cash to close
- Down payment
- $41,250
- Closing costs
- $4,950
- Reserves months
- —
- Total cash needed
- —
Loan-product check · same deal, 3 products live
Conventional
25% down · 7.5% · 30yr
- Down + closing
- —
- Monthly P&I
- —
- Monthly cashflow
- —
- DSCR
- —
- Eligible?
- —
Personal DTI + credit; lowest rate.
DSCR
20% down · 8.5% · 30yr
- Down + closing
- —
- Monthly P&I
- —
- Monthly cashflow
- —
- DSCR
- —
- Eligible?
- —
No personal income docs; deal must DSCR.
Hard money
10% down · 12.0% · 12mo
- Down + closing
- —
- Monthly P&I
- —
- Monthly cashflow
- —
- DSCR
- —
- Eligible?
- —
Short-term bridge; refi at stabilization.
Rent comps 15 comps
| Address | Beds | Baths | Sqft | Rent | $/sqft | DOM | Units | Dist |
|---|---|---|---|---|---|---|---|---|
| 16603 Sentinel Dr Houston, TX | 3.0 | 2.0 | 1296 | $1,799 | $1.39 | 16d | 1 | 0.11mi |
| 5030 Shadowridge Dr Houston, TX | 3.0 | 2.0 | 1310 | $1,800 | $1.37 | 43d | 1 | 0.55mi |
| 5030 Ridgecreek Dr Houston, TX | 3.0 | 2.0 | 1399 | $1,659 | $1.19 | 2d | 1 | 0.55mi |
| 16432 Chimney Rock Rd Unit 2174 Houston, TX | 2.0 | 2.0 | 1026 | $1,327 | $1.29 | 10d | 1 | 0.71mi |
| 16432 Chimney Rock Rd Unit 3174 Houston, TX | 3.0 | 2.0 | 1349 | $1,513 | $1.12 | 10d | 1 | 0.71mi |
| 16432 Chimney Rock Rd Apt 424 Houston, TX | 2.0 | 2.0 | 1026 | $1,292 | $1.26 | 5d | 1 | 0.71mi |
| 16432 Chimney Rock Rd Unit 3112 Houston, TX | 3.0 | 2.0 | 1349 | $1,481 | $1.10 | 2d | 1 | 0.71mi |
| 16432 Chimney Rock Rd Unit 16489 Houston, TX | 2.0 | 2.0 | 1026 | $1,317 | $1.28 | 43d | 1 | 0.71mi |
| 16432 Chimney Rock Rd Unit 2112 Houston, TX | 2.0 | 2.0 | 1026 | $1,284 | $1.25 | 2d | 1 | 0.71mi |
| 16432 Chimney Rock Rd Unit 16465 Houston, TX | 3.0 | 2.0 | 1349 | $1,524 | $1.13 | 43d | 1 | 0.71mi |
| 16211 Corsair Rd Houston, TX | 3.0 | 2.0 | 1139 | $1,813 | $1.59 | 24d | 1 | 0.72mi |
| 5721 Melanite Ave Houston, TX | 3.0 | 1.5 | 1634 | $1,481 | $0.91 | 19d | 1 | 1.09mi |
| 15810 Boonridge Rd Houston, TX | 3.0 | 2.0 | 1221 | $1,750 | $1.43 | 43d | 1 | 1.22mi |
| 6406 Summer Ridge Dr Missouri City, TX | 3.0 | 2.0 | 1624 | $1,958 | $1.21 | 2d | 1 | 1.35mi |
| 6610 Rowell Ct Missouri City, TX | 3.0 | 2.0 | 1753 | $2,056 | $1.17 | 5d | 1 | 1.46mi |
Listing history 25 events
-
2026-06-18pricedays on market $165,000 Active 1 DOM
-
2026-06-17days on market $175,000 Active 9 DOM
-
2026-06-16days on market $175,000 Active 8 DOM
-
2026-06-15days on market $175,000 Active 7 DOM
-
2026-06-13days on market $175,000 Active 5 DOM
-
2026-06-08pricedays on market $175,000 Active 1 DOM
-
2026-06-07days on market $185,000 Active 23 DOM
-
2026-06-04days on market $185,000 Active 20 DOM
-
2026-06-03days on market $185,000 Active 19 DOM
-
2026-06-02days on market $185,000 Active 18 DOM
-
2026-06-01days on market $185,000 Active 17 DOM
-
2026-05-31days on market $185,000 Active 16 DOM
-
2026-05-15$185,000 Active
-
2024-06-03historical $1,650
-
2024-05-26price $1,650
-
2024-05-13$1,600
-
2022-12-29historical
-
2022-11-24$215,000 Active
-
2022-09-26soldstatus
-
2022-09-22soldstatus Sold
-
2022-09-13status Pending
-
2022-09-08soldstatus
-
2022-09-07$159,000 Active
-
2005-03-15soldstatus
-
1997-10-06soldstatus
ⓘ Source: listings_history table (triggers on properties + properties_extension) + one-shot
backfill from property_details.listing_events for pre-trigger history.
Tax reassessment forecast TX · Resets to sale price
- Current annual tax
- $3,947 · $329/mo
- Projected year-2 tax
- $3,947 · $329/mo
- Expected delta
- $0/yr ($0/mo · 0.0%)
ⓘ Screening estimate from a state-policy table — verify with the county assessor before closing.
Climate risk First Street
- Flood 1/10 Low FEMA zone X (unshaded) · 0% chance over 30 yrs
- Wildfire 4/10 Moderate
- Heat 9/10 Extreme 7 d/yr ≥110°F today · 24 d/yr by 30 yrs out
- Wind 9/10 Extreme 99% chance of damaging wind over 30 yrs
- Air quality 3/10 Moderate 2 unhealthy d/yr today · 3 by 30 yrs out
Nearby sold comps map
Loading sold comps map…
Walkable amenities ~0.75 mi
Loading nearby amenities…
Taxation est. · year 1
- Rental income
- $20,221
- − Mortgage interest
- −$9,243
- − Property taxes
- −$3,947
- − Insurance
- −$825
- − Repairs & maintenance
- −$1,618
- − Management
- −$1,618
- − Depreciation
- −$4,800
- Taxable loss
- −$1,828
- Est. tax savings @ 24.0%
- +$439
- After-tax cash flow
- $1,259/yr
For passive investors: Depreciation is non-cash, so a rental often shows a tax loss while cash-flowing — sheltering income. Rental losses are passive: they offset passive income freely, and up to $25,000/yr can offset ordinary (W-2) income if you actively participate and your MAGI is under $100k (phasing out to $0 by $150k); unused losses carry forward. On sale, claimed depreciation is recaptured at up to 25%, and gains may owe capital-gains tax (a 1031 exchange can defer both). Figures are a year-1 estimate at your 24.0% rate — not tax advice; consult a CPA.
Schools (NCES district)
- District
- Fort Bend ISD
- NCES district ID
- 4819650
- Math proficiency
- 44% ▼ -15.00%
- Reading proficiency
- 53% ▼ -4.00%
- Median HH income
- $82,360
- Composite
- 44.61/100
- National rank
- #2779
- State rank
- #140 of 826 in TX
Livability — Houston
- Score
- 74/100
- State rank
- #184
- US rank
- #4771
Category grades
Schools grade is shown separately in the Schools card above.
Census & demographics
- Census place
- Houston, TX
- County
- Fort Bend County · 836,777 people
- City population
- 3,226,434
- Metro
- Houston-The Woodlands-Sugar Land, TX
- Population (ZIP)
- 30,198
- Household income
- $66,510
- Rent vs Own
- Severe rent burden
- 562.0
Population outlook (Fort Bend County) Hauer SSP2
- Today (2025)
- 1,004,526 people
- By 2030
- 1,153,104 · +14.8%
- By 2040
- 1,453,718 · +44.7%
- By 2050
- 1,753,781 · +74.6%
- By 2075
- 2,455,772 · +144.5%
- By 2100
- 2,930,528 · +191.7%
Race, ethnicity, and origin ACS 2023
- Neighborhood character
- Majority Hispanic (54%)
- Race & ethnicity
- Hispanic / Latino 54% Black 41% Two or more races 22% White 3% Native American 2%
- Hispanic origin (detail)
- Mexican 39%
- Common ancestry
- Lithuanian 1% Portuguese 1% Slovak 1%
- Foreign-born
- 26% · Canada
- Languages at home
- 50% English-only · Spanish 49%
Political lean MEDSL · Fort Bend
- 2024 margin
- Toss-up / Even · D 49.5% · R 47.9% · Other 2.6%
- 2008→2024 swing
- +4.0pp toward D · 2008: -2.4pp · 2024: 1.6pp
- All cycles
- 2024: D+1.6 2020: D+10.6 2016: D+6.6 2012: R+6.8 2008: R+2.4
Not yet ingested
- Civics
- —
Market trends
- HPI YoY
- ▼ -182.09%
- Current HPI
- 266.6541
- Rent YoY
- ▲ 1.72%
- Metro
- Houston-The Woodlands-Sugar Land, TX
- State GDP YoY
- ▲ 3.95%
- F500 in state
- 110
Industry mix (Fortune 500 HQ in TX)
| Industry | F500 HQs | Revenue |
|---|---|---|
| Energy | 16 | $1,198B |
|
||
| Technology | 5 | $198B |
|
||
| Engineering / Construction | 4 | $72B |
|
||
| Energy Services | 3 | $60B |
|
||
| Utilities | 3 | $41B |
|
||
| Healthcare | 2 | $330B |
|
||
Price history
+10.1% since first listed17 events — show timeline
- 2026-06-17 Listing Removed — HARMLS
- 2026-06-08 Price Changed $175,000 HARMLS
- 2026-06-08 Listing Removed — HARMLS
- 2026-06-08 Listed $180,000 HARMLS
- 2026-05-15 Listed $185,000 HARMLS
- 2024-06-03 Rental Removed $1,650 HARMLS
- 2024-05-26 Price Changed $1,650 HARMLS
- 2024-05-13 Listed for Rent $1,600 HARMLS
- 2022-12-29 Listing Removed — HARMLS
- 2022-11-24 Listed $215,000 HARMLS
- 2022-09-26 Sold (Public Records) — Public Records
- 2022-09-22 Sold (MLS) — HARMLS
- 2022-09-13 Pending — HARMLS
- 2022-09-08 Sold (Public Records) — Public Records
- 2022-09-07 Listed $159,000 HARMLS
- 2005-03-15 Sold (Public Records) — Public Records
- 1997-10-06 Sold (Public Records) — Public Records
Property tax history
+4.7%/yrLatest (2025): $3,947 · +2.9% YoY. Source: county tax records.
Cash-flow waterfall
monthlySold comps — $/sqft
last 12 mo · ≤1 miLoading sold comps…