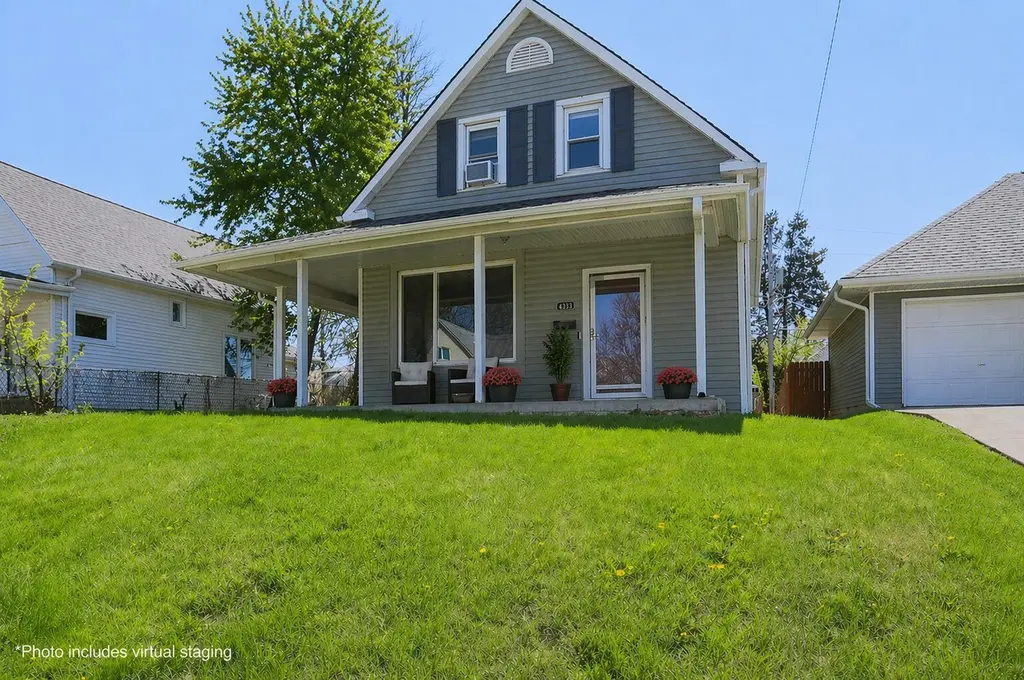
4323 Grant St · Omaha, NE
Flood risk 1/10 · Minimal
- FEMA flood zone
- X (unshaded)
- Chance of flooding over 30 yrs
- 0.0%
- Est. flood insurance / yr
- $473 – $860
Fire risk 1/10 · Minimal
- Est. fire insurance / yr
- $1,161 – $2,155
Heat risk 3/10 · Minor
- Hot days now (above 104°F)
- 7 days/yr
- Hot days in 30 yrs
- 15 days/yr
Wind risk 2/10 · Minimal
- Chance of severe wind over 30 yrs
- —
Air-quality risk 2/10 · Minimal
- Unhealthy air days now
- 0 days/yr
- Unhealthy air days in 30 yrs
- 1 days/yr
Risk factors via First Street. Map © Google.
Why this score? — see what drove the C- grade
The composite is a weighted blend of 9 inputs, each scored 0–100. Each bar is that input's sub-score; the figure is the points it added to the 100-point composite (weight × sub-score).
- Cash flow +14.9/30.0
- Appreciation +10.0/10.0
- ARV discount +7.5/15.0
- DSCR +4.6/10.0
- Livability +4.2/5.0
- 1% rule +3.8/10.0
- Rent growth +3.3/5.0
- Condition / age +2.5/5.0
- Schools +2.1/10.0
$182,900
🖨 Deal sheet (PDF) 📄 Offer letter ✓ Due diligence
Listing remarks MLS
4 bedrooms and 1,400+ square feet with major updates already done--at this low price point is hard to find. HVAC new in 2025, plus siding and most windows in 2022. Bring your own cosmetic updates, but the expensive items are already handled. Large backyard, alley access for potential off-street parking, and plenty of usable space. A practical option for a buyer or investor looking for space and value at this price point. Minutes to Benson and Downtown Omaha.
Key facts
- Alley access
- Near schools
- Large backyard
Tags
Property features AI
Exterior
- Parking: No garage
- Utilities: Public water; Public sewer
- Home design: Single-family residence; One and one-half stories; Built in 1900; Living area about 1,428
- Construction: Brick/mortar foundation; Constructed in 1900
- Exterior features: Porch; Patio; Lot up to 1/4 acre (approximately 0.13 acres); lot dimensions about 50 x 120
Interior
- Kitchen: Includes range and refrigerator
- Bedrooms: Primary bedroom on the main floor; Additional bedrooms on the second floor
- Bathrooms: Two total bathrooms (one full, one half); One main level bathroom
- Heating & cooling: Natural gas heating; Central air conditioning
- Interior features: Range, Refrigerator, Washer, Dryer
- Laundry & utility: Washer and dryer included
Neighborhood map
What this means for you Summary
Snapshot
- This is a 3-bed/1.5-bath other listed at $183k.
Deal economics
- At list price, monthly cash flow is $54 ($647/yr) — positive.
- The deal already cash-flows at list — no discount required.
- To meet the 1% rule (rent ≥ 1% of price), the offer needs to be $161k (11.9% below list).
- Recommended offer: $161k (11.9% below list) — sets the bar for 1% rule.
Location & tenants
- Location reads 84/100 on livability (#7 in NE, #663 nationally) — a professional / high-income tenant draw. Strengths: amenities A+, commute A+, cost of living A+; Watch: crime F.
- Omaha Public Schools (urban): math 20% / reading 28% proficiency, ranked #110 of 111 in NE (top 99%) — low school quality limits family demand, transient renter base, plan for 1-2y turnover; 62% free/reduced lunch — lower-income household profile, screen leases tightly.
- Zoned schools: King Elementary School (math 8% / reading 12%, grade F, #494 of 502 statewide, top 99%, 326 students, 0% FRL); Monroe Middle School (math 8% / reading 15%, grade F, #127 of 128 statewide, top 99%, 769 students, 0% FRL); Benson High School (math 9% / reading 12%, grade F, #257 of 261 statewide, top 98%, 1,570 students, 0% FRL) — zoned schools average 0% FRL vs 62% district-wide (62 pts lower); this property's tenant base skews higher-income than the district average.
- Zoned-school proficiency averages 11% at this address vs 24% district-wide (-13 pts) — the specific schools serving this property underperform the Omaha Public Schools average; the district grade overstates school quality for this exact location.
- Market conditions: Rents rising (+3.2%/yr); 140 active listings in the ZIP; 40 comparable units currently listed for rent nearby; rentals at typical pace (median 25d on market — plan ~3-4 weeks tenant-placement turnaround); lower-income renter base — watch delinquency; 4,539 units permitted in Douglas County in 2024 (2,583 in 5+ unit buildings).
Forward outlook
- In year one you build about $20k of equity ($1k loan paydown + $18k appreciation (10.0% local appreciation)).
- Douglas County population projected at +28% by 2050 — long-run rental-demand tailwind backs the buy-and-hold thesis.
- At projected returns (10.0% appreciation + 3.2% rent growth), your $51k cash investment doubles in ~3 years — after that, you're playing with house money.
- By year 2, paydown + projected appreciation supports a ~$31k cash-out refi (75% LTV) — recoverable capital for the next deal without selling this one.
Negotiation context
- It's been on market 59 days — a 3% lower offer ($177k) is reasonable based on typical stale-listing flexibility.
- 9 sale attempts since 11y ago with the ask held roughly flat each time — persistent listings suggest the price (not the market) is what's stuck; bring a comps-based counter.
- Current owner paid $130k; 41% above their basis — modest negotiation headroom, anchor on the comps not their cost.
Risks & watch-outs
- Watch-outs: built in 1900 — expect roof / HVAC / electrical / plumbing capex.
Questions for the listing agent
- It's been on market 59 days. Have you received any prior offers? Is the seller open to a 12% concession, seller financing, or rate buy-down credit?
- Built in 1900 — when were the roof, HVAC, electrical panel, plumbing, and water heater last replaced?
- Is there a deadline driving the sale (1031 exchange, divorce, estate, relocation)? That informs how much negotiation room exists.
- Crime grade is F in this area — have there been break-ins, vandalism, or insurance claims at this property in the last 3 years? What carrier currently insures it and at what premium?
- What's the average days-on-market for RENTAL listings here right now (not sales)? A rising rental-DOM trend means longer vacancies and softer asking-rent achievability than the comps imply.
- What's the recent tenant-quality profile in this submarket — average credit score on applications, eviction rate, late-payment / NSF rate, and stable-employment percentage? A property-management company in the area should have these aggregated.
- How much new for-sale + rental construction is in the pipeline within 1–3 miles? Heavy new supply typically softens prices + rents 12–24 months out; constrained supply supports both.
Investment metrics
- 1% rule
- 0.88% ✗
- Cap rate
- 6.65%
- Cash-on-cash
- 1.26%
- DSCR
- 1.06
- GRM
- 9.5
CMA / ARV
No comps found within radius.
Projected returns pro-forma
10.0% appreciation · 3.22% rent growth · sell at horizon
- IRR
- 25.3%
- Equity multiple
- 3.02×
- Total profit
- $103,401
- Equity at exit
- $164,771
- IRR
- 22.3%
- Equity multiple
- 6.91×
- Total profit
- $302,525
- Equity at exit
- $355,334
Cash invested: $51,212 (down + closing). Projections, not guarantees.
Landlord ↔ Tenant lean methodology
- Overall (STATE)
- 83 Strongly Landlord-Friendly
- State Nebraska
- 83 Strongly Landlord-Friendly · R+13
- County
- — inherits STATE
- City
- — inherits STATE
ZIP-level market 68111
- Home prices YoY
- 4.0%
- Rents YoY
- 3.2%
- Active inventory
- 140
- Price-to-rent
- 9.5×
Monthly cashflow live
- Estimated rent
- $1,612 high interval (Pro) →
- Mortgage (P&I)
- −$959
- Tax from tax record
- −$184 /mo · $2,210/yr
- Insurance
- −$76
- HOA
- −$0
- Vacancy / Maint / Mgmt
- −$339
- Net cashflow
- $54
Break-even live
Sensitivity live
| Price | -10% $157 | -5% $106 | +0% $54 | +5% $2 | +10% $-50 |
|---|---|---|---|---|---|
| Rent | -10% $-73 | -5% $-10 | +0% $54 | +5% $118 | +10% $181 |
| Rate | -1.0pp $146 | -0.5pp $100 | base $54 | +0.5pp $7 | +1.0pp $-42 |
UW: 25.0% down · 7.5% · 30yr · 1.5% tax · 5.0% vac · 8.0% maint · 8.0% mgmt
Financing live
Cash to close
- Down payment
- $45,725
- Closing costs
- $5,487
- Reserves months
- —
- Total cash needed
- —
Loan-product check · same deal, 3 products live
Conventional
25% down · 7.5% · 30yr
- Down + closing
- —
- Monthly P&I
- —
- Monthly cashflow
- —
- DSCR
- —
- Eligible?
- —
Personal DTI + credit; lowest rate.
DSCR
20% down · 8.5% · 30yr
- Down + closing
- —
- Monthly P&I
- —
- Monthly cashflow
- —
- DSCR
- —
- Eligible?
- —
No personal income docs; deal must DSCR.
Hard money
10% down · 12.0% · 12mo
- Down + closing
- —
- Monthly P&I
- —
- Monthly cashflow
- —
- DSCR
- —
- Eligible?
- —
Short-term bridge; refi at stabilization.
Rent comps 40 comps
| Address | Beds | Baths | Sqft | Rent | $/sqft | DOM | Units | Dist |
|---|---|---|---|---|---|---|---|---|
| 4276 Binney St Omaha, NE | 4.0 | 1.0 | 1358 | $1,495 | $1.10 | 45d | 1 | 0.38mi |
| 4874 Maple St Omaha, NE | 3.0 | 1.0 | 1098 | $1,545 | $1.41 | 45d | 1 | 0.58mi |
| 3002 N 48th Ave Omaha, NE | 4.0 | 2.0 | 1205 | $1,550 | $1.29 | 25d | 1 | 0.59mi |
| 2914 N 49th Ave Omaha, NE | 3.0 | 1.0 | 1375 | $1,615 | $1.17 | 25d | 1 | 0.66mi |
| 1306 N 48th Ave Unit 1313258 Omaha, NE | 2.0 | 1.0 | 994 | $875 | $0.88 | 4d | 1 | 0.72mi |
| 3502 Lake St Omaha, NE | 2.0 | 1.0 | 974 | $995 | $1.02 | 4d | 1 | 0.73mi |
| 3323 N 40th St Omaha, NE | 2.0 | 1.0 | 1000 | $1,575 | $1.57 | 4d | 1 | 0.74mi |
| 3508 N 47th Ave Omaha, NE | 3.0 | 1.0 | 1425 | $1,600 | $1.12 | 20d | 1 | 0.80mi |
| 3535 N 45th Ave Omaha, NE | 3.0 | 1.0 | 1325 | $1,800 | $1.36 | 45d | 1 | 0.82mi |
| 1112 N 50th Ave Omaha, NE | 2.0 | 1.0 | 1200 | $1,450 | $1.21 | 16d | 1 | 0.85mi |
| 4201 Cuming St Omaha, NE | 2.0 | 1.0 | 1272 | $1,350 | $1.06 | 4d | 1 | 0.86mi |
| 915 N 48th Ave Apt 15 Omaha, NE | 2.0 | 1.0 | 950 | $990 | $1.04 | 45d | 1 | 0.86mi |
| 3430 Seward St Omaha, NE | 3.0 | 1.0 | 1371 | $1,695 | $1.24 | 16d | 1 | 0.88mi |
| 828 N 41st Ave Omaha, NE | 2.0 | 1.0 | 1264 | $1,700 | $1.34 | 16d | 1 | 0.89mi |
| 1004 Glenwood Ave Unit 2 Omaha, NE | 3.0 | 1.5 | 1000 | $1,500 | $1.50 | 4d | 1 | 0.92mi |
| 3314 Franklin St Omaha, NE | 4.0 | 2.0 | 1635 | $1,600 | $0.98 | 45d | 1 | 0.94mi |
| 3808 N 48th St Omaha, NE | 3.0 | 2.0 | 1400 | $2,000 | $1.43 | 4d | 1 | 1.01mi |
| 4806 Webster St Omaha, NE | 3.0 | 2.5 | 1589 | $2,295 | $1.44 | 4d | 1 | 1.02mi |
| 4824 Webster St Unit 4824/4824 Omaha, NE | 4.0 | 1.0 | 1317 | $1,050 | $0.80 | 45d | 1 | 1.05mi |
| 5119 Pratt St Omaha, NE | 3.0 | 1.0 | 1008 | $1,900 | $1.88 | 45d | 1 | 1.13mi |
| 4903 Underwood Ave Unit 11 Omaha, NE | 2.0 | 1.0 | 950 | $1,300 | $1.37 | 45d | 1 | 1.16mi |
| 5633 Parker St Omaha, NE | 3.0 | 1.5 | 1200 | $1,695 | $1.41 | 45d | 1 | 1.19mi |
| 5610 Seward St Omaha, NE | 4.0 | 2.0 | 1682 | $2,200 | $1.31 | 45d | 1 | 1.19mi |
| 4918 California St Omaha, NE | 3.0 | 1.0 | 1369 | $1,695 | $1.24 | 25d | 1 | 1.21mi |
| 1407 N 31st St Omaha, NE | 2.0 | 1.0 | 1040 | $1,395 | $1.34 | 4d | 1 | 1.21mi |
| 3204 N 56th St Omaha, NE | 3.0 | 2.0 | 1800 | $1,700 | $0.94 | 12d | 1 | 1.22mi |
| 5016 California St #12 Omaha, NE | 2.0 | 2.0 | 1084 | $1,600 | $1.48 | 25d | 1 | 1.27mi |
| 406 N 49th St Unit 5 Omaha, NE | 2.0 | 2.0 | 1000 | $1,199 | $1.20 | 25d | 1 | 1.30mi |
| 4817 Chicago St Unit 11 Omaha, NE | 2.0 | 1.0 | 1250 | $1,195 | $0.96 | 45d | 1 | 1.31mi |
| 4852 Boyd St Omaha, NE | 2.0 | 2.0 | 912 | $1,500 | $1.64 | 45d | 1 | 1.32mi |
| 4903 Chicago St Omaha, NE | 1.0–2.0 | 1.0–2.0 | 1100 | $1,250 | $1.14 | 22d | 1 | 1.33mi |
| 303 N 38th St Omaha, NE | 4.0 | 1.5 | 1472 | $1,995 | $1.36 | 25d | 1 | 1.36mi |
| 140 N 41st St Omaha, NE | 3.0 | 2.5 | 1640 | $2,495 | $1.52 | 45d | 1 | 1.36mi |
| 2817 N 60th St Unit 2821/02 Omaha, NE | 3.0 | 1.0 | 1188 | $1,045 | $0.88 | 25d | 1 | 1.36mi |
| 201 N 46th St Omaha, NE | 2.0 | 1.0–2.0 | 825 | $1,895 | $2.30 | 4d | 40 | 1.37mi |
| 2817 N 60th St Unit 2817/02 Omaha, NE | 3.0 | 1.0 | 1188 | $1,500 | $1.26 | 4d | 1 | 1.37mi |
| 120 N 40th St Omaha, NE | 3.0 | 1.0 | 1264 | $1,745 | $1.38 | 25d | 1 | 1.38mi |
| 120 N 39th St Omaha, NE | 2.0 | 1.0–2.0 | 808 | $2,375 | $2.94 | 4d | 46 | 1.44mi |
| 5833 Lafayette Ave Unit 5833 Omaha, NE | 2.0 | 1.0 | 900 | $1,295 | $1.44 | 25d | 1 | 1.45mi |
| 4647 Dodge St Omaha, NE | 2.0 | 1.0–2.0 | 775 | $2,850 | $3.68 | 25d | 32 | 1.45mi |
Listing history 40 events
-
2026-06-21days on market $182,900 Active 59 DOM
-
2026-06-18days on market $182,900 Active 56 DOM
-
2026-06-17days on market $182,900 Active 55 DOM
-
2026-06-16days on market $182,900 Active 54 DOM
-
2026-06-15days on market $182,900 Active 53 DOM
-
2026-06-13days on market $182,900 Active 51 DOM
-
2026-06-10days on market $182,900 Active 48 DOM
-
2026-06-09days on market $182,900 Active 47 DOM
-
2026-06-08days on market $182,900 Active 46 DOM
-
2026-06-07days on market $182,900 Active 45 DOM
-
2026-06-03days on market $182,900 Active 41 DOM
-
2026-06-03days on market $182,900 Active 40 DOM
-
2026-06-01days on market $182,900 Active 39 DOM
-
2026-06-01days on market $182,900 Active 38 DOM
-
2026-04-23$182,900 Active 463-char remark
Show marketing remark (463 chars)
4 bedrooms and 1,400+ square feet with major updates already done--at this low price point is hard to find. HVAC new in 2025, plus siding and most windows in 2022. Bring your own cosmetic updates, but the expensive items are already handled. Large backyard, alley access for potential off-street parking, and plenty of usable space. A practical option for a buyer or investor looking for space and value at this price point. Minutes to Benson and Downtown Omaha.
-
2026-04-23$182,900 New 477-char remark
Show marketing remark (463 chars)
4 bedrooms and 1,400+ square feet with major updates already done--at this low price point is hard to find. HVAC new in 2025, plus siding and most windows in 2022. Bring your own cosmetic updates, but the expensive items are already handled. Large backyard, alley access for potential off-street parking, and plenty of usable space. A practical option for a buyer or investor looking for space and value at this price point. Minutes to Benson and Downtown Omaha.
-
2026-04-23historical
Show marketing remark (463 chars)
4 bedrooms and 1,400+ square feet with major updates already done--at this low price point is hard to find. HVAC new in 2025, plus siding and most windows in 2022. Bring your own cosmetic updates, but the expensive items are already handled. Large backyard, alley access for potential off-street parking, and plenty of usable space. A practical option for a buyer or investor looking for space and value at this price point. Minutes to Benson and Downtown Omaha.
-
2026-04-08price $184,900
-
2026-04-08price $184,900
-
2026-04-02price $189,900
-
2026-04-02price $189,900
-
2026-03-27$194,900 New
-
2026-03-27$194,900 Active
-
2021-04-29soldstatus $130,000
-
2021-04-28soldstatus $130,000 Sold
-
2021-03-19status Pending
-
2021-02-10$139,000 Active - New
-
2017-07-21soldstatus $38,500 Sold
-
2017-07-13status Pending
-
2017-07-07$40,000 Active - New
-
2017-07-07historical
-
2017-07-01price $40,000
-
2017-06-01price $49,950
-
2017-05-10$55,000 Active - New
-
2015-11-06status Pending
-
2015-11-02historical
-
2015-10-22$37,500 Active - New
-
2015-10-06historical
-
2015-07-08$37,500 Active - New
-
2000-07-21soldstatus $165,000
ⓘ Source: listings_history table (triggers on properties + properties_extension) + one-shot
backfill from property_details.listing_events for pre-trigger history.
Tax reassessment forecast NE · Resets to sale price
- Current annual tax
- $2,210 · $184/mo
- Projected year-2 tax
- $3,164 · $264/mo
- Expected delta
- +$954/yr (+$79/mo · 43.1%)
ⓘ Screening estimate from a state-policy table — verify with the county assessor before closing.
Climate risk First Street
- Flood 1/10 Low FEMA zone X (unshaded) · 0% chance over 30 yrs
- Wildfire 1/10 Low
- Heat 3/10 Moderate 7 d/yr ≥104°F today · 15 d/yr by 30 yrs out
- Wind 2/10 Low
- Air quality 2/10 Low 0 unhealthy d/yr today · 1 by 30 yrs out
Nearby sold comps map
Loading sold comps map…
Walkable amenities ~0.75 mi
Loading nearby amenities…
Taxation est. · year 1
- Rental income
- $19,344
- − Mortgage interest
- −$10,245
- − Property taxes
- −$2,210
- − Insurance
- −$914
- − Repairs & maintenance
- −$1,548
- − Management
- −$1,548
- − Depreciation
- −$5,321
- Taxable loss
- −$2,442
- Est. tax savings @ 24.0%
- +$586
- After-tax cash flow
- $1,233/yr
For passive investors: Depreciation is non-cash, so a rental often shows a tax loss while cash-flowing — sheltering income. Rental losses are passive: they offset passive income freely, and up to $25,000/yr can offset ordinary (W-2) income if you actively participate and your MAGI is under $100k (phasing out to $0 by $150k); unused losses carry forward. On sale, claimed depreciation is recaptured at up to 25%, and gains may owe capital-gains tax (a 1031 exchange can defer both). Figures are a year-1 estimate at your 24.0% rate — not tax advice; consult a CPA.
Schools (NCES district)
- District
- Omaha Public Schools
- NCES district ID
- 3174820
- Math proficiency
- 20% ▼ -10.00%
- Reading proficiency
- 28% ▼ -5.00%
- Median HH income
- $46,039
- Composite
- 20.83/100
- National rank
- #8502
- State rank
- #110 of 111 in NE
Livability — Omaha
- Score
- 84/100
- State rank
- #7
- US rank
- #663
Category grades
Schools grade is shown separately in the Schools card above.
Census & demographics
- Census place
- Omaha, NE
- County
- Douglas County · 538,646 people
- City population
- 552,986
- Metro
- Omaha-Council Bluffs, NE-IA
- Population (ZIP)
- 24,210
- Household income
- $42,185
- Rent vs Own
- Severe rent burden
- 1913.0
Population outlook (Douglas County) Hauer SSP2
- Today (2025)
- 625,245 people
- By 2030
- 661,613 · +5.8%
- By 2040
- 732,395 · +17.1%
- By 2050
- 801,988 · +28.3%
- By 2075
- 968,637 · +54.9%
- By 2100
- 1,101,871 · +76.2%
Race, ethnicity, and origin ACS 2023
- Neighborhood character
- Diverse neighborhood (Simpson 0.65)
- Race & ethnicity
- Black 52% Hispanic / Latino 21% White 17% Two or more races 15% Asian 3% Native American 1%
- Hispanic origin (detail)
- Mexican 14%
- Common ancestry
- Ukrainian 3% Lithuanian 0%
- Foreign-born
- 14% · Canada, Philippines
- Languages at home
- 75% English-only · Spanish 16% Other Asian/Pacific 3% French/Haitian/Cajun 1%
Political lean MEDSL · Douglas
- 2024 margin
- D (+10.2) · D 54.4% · R 44.2% · Other 1.4%
- 2008→2024 swing
- +5.5pp toward D · 2008: 4.6pp · 2024: 10.2pp
- All cycles
- 2024: D+10.2 2020: D+11.3 2016: D+1.4 2012: R+4.3 2008: D+4.6
Not yet ingested
- Civics
- —
Market trends
- HPI YoY
- ▲ 13.82%
- Current HPI
- 358.7174
- Rent YoY
- ▲ 3.22%
- Metro
- Omaha-Council Bluffs, NE-IA
- State GDP YoY
- ▲ 0.68%
- F500 in state
- 2
Industry mix (Fortune 500 HQ in NE)
| Industry | F500 HQs | Revenue |
|---|---|---|
| Conglomerate | 1 | $371B |
|
||
Price history
+10.8% since first listed26 events — show timeline
- 2026-04-23 Listed $182,900 SWIAR
- 2026-04-23 Listing Removed — GPRMLS
- 2026-04-23 Listed $182,900 GPRMLS
- 2026-04-08 Price Changed $184,900 SWIAR
- 2026-04-08 Price Changed $184,900 GPRMLS
- 2026-04-02 Price Changed $189,900 SWIAR
- 2026-04-02 Price Changed $189,900 GPRMLS
- 2026-03-27 Listed $194,900 SWIAR
- 2026-03-27 Listed $194,900 GPRMLS
- 2021-04-29 Sold (Public Records) $130,000 Public Records
- 2021-04-28 Sold (MLS) $130,000 GPRMLS
- 2021-03-19 Pending — GPRMLS
- 2021-02-10 Listed $139,000 GPRMLS
- 2017-07-21 Sold (MLS) $38,500 GPRMLS
- 2017-07-13 Pending — GPRMLS
- 2017-07-07 Listed $40,000 GPRMLS
- 2017-07-07 Listing Removed — GPRMLS
- 2017-07-01 Price Changed $40,000 GPRMLS
- 2017-06-01 Price Changed $49,950 GPRMLS
- 2017-05-10 Listed $55,000 GPRMLS
- 2015-11-06 Pending — GPRMLS
- 2015-11-02 Listing Removed — GPRMLS
- 2015-10-22 Listed $37,500 GPRMLS
- 2015-10-06 Listing Removed — GPRMLS
- 2015-07-08 Listed $37,500 GPRMLS
- 2000-07-21 Sold (Public Records) $165,000 Public Records
Property tax history
+6.2%/yrLatest (2025): $2,210 · -0.8% YoY. Source: county tax records.
Cash-flow waterfall
monthlySold comps — $/sqft
last 12 mo · ≤1 miLoading sold comps…