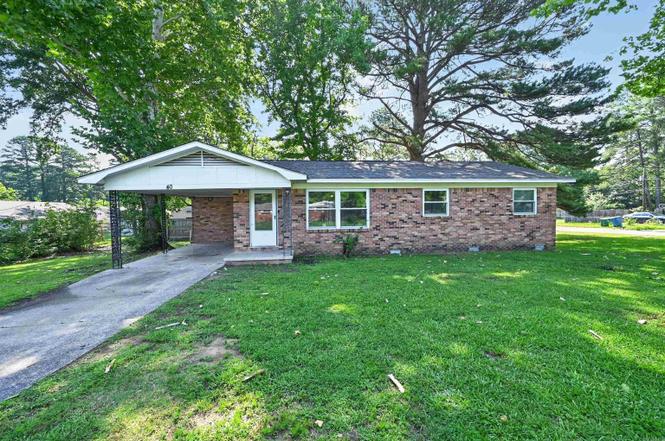
40 Regency Cir Cir · Little Rock, AR
Flood risk 1/10 · Minimal
- FEMA flood zone
- X (unshaded)
- Chance of flooding over 30 yrs
- 0.0%
- Est. flood insurance / yr
- $507 – $1,088
Fire risk 3/10 · Minor
- Est. fire insurance / yr
- $1,499 – $2,785
Heat risk 6/10 · Moderate
- Hot days now (above 111°F)
- 7 days/yr
- Hot days in 30 yrs
- 19 days/yr
Wind risk 4/10 · Minor
- Chance of severe wind over 30 yrs
- 13.0%
Air-quality risk 2/10 · Minimal
- Unhealthy air days now
- 1 days/yr
- Unhealthy air days in 30 yrs
- 1 days/yr
Risk factors via First Street. Map © Google.
Why this score? — see what drove the C+ grade
The composite is a weighted blend of 9 inputs, each scored 0–100. Each bar is that input's sub-score; the figure is the points it added to the 100-point composite (weight × sub-score).
- Cash flow +25.3/30.0
- ARV discount +12.5/15.0
- DSCR +8.3/10.0
- 1% rule +6.1/10.0
- Rent growth +3.7/5.0
- Livability +3.7/5.0
- Condition / age +2.5/5.0
- Schools +2.1/10.0
- Appreciation +0.0/10.0
$104,900
🖨 Deal sheet 📄 Offer letter ✓ Due diligence
Listing remarks MLS
Investment property or First time home buyer! Cute 3 bedroom 2 full bath. Rent $850 a month. DO NOT CONTACT TENANT
Key facts
- Level backyard
- Breakfast bar
- Quick access to i-30
Tags
Property features AI
Finance
- Other:
- Financial info:
- HOA & community:
Exterior
- Parking: Carport
- Security:
- Utilities: Public water; Cable TV available
- Home design:
- Construction: Composition roof; Slab foundation
- Exterior features: Brick exterior; Level lot; Paved road access; No area amenities listed
Interior
- Kitchen: Other kitchen equipment (see remarks)
- Bedrooms:
- Flooring: Carpet
- Bathrooms: 2 full bathrooms
- Heating & cooling: Central electric heating; Central electric cooling
- Interior features: Carpet floors; Kitchen equipment: Other (see remarks)
- Laundry & utility:
Neighborhood map
What this means for you Summary
Snapshot
- This is a 3-bed/2.0-bath single-family listed at $105k.
Deal economics
- At list price, monthly cash flow is $238 ($3k/yr) — positive.
- The deal already cash-flows at list — no discount required.
- Meets the 1% rule at list price ($1k rent vs $105k).
- Cap rate 9.0% vs local median 4.1% in Little Rock — top-decile yield for the area; either an underpriced asset or a hidden risk that comps aren't pricing in. Stress-test before assuming the spread holds.
Location & tenants
- Location reads 73/100 on livability (#22 in AR) — a middle-class / working-renter tenant base. Strengths: commute A+, cost of living A+, housing A+; Watch: crime F.
- Little Rock School District (urban): math 23% / reading 26% proficiency, ranked #183 of 238 in AR (top 77%) — low school quality limits family demand, transient renter base, plan for 1-2y turnover; 69% free/reduced lunch — lower-income household profile, screen leases tightly.
- Market conditions: Rents rising fast (+4.8%/yr); 81 active listings in the ZIP; 18 comparable units currently listed for rent nearby; rentals at typical pace (median 24d on market — plan ~3-4 weeks tenant-placement turnaround); lower-income renter base — watch delinquency; 1,006 units permitted in Pulaski County in 2024 (0 in 5+ unit buildings).
- This rent runs 35% of the median local income ($40k/yr) — at the standard rent-burdened threshold; future hikes will face affordability resistance.
Forward outlook
- Local home prices are declining (-3.0%/yr); year-one equity from $725 of loan paydown is wiped out by about $3k of value loss. Plan a longer hold.
- Pulaski County population projected at +6% by 2050 — modest demand growth; plan on rents tracking national, not racing it.
- At projected returns (-3.0% appreciation + 4.8% rent growth), your $29k cash investment doubles in ~10 years — after that, you're playing with house money.
Negotiation context
- Only 8 days on market — expect competitive offers; lowballing is unlikely to land.
- 2 sale attempts since 5y ago with the ask held roughly flat each time — persistent listings suggest the price (not the market) is what's stuck; bring a comps-based counter.
- Current owner paid $64k; list at $105k implies a 64% gain — meaningful room to come down on a strong offer.
Risks & watch-outs
- Climate carrying-cost: extreme-heat days projected 7→19/yr by 2055 (HVAC capex compounding) — expect insurance premiums to compound above CPI over the hold.
Questions for the listing agent
- Built in 1967 — when were the roof, HVAC, electrical panel, plumbing, and water heater last replaced?
- Is there a deadline driving the sale (1031 exchange, divorce, estate, relocation)? That informs how much negotiation room exists.
- Crime grade is F in this area — have there been break-ins, vandalism, or insurance claims at this property in the last 3 years? What carrier currently insures it and at what premium?
- What's the average days-on-market for RENTAL listings here right now (not sales)? A rising rental-DOM trend means longer vacancies and softer asking-rent achievability than the comps imply.
- What's the recent tenant-quality profile in this submarket — average credit score on applications, eviction rate, late-payment / NSF rate, and stable-employment percentage? A property-management company in the area should have these aggregated.
- How much new for-sale + rental construction is in the pipeline within 1–3 miles? Heavy new supply typically softens prices + rents 12–24 months out; constrained supply supports both.
Investment metrics
- 1% rule
- 1.11% ✓
- Cap rate
- 9.02%
- Cash-on-cash
- 9.73%
- DSCR
- 1.43
- GRM
- 7.5
CMA / ARV
- ARV (on-the-fly)
- $117,936
- Comps found
- 12
Show comp detail 12 sales within ~0.75 mi
| Address | Dist | Beds/Ba | Sqft | Sold | Price | $/sf | Match |
|---|---|---|---|---|---|---|---|
| 6 Regency Cir | 0.03mi | 3/2.0 | 1,134 (0%) | 18mo | $149,000 | $131 | 83 |
| 5606 Southboro Dr | 0.34mi | 3/1.5 | 1,142 (+1%) | 3mo | $76,500 | $67 | 79 |
| 9202 Malabri Dr | 0.29mi | 3/1.5 | 1,091 (-4%) | 7mo | $62,900 | $58 | 72 |
| 5419 Southboro Dr | 0.28mi | 3/2.0 | 1,120 (-1%) | 16mo | $56,000 | $50 | 72 |
| 4410 Arehart Dr | 0.42mi | 3/1.5 | 1,102 (-3%) | 8mo | $149,900 | $136 | 67 |
| 9220 Reck Rd | 0.37mi | 4/1.5 (+1) | 1,200 (+6%) | 7mo | $125,000 | $104 | 60 |
| 8616 Dreher Ln | 0.51mi | 3/2.0 | 1,233 (+9%) | 3mo | $156,000 | $127 | 60 |
| 10200 Geyer Springs Rd | 0.74mi | 3/2.0 | 1,229 (+8%) | 2mo | $144,000 | $117 | 50 |
| 8301 Stanton Rd | 0.73mi | 3/1.0 | 1,080 (-5%) | 6mo | $66,000 | $61 | 49 |
| 5713 Liberty Cv | 0.54mi | 2/1.0 (-1) | 1,198 (+6%) | 9mo | $88,089 | $74 | 49 |
| 8600 Dreher | 0.52mi | 2/1.0 (-1) | 983 (-13%) | 4mo | $110,000 | $112 | 41 |
| 3804 Arapaho Trl | 0.73mi | 3/1.0 | 1,012 (-11%) | 12mo | $87,500 | $86 | 34 |
Match score weights: distance 35% · size 25% · config 20% · recency 20%. Top-matched comps best support the ARV.
Projected returns pro-forma
-3.0% appreciation · 4.78% rent growth · sell at horizon
- IRR
- 0.3%
- Equity multiple
- 1.01×
- Total profit
- $285
- Equity at exit
- $15,641
- IRR
- 11.6%
- Equity multiple
- 1.98×
- Total profit
- $28,773
- Equity at exit
- $9,070
Cash invested: $29,372 (down + closing). Projections, not guarantees.
Landlord ↔ Tenant lean methodology
- Overall (STATE)
- 92 Strongly Landlord-Friendly
- State Arkansas
- 92 Strongly Landlord-Friendly · R+14
- County
- — inherits STATE
- City
- — inherits STATE
ZIP-level market 72209
- Rents YoY
- 4.8%
- Active inventory
- 81
- Price-to-rent
- 7.5×
Monthly cashflow live
- Estimated rent
- $1,164 high interval (Pro) →
- Mortgage (P&I)
- −$550
- Tax from tax record
- −$87 /mo · $1,047/yr
- Insurance
- −$44
- HOA
- −$0
- Vacancy / Maint / Mgmt
- −$244
- Net cashflow
- $238
Break-even live
UW: 25.0% down · 7.5% · 30yr · 1.5% tax · 5.0% vac · 8.0% maint · 8.0% mgmt
Financing live
Cash to close
- Down payment
- $26,225
- Closing costs
- $3,147
- Reserves months
- —
- Total cash needed
- —
Loan-product check · same deal, 3 products live
Conventional
25% down · 7.5% · 30yr
- Down + closing
- —
- Monthly P&I
- —
- Monthly cashflow
- —
- DSCR
- —
- Eligible?
- —
Personal DTI + credit; lowest rate.
DSCR
20% down · 8.5% · 30yr
- Down + closing
- —
- Monthly P&I
- —
- Monthly cashflow
- —
- DSCR
- —
- Eligible?
- —
No personal income docs; deal must DSCR.
Hard money
10% down · 12.0% · 12mo
- Down + closing
- —
- Monthly P&I
- —
- Monthly cashflow
- —
- DSCR
- —
- Eligible?
- —
Short-term bridge; refi at stabilization.
Rent comps 18 comps
| Address | Beds | Baths | Sqft | Rent | $/sqft | DOM | Units | Dist |
|---|---|---|---|---|---|---|---|---|
| 3 Regency Cir Little Rock, AR | 3.0 | 1.5 | 1347 | $1,175 | $0.87 | 14d | 1 | 0.08mi |
| 5306 McClellan Dr Little Rock, AR | 3.0 | 1.5 | 1044 | $1,215 | $1.16 | 44d | 1 | 0.20mi |
| 5301 Southboro Ct Little Rock, AR | 2.0 | 1.5 | 992 | $750 | $0.76 | 23d | 1 | 0.21mi |
| 9220 Ricky Ln Little Rock, AR | 3.0 | 1.0 | 954 | $1,245 | $1.31 | 14d | 1 | 0.35mi |
| 5703 Valley Dr Unit B Little Rock, AR | 2.0 | 1.0 | 860 | $1,095 | $1.27 | 44d | 1 | 0.40mi |
| 9115 Ricky Ln Little Rock, AR | 3.0 | 1.5 | 1160 | $1,100 | $0.95 | 14d | 1 | 0.42mi |
| 5806 Southwick Dr Little Rock, AR | 3.0 | 1.5 | 1116 | $1,295 | $1.16 | 14d | 1 | 0.46mi |
| 4013 Wooddale Dr Little Rock, AR | 3.0 | 2.0 | 1442 | $1,395 | $0.97 | 21d | 1 | 0.57mi |
| 6111 Queensboro Dr Unit D Little Rock, AR | 3.0 | 1.5 | 1100 | $825 | $0.75 | 23d | 1 | 0.64mi |
| 3717 Pine Cone Dr Little Rock, AR | 4.0 | 1.5 | 1357 | $1,195 | $0.88 | 44d | 1 | 0.77mi |
| 10112 Palo Alto Dr Little Rock, AR | 3.0 | 2.0 | 1062 | $1,095 | $1.03 | 44d | 1 | 0.81mi |
| 5709 Windamere Dr Little Rock, AR | 3.0 | 1.5 | 1213 | $1,075 | $0.89 | 23d | 1 | 0.86mi |
| 5701 Dreher Ln Unit 100 Little Rock, AR | 2.0 | 1.5 | 900 | $905 | $1.01 | 23d | 1 | 0.92mi |
| 5701 Dreher Ln Unit 11 Little Rock, AR | 2.0 | 1.5 | 900 | $905 | $1.01 | 14d | 1 | 0.92mi |
| 5701 Dreher Ln Unit 30 Little Rock, AR | 2.0 | 1.5 | 900 | $905 | $1.01 | 44d | 1 | 0.92mi |
| 6921 Knollwood Rd Little Rock, AR | 3.0 | 2.0 | 1196 | $1,195 | $1.00 | 14d | 1 | 1.19mi |
| 7124 Twin Oaks Rd Little Rock, AR | 3.0 | 1.0 | 912 | $975 | $1.07 | 23d | 1 | 1.31mi |
| 7305 E Wakefield Dr Little Rock, AR | 3.0 | 1.5 | 1056 | $1,150 | $1.09 | 44d | 1 | 1.48mi |
Listing history 7 events
-
2026-06-18days on market $104,900 Active 8 DOM
-
2026-06-17statusdays on market $104,900 Active 7 DOM
-
2026-06-16days on market $104,900 New Listing 6 DOM
-
2026-06-15days on market $104,900 New Listing 5 DOM
-
2026-06-14days on market $104,900 New Listing 3 DOM
-
2026-06-13remarks 699-char remark
-
2026-06-13$104,900 New Listing 2 DOM
ⓘ Source: listings_history table (triggers on properties + properties_extension) + one-shot
backfill from property_details.listing_events for pre-trigger history.
Tax reassessment forecast AR · Resets to sale price
- Current annual tax
- $1,047 · $87/mo
- Projected year-2 tax
- $1,047 · $87/mo
- Expected delta
- $0/yr ($0/mo · 0.0%)
ⓘ Screening estimate from a state-policy table — verify with the county assessor before closing.
Climate risk First Street
- Flood 1/10 Low FEMA zone X (unshaded) · 0% chance over 30 yrs
- Wildfire 3/10 Moderate
- Heat 6/10 Major 7 d/yr ≥111°F today · 19 d/yr by 30 yrs out
- Wind 4/10 Moderate 13% chance of damaging wind over 30 yrs
- Air quality 2/10 Low 1 unhealthy d/yr today · 1 by 30 yrs out
Nearby sold comps map
Loading sold comps map…
Walkable amenities ~0.75 mi
Loading nearby amenities…
Taxation est. · year 1
- Rental income
- $13,964
- − Mortgage interest
- −$5,876
- − Property taxes
- −$1,047
- − Insurance
- −$524
- − Repairs & maintenance
- −$1,117
- − Management
- −$1,117
- − Depreciation
- −$3,052
- Taxable income
- $1,230
- Est. tax owed @ 24.0%
- −$295
- After-tax cash flow
- $2,563/yr
For passive investors: Depreciation is non-cash, so a rental often shows a tax loss while cash-flowing — sheltering income. Rental losses are passive: they offset passive income freely, and up to $25,000/yr can offset ordinary (W-2) income if you actively participate and your MAGI is under $100k (phasing out to $0 by $150k); unused losses carry forward. On sale, claimed depreciation is recaptured at up to 25%, and gains may owe capital-gains tax (a 1031 exchange can defer both). Figures are a year-1 estimate at your 24.0% rate — not tax advice; consult a CPA.
Schools (NCES district)
- District
- Little Rock School District
- NCES district ID
- 0509000
- Math proficiency
- 23% ▼ -12.00%
- Reading proficiency
- 26% ▼ -8.00%
- Median HH income
- $43,346
- Composite
- 21.0/100
- National rank
- #8457
- State rank
- #183 of 238 in AR
Livability — Little Rock
- Score
- 73/100
- State rank
- #22
- US rank
- #5295
Category grades
Schools grade is shown separately in the Schools card above.
Census & demographics
- Census place
- Little Rock, AR
- County
- Pulaski County · 372,764 people
- City population
- 218,896
- Metro
- Little Rock-North Little Rock-Conway, AR
- Population (ZIP)
- 31,607
- Household income
- $40,231
- Rent vs Own
- Severe rent burden
- 1510.0
Population outlook (Pulaski County) Hauer SSP2
- Today (2025)
- 415,378 people
- By 2030
- 423,720 · +2.0%
- By 2040
- 435,182 · +4.8%
- By 2050
- 440,904 · +6.1%
- By 2075
- 445,521 · +7.3%
- By 2100
- 419,173 · +0.9%
Race, ethnicity, and origin ACS 2023
- Neighborhood character
- Diverse neighborhood (Simpson 0.56)
- Race & ethnicity
- Black 57% Hispanic / Latino 33% Two or more races 15% White 8%
- Hispanic origin (detail)
- Mexican 21%
- Foreign-born
- 14% · Canada
- Languages at home
- 70% English-only · Spanish 29%
Political lean MEDSL · Pulaski
- 2024 margin
- Strong D (+22.1) · D 59.8% · R 37.7% · Other 2.5%
- 2008→2024 swing
- +10.6pp toward D · 2008: 11.6pp · 2024: 22.1pp
- All cycles
- 2024: D+22.1 2020: D+22.5 2016: D+17.9 2012: D+11.4 2008: D+11.6
Not yet ingested
- Civics
- —
Market trends
- HPI YoY
- ▼ -151.75%
- Current HPI
- 176.4492
- Rent YoY
- ▲ 4.78%
- Metro
- Little Rock-North Little Rock-Conway, AR
- State GDP YoY
- ▲ 3.80%
- F500 in state
- 10
Industry mix (Fortune 500 HQ in AR)
| Industry | F500 HQs | Revenue |
|---|---|---|
| Retail | 1 | $681B |
|
||
| Food / Agriculture | 1 | $53B |
|
||
| Retail / Energy | 1 | $22B |
|
||
| Transportation / Logistics | 1 | $12B |
|
||
| Energy | 1 | $4B |
|
||
Price history
+40.1% since first listed5 events — show timeline
- 2026-06-10 Listed $104,900 CARMLS
- 2021-06-29 Sold (Public Records) $64,000 Public Records
- 2021-06-16 Sold (MLS) $65,666 CARMLS
- 2021-06-03 Listing Removed — CARMLS
- 2021-05-05 Listed $74,900 CARMLS
Property tax history
+2.3%/yrLatest (2025): $1,047 · +0.0% YoY. Source: county tax records.
Cash-flow waterfall
monthlySold comps — $/sqft
last 12 mo · ≤1 miLoading sold comps…