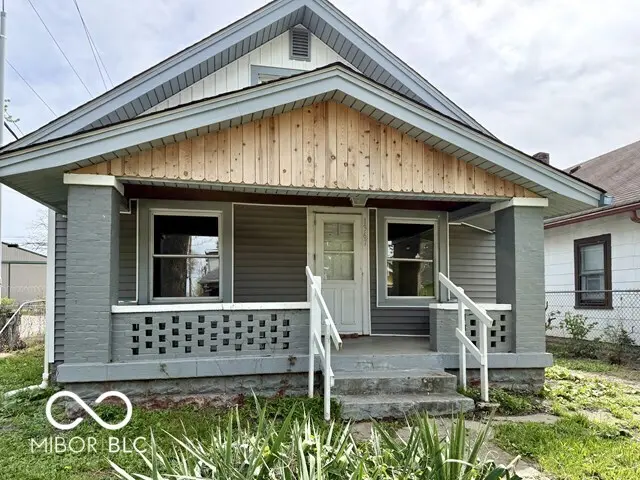
1367 N Kealing Ave · Indianapolis city (balance), IN
Flood risk 1/10 · Minimal
- FEMA flood zone
- X (unshaded)
- Chance of flooding over 30 yrs
- 0.0%
- Est. flood insurance / yr
- $473 – $860
Fire risk 1/10 · Minimal
- Est. fire insurance / yr
- $717 – $1,331
Heat risk 3/10 · Minor
- Hot days now (above 102°F)
- 7 days/yr
- Hot days in 30 yrs
- 19 days/yr
Wind risk 2/10 · Minimal
- Chance of severe wind over 30 yrs
- 0.0%
Air-quality risk 4/10 · Minor
- Unhealthy air days now
- 5 days/yr
- Unhealthy air days in 30 yrs
- 7 days/yr
Risk factors via First Street. Map © Google.
Why this score? — see what drove the B- grade
The composite is a weighted blend of 9 inputs, each scored 0–100. Each bar is that input's sub-score; the figure is the points it added to the 100-point composite (weight × sub-score).
- Cash flow +29.4/30.0
- DSCR +10.0/10.0
- 1% rule +8.2/10.0
- ARV discount +7.5/15.0
- Rent growth +4.3/5.0
- Livability +2.5/5.0
- Condition / age +2.5/5.0
- Schools +1.4/10.0
- Appreciation +0.0/10.0
$74,900
🖨 Deal sheet 📄 Offer letter ✓ Due diligence
Listing remarks MLS
Great starter home/investor property. 2 Bedroom/1 Bath Bungalow with basement. Property needs cosmetics and work- but has loads of potential. Hardwood floors, covered porch, working mechanicals- all utilities operable. Newer roof, soffits & gutters in good condition- Large lot- Property is sold- AS-IS.
Key facts
- Covered front porch
- Hardwood flooring
- Spacious backyard
Tags
Property features AI
Exterior
- Parking: Detached garage (1 car, approximately 280 sq ft)
- Utilities: Public water; Municipal sewer connected; Electricity connected; Natural gas available
- Home design: Single-family residence; One story; Faces west; Property listed as fixer condition
- Construction: Brick and vinyl siding exterior; Block foundation
- Exterior features: Covered porch/patio; Chain link fence; Mature trees and small trees; Curbs and sidewalks; Has a view
Interior
- Kitchen: Kitchen (main level)
- Bedrooms: Two bedrooms on the main level
- Flooring: Hardwood floors
- Bathrooms: One full bathroom (main level)
- Heating & cooling: Forced air heating (natural gas); Central air conditioning
- Interior features: Hardwood floors; Pantry; Utility room
- Laundry & utility: Main level laundry; Basement utility room / storage (unfinished)
Neighborhood map
What this means for you Summary
Snapshot
- This is a 2-bed/1.0-bath single-family listed at $75k.
Deal economics
- At list price, monthly cash flow is $266 ($3k/yr) — positive.
- The deal already cash-flows at list — no discount required.
- Meets the 1% rule at list price ($992 rent vs $75k).
- Recommended offer: $73k (3.0% below list) — sets the bar for market timing.
- Cap rate 10.6% vs local median 4.4% in Indianapolis city (balance) — top-decile yield for the area; either an underpriced asset or a hidden risk that comps aren't pricing in. Stress-test before assuming the spread holds.
Location & tenants
- Location reads: area grade B — affects rentability + tenant quality, not the cash-flow math above.
- Indianapolis Public Schools (urban): math 14% / reading 20% proficiency, ranked #286 of 301 in IN (top 95%) — low school quality limits family demand, transient renter base, plan for 1-2y turnover; 77% free/reduced lunch — lower-income household profile, screen leases tightly.
- Zoned schools: Arsenal Technical High School (math 6% / reading 27%, grade F, #353 of 369 statewide, top 96%, 2,366 students, 74% FRL) — zoned schools at 74% FRL track the district average.
- Market conditions: Rents rising fast (+7.3%/yr); 480 active listings in the ZIP; 40 comparable units currently listed for rent nearby; rentals at typical pace (median 24d on market — plan ~3-4 weeks tenant-placement turnaround); 1,906 units permitted in Marion County in 2024 (621 in 5+ unit buildings).
Forward outlook
- Local home prices are declining (-3.0%/yr); year-one equity from $518 of loan paydown is wiped out by about $2k of value loss. Plan a longer hold.
- Marion County population projected at +18% by 2050 — long-run rental-demand tailwind backs the buy-and-hold thesis.
- At projected returns (-3.0% appreciation + 7.3% rent growth), your $21k cash investment doubles in ~6 years — after that, you're playing with house money.
Negotiation context
- It's been on market 31 days — a 3% lower offer ($73k) is reasonable based on typical stale-listing flexibility.
- 6 sale attempts since 11y ago with the ask held roughly flat each time — persistent listings suggest the price (not the market) is what's stuck; bring a comps-based counter.
- Current owner paid $22k; list at $75k implies a 240% gain — meaningful room to come down on a strong offer.
Risks & watch-outs
- Watch-outs: built in 1914 — expect roof / HVAC / electrical / plumbing capex.
Questions for the listing agent
- It's been on market 31 days. Have you received any prior offers? Is the seller open to a 3% concession, seller financing, or rate buy-down credit?
- Built in 1914 — when were the roof, HVAC, electrical panel, plumbing, and water heater last replaced?
- Is there a deadline driving the sale (1031 exchange, divorce, estate, relocation)? That informs how much negotiation room exists.
- What's the average days-on-market for RENTAL listings here right now (not sales)? A rising rental-DOM trend means longer vacancies and softer asking-rent achievability than the comps imply.
- What's the recent tenant-quality profile in this submarket — average credit score on applications, eviction rate, late-payment / NSF rate, and stable-employment percentage? A property-management company in the area should have these aggregated.
- How much new for-sale + rental construction is in the pipeline within 1–3 miles? Heavy new supply typically softens prices + rents 12–24 months out; constrained supply supports both.
Investment metrics
- 1% rule
- 1.32% ✓
- Cap rate
- 10.56%
- Cash-on-cash
- 15.23%
- DSCR
- 1.68
- GRM
- 6.3
CMA / ARV
- ARV (median comp)
- $171,007
- List price
- $74,900
- Delta
- -56.20%
- Verdict
- UNDERPRICED
- Comps
- 20 within 1.0 mi
Show comp detail 12 sales within ~0.75 mi
| Address | Dist | Beds/Ba | Sqft | Sold | Price | $/sf | Match |
|---|---|---|---|---|---|---|---|
| 1536 N Sherman Dr | 0.12mi | 2/1.0 | 816 (-15%) | 7mo | $55,000 | $67 | 63 |
| 1235 N Grant Ave | 0.33mi | 2/1.0 | 1,056 (+10%) | 8mo | $80,000 | $76 | 61 |
| 1311 N Grant Ave | 0.31mi | 1/1.0 (-1) | 1,008 (+5%) | 16mo | $105,000 | $104 | 59 |
| 1409 N Denny St | 0.18mi | 1/1.0 (-1) | 858 (-11%) | 14mo | $65,000 | $76 | 57 |
| 2818 E 17th St | 0.68mi | 2/2.0 | 1,024 (+7%) | 3mo | $205,000 | $200 | 50 |
| 2049 Houston St | 0.70mi | 3/1.0 (+1) | 912 (-5%) | 7mo | $117,000 | $128 | 48 |
| 2030 Houston St | 0.68mi | 3/2.0 (+1) | 912 (-5%) | 7mo | $130,000 | $143 | 46 |
| 714 N Grant Ave | 0.73mi | 2/1.0 | 1,087 (+13%) | 2mo | $54,000 | $50 | 43 |
| 4218 E 18th St | 0.50mi | 3/1.0 (+1) | 1,080 (+12%) | 10mo | $170,000 | $157 | 42 |
| 2022 N Olney St | 0.61mi | 2/1.0 | 1,092 (+14%) | 13mo | $81,000 | $74 | 37 |
| 3109 E St Joseph St | 0.60mi | 3/2.0 (+1) | 1,078 (+12%) | 10mo | $108,000 | $100 | 34 |
| 4109 East 21st St | 0.73mi | 3/1.0 (+1) | 1,080 (+12%) | 11mo | $85,000 | $79 | 31 |
Match score weights: distance 35% · size 25% · config 20% · recency 20%. Top-matched comps best support the ARV.
Projected returns pro-forma
-3.0% appreciation · 7.31% rent growth · sell at horizon
- IRR
- 10.7%
- Equity multiple
- 1.44×
- Total profit
- $9,320
- Equity at exit
- $11,168
- IRR
- 23.0%
- Equity multiple
- 3.39×
- Total profit
- $50,143
- Equity at exit
- $6,476
Cash invested: $20,972 (down + closing). Projections, not guarantees.
Landlord ↔ Tenant lean methodology
- Overall (STATE)
- 90 Strongly Landlord-Friendly
- State Indiana
- 90 Strongly Landlord-Friendly · R+11
- County
- — inherits STATE
- City
- — inherits STATE
ZIP-level market 46201
- Home prices YoY
- -33.9%
- Rents YoY
- 7.3%
- Active inventory
- 480
- Price-to-rent
- 6.3×
Monthly cashflow live
- Estimated rent
- $992 high interval (Pro) →
- Mortgage (P&I)
- −$393
- Tax est. 1.5%
- −$94 /mo · $1,124/yr
- Insurance
- −$31
- HOA
- −$0
- Vacancy / Maint / Mgmt
- −$208
- Net cashflow
- $266
Break-even live
UW: 25.0% down · 7.5% · 30yr · 1.5% tax · 5.0% vac · 8.0% maint · 8.0% mgmt
Financing live
Cash to close
- Down payment
- $18,725
- Closing costs
- $2,247
- Reserves months
- —
- Total cash needed
- —
Loan-product check · same deal, 3 products live
Conventional
25% down · 7.5% · 30yr
- Down + closing
- —
- Monthly P&I
- —
- Monthly cashflow
- —
- DSCR
- —
- Eligible?
- —
Personal DTI + credit; lowest rate.
DSCR
20% down · 8.5% · 30yr
- Down + closing
- —
- Monthly P&I
- —
- Monthly cashflow
- —
- DSCR
- —
- Eligible?
- —
No personal income docs; deal must DSCR.
Hard money
10% down · 12.0% · 12mo
- Down + closing
- —
- Monthly P&I
- —
- Monthly cashflow
- —
- DSCR
- —
- Eligible?
- —
Short-term bridge; refi at stabilization.
Rent comps 40 comps
| Address | Beds | Baths | Sqft | Rent | $/sqft | DOM | Units | Dist |
|---|---|---|---|---|---|---|---|---|
| 1532 N Sherman Dr Unit 1530 Sherman Indianapolis, IN | 1.0 | 1.0 | 768 | $550 | $0.72 | 2d | 1 | 0.10mi |
| 3617 Brookside Parkway South Dr Indianapolis, IN | 2.0 | 1.0 | 800 | $999 | $1.25 | 23d | 1 | 0.11mi |
| 3709 Brookside Parkway South Dr Indianapolis, IN | 1.0 | 1.0 | 742 | $825 | $1.11 | 23d | 1 | 0.11mi |
| 3601 Brookside Parkway South Dr Indianapolis, IN | 2.0 | 1.0 | 1025 | $995 | $0.97 | 23d | 1 | 0.12mi |
| 3601 Brookside Parkway South Dr Indianapolis, IN | 2.0 | 1.0 | 1025 | $995 | $0.97 | 43d | 1 | 0.12mi |
| 1358 N Gale St Indianapolis, IN | 1.0 | 1.0 | 550 | $890 | $1.62 | 16d | 1 | 0.13mi |
| 1421 N Olney St Indianapolis, IN | 2.0 | 1.0 | 1064 | $975 | $0.92 | 10d | 1 | 0.15mi |
| 1354 N Olney St Unit 1356 Indianapolis, IN | 1.0 | 1.0 | 765 | $775 | $1.01 | 43d | 1 | 0.19mi |
| 1513 N Denny St Indianapolis, IN | 3.0 | 1.0 | 874 | $1,399 | $1.60 | 23d | 1 | 0.20mi |
| 1417 N Denny St Indianapolis, IN | 2.0 | 1.0 | 1000 | $1,125 | $1.12 | 23d | 1 | 0.21mi |
| 1301 N Olney St Unit 1303 Indianapolis, IN | 2.0 | 1.0 | 750 | $1,100 | $1.47 | 43d | 1 | 0.22mi |
| 1505 N Tuxedo St Unit 1507 Indianapolis, IN | 2.0 | 1.0 | 1000 | $1,100 | $1.10 | 43d | 1 | 0.23mi |
| 1518 N Chester Ave Indianapolis, IN | 2.0 | 1.0 | 672 | $700 | $1.04 | 7d | 1 | 0.24mi |
| 1509 N Chester Ave Indianapolis, IN | 2.0 | 1.0 | 950 | $1,100 | $1.16 | 21d | 1 | 0.26mi |
| 1306 N Chester Ave Indianapolis, IN | 1.0 | 1.0 | 600 | $800 | $1.33 | 20d | 1 | 0.28mi |
| 1327 N Chester Ave Indianapolis, IN | 1.0 | 1.0 | 600 | $795 | $1.32 | 14d | 1 | 0.28mi |
| 1506 N Grant Ave Indianapolis, IN | 2.0 | 1.0 | 780 | $1,150 | $1.47 | 14d | 1 | 0.30mi |
| 1106 N Gale St Unit 1 Indianapolis, IN | 2.0 | 1.0 | 750 | $895 | $1.19 | 43d | 1 | 0.31mi |
| 1531 N Grant Ave Indianapolis, IN | 1.0 | 1.0 | 611 | $875 | $1.43 | 23d | 1 | 0.33mi |
| 1450 N Gladstone Ave Indianapolis, IN | 1.0 | 1.0 | 588 | $799 | $1.36 | 43d | 1 | 0.36mi |
| 1510 N Gladstone Ave Indianapolis, IN | 1.0 | 1.0 | 570 | $765 | $1.34 | 43d | 1 | 0.36mi |
| 1512 N Gladstone Ave Unit 1510 1510 Indianapolis, IN | 1.0 | 1.0 | 570 | $830 | $1.46 | 14d | 1 | 0.36mi |
| 1028 N Olney St Unit 1030 Indianapolis, IN | 1.0 | 1.0 | 700 | $800 | $1.14 | 23d | 1 | 0.38mi |
| 1036 N Tuxedo St Indianapolis, IN | 1.0 | 1.0 | 646 | $750 | $1.16 | 4d | 1 | 0.40mi |
| 1432 N Colorado Ave Indianapolis, IN | 1.0 | 1.0 | 584 | $875 | $1.50 | 23d | 1 | 0.43mi |
| 1421 N Colorado Ave Indianapolis, IN | 2.0 | 1.0 | 983 | $1,225 | $1.25 | 23d | 1 | 0.45mi |
| 1114 N Dearborn St Indianapolis, IN | 1.0 | 1.0 | 646 | $795 | $1.23 | 44d | 1 | 0.48mi |
| 910 N Ewing St Unit 910 Ewing Indianapolis, IN | 1.0 | 1.0 | 832 | $625 | $0.75 | 23d | 1 | 0.52mi |
| 3058 Brookside Parkway North Dr Indianapolis, IN | 1.0 | 1.0 | 700 | $875 | $1.25 | 12d | 1 | 0.56mi |
| 927 N Chester Ave Indianapolis, IN | 1.0 | 1.0 | 596 | $750 | $1.26 | 43d | 1 | 0.57mi |
| 822 N Bradley Ave Unit 822 Indianapolis, IN | 3.0 | 1.0 | 1100 | $1,200 | $1.09 | 43d | 1 | 0.62mi |
| 3030 E 10th St Indianapolis, IN | 2.0 | 1.0 | 950 | $900 | $0.95 | 21d | 1 | 0.62mi |
| 821 N Bradley Ave Indianapolis, IN | 1.0 | 1.0 | 663 | $850 | $1.28 | 4d | 1 | 0.62mi |
| 896 N Gladstone Ave Indianapolis, IN | 1.0 | 1.0 | 580 | $775 | $1.34 | 43d | 1 | 0.62mi |
| 3101 E 10th St #301 Indianapolis, IN | 2.0 | 1.0 | 921 | $1,195 | $1.30 | 43d | 1 | 0.62mi |
| 1113 N Oxford St Indianapolis, IN | 3.0 | 2.0 | 1100 | $1,495 | $1.36 | 7d | 1 | 0.64mi |
| 1315 N Rural St Indianapolis, IN | 1.0 | 1.0 | 700 | $1,000 | $1.43 | 4d | 1 | 0.66mi |
| 2827 E 18th St Indianapolis, IN | 2.0 | 1.0 | 726 | $1,300 | $1.79 | 23d | 1 | 0.67mi |
| 850 N Dearborn St Indianapolis, IN | 1.0 | 1.0 | 784 | $750 | $0.96 | 43d | 1 | 0.67mi |
| 1931 N Oxford St Indianapolis, IN | 1.0 | 1.0 | 616 | $875 | $1.42 | 4d | 1 | 0.69mi |
Listing history 23 events
-
2026-06-18days on market $74,900 Active 31 DOM
-
2026-06-17days on market $74,900 Active 30 DOM
-
2026-06-16days on market $74,900 Active 29 DOM
-
2026-06-15status $74,900 Active 28 DOM
-
2026-06-10status $74,900 Pending 28 DOM
-
2026-06-09days on market $74,900 Active 28 DOM
-
2026-06-08days on market $74,900 Active 27 DOM
-
2026-06-07days on market $74,900 Active 26 DOM
-
2026-06-03days on market $74,900 Active 22 DOM
-
2026-06-02days on market $74,900 Active 21 DOM
-
2026-06-01days on market $74,900 Active 20 DOM
-
2026-05-31days on market $74,900 Active 19 DOM
-
2026-05-12$74,900 Active 381-char remark
-
2025-03-29historical
-
2024-01-31price $135,000
-
2024-01-10status Active
-
2023-12-31historical
-
2023-08-07$159,900 Active
-
2017-10-19status Pending
Show marketing remark (307 chars)
Great starter home/investor property. 2 Bedroom/1 Bath Bungalow with basement. Property needs cosmetics and work- but has loads of potential. Hardwood floors, covered porch, working mechanicals- all utilities operable. Newer roof, soffits & gutters in good condition- Large lot- Property is sold- AS-IS.
-
2017-10-19soldstatus $22,000 Sold
Show marketing remark (307 chars)
Great starter home/investor property. 2 Bedroom/1 Bath Bungalow with basement. Property needs cosmetics and work- but has loads of potential. Hardwood floors, covered porch, working mechanicals- all utilities operable. Newer roof, soffits & gutters in good condition- Large lot- Property is sold- AS-IS.
-
2017-06-12$28,900 Active
Show marketing remark (307 chars)
Great starter home/investor property. 2 Bedroom/1 Bath Bungalow with basement. Property needs cosmetics and work- but has loads of potential. Hardwood floors, covered porch, working mechanicals- all utilities operable. Newer roof, soffits & gutters in good condition- Large lot- Property is sold- AS-IS.
-
2016-08-19historical
-
2015-08-20$34,900 Active
ⓘ Source: listings_history table (triggers on properties + properties_extension) + one-shot
backfill from property_details.listing_events for pre-trigger history.
Climate risk First Street
- Flood 1/10 Low FEMA zone X (unshaded) · 0% chance over 30 yrs
- Wildfire 1/10 Low
- Heat 3/10 Moderate 7 d/yr ≥102°F today · 19 d/yr by 30 yrs out
- Wind 2/10 Low 0% chance of damaging wind over 30 yrs
- Air quality 4/10 Moderate 5 unhealthy d/yr today · 7 by 30 yrs out
Nearby sold comps map
Loading sold comps map…
Walkable amenities ~0.75 mi
Loading nearby amenities…
Taxation est. · year 1
- Rental income
- $11,906
- − Mortgage interest
- −$4,196
- − Property taxes
- −$1,124
- − Insurance
- −$374
- − Repairs & maintenance
- −$952
- − Management
- −$952
- − Depreciation
- −$2,179
- Taxable income
- $2,128
- Est. tax owed @ 24.0%
- −$511
- After-tax cash flow
- $2,683/yr
For passive investors: Depreciation is non-cash, so a rental often shows a tax loss while cash-flowing — sheltering income. Rental losses are passive: they offset passive income freely, and up to $25,000/yr can offset ordinary (W-2) income if you actively participate and your MAGI is under $100k (phasing out to $0 by $150k); unused losses carry forward. On sale, claimed depreciation is recaptured at up to 25%, and gains may owe capital-gains tax (a 1031 exchange can defer both). Figures are a year-1 estimate at your 24.0% rate — not tax advice; consult a CPA.
Schools (NCES district)
- District
- Indianapolis Public Schools
- NCES district ID
- 1804770
- Math proficiency
- 14% ▼ -7.00%
- Reading proficiency
- 20% ▼ -3.00%
- Median HH income
- $32,034
- Composite
- 13.69/100
- National rank
- #9499
- State rank
- #286 of 301 in IN
Livability — Indianapolis city (balance)
No livability data for this city. (Only ~50 U.S. cities are tracked.)
Census & demographics
- Census place
- Indianapolis city (balance), IN
- County
- Marion County · 998,460 people
- City population
- 881,119
- Metro
- Indianapolis-Carmel-Anderson, IN
- Population (ZIP)
- 30,335
- Household income
- $49,195
- Rent vs Own
- Severe rent burden
- 1906.0
Population outlook (Marion County) Hauer SSP2
- Today (2025)
- 1,025,572 people
- By 2030
- 1,065,727 · +3.9%
- By 2040
- 1,141,577 · +11.3%
- By 2050
- 1,208,920 · +17.9%
- By 2075
- 1,367,288 · +33.3%
- By 2100
- 1,438,201 · +40.2%
Race, ethnicity, and origin ACS 2023
- Neighborhood character
- Diverse neighborhood (Simpson 0.63)
- Race & ethnicity
- White 53% Hispanic / Latino 23% Black 18% Two or more races 9%
- Hispanic origin (detail)
- Mexican 14% Puerto Rican 2%
- Common ancestry
- Slovak 2% Lithuanian 2% Italian 1%
- Foreign-born
- 9% · Canada
- Languages at home
- 81% English-only · Spanish 17%
Political lean MEDSL · Marion
- 2024 margin
- Strong D (+27.7) · D 63.0% · R 35.3% · Other 1.7%
- 2008→2024 swing
- -0.7pp no change · 2008: 28.4pp · 2024: 27.7pp
- All cycles
- 2024: D+27.7 2020: D+29.1 2016: D+22.8 2012: D+22.2 2008: D+28.4
Not yet ingested
- Civics
- —
Market trends
- HPI YoY
- ▼ -192.51%
- Current HPI
- 375.0969
- Rent YoY
- ▲ 7.31%
- Metro
- Indianapolis-Carmel-Anderson, IN
- State GDP YoY
- ▲ 2.90%
- F500 in state
- 18
Industry mix (Fortune 500 HQ in IN)
| Industry | F500 HQs | Revenue |
|---|---|---|
| Industrial Machinery | 2 | $37B |
|
||
| Healthcare | 1 | $177B |
|
||
| Pharmaceuticals | 1 | $45B |
|
||
| Metals / Steel | 1 | $18B |
|
||
| Agriculture | 1 | $17B |
|
||
| Packaging | 1 | $12B |
|
||
Price history
+114.6% since first listed13 events — show timeline
- 2026-06-15 Relisted — MIBOR as Distributed by MLS Grid
- 2026-06-09 Pending — MIBOR as Distributed by MLS Grid
- 2026-05-12 Listed $74,900 MIBOR as Distributed by MLS Grid
- 2025-03-29 Listing Removed — MIBOR as Distributed by MLS Grid
- 2024-01-31 Price Changed $135,000 MIBOR as Distributed by MLS Grid
- 2024-01-10 Relisted — MIBOR as Distributed by MLS Grid
- 2023-12-31 Listing Removed — MIBOR as Distributed by MLS Grid
- 2023-08-07 Listed $159,900 MIBOR as Distributed by MLS Grid
- 2017-10-19 Pending — MIBOR as Distributed by MLS Grid
- 2017-10-19 Sold (MLS) $22,000 MIBOR as Distributed by MLS Grid
- 2017-06-12 Listed $28,900 MIBOR as Distributed by MLS Grid
- 2016-08-19 Listing Removed — MIBOR as Distributed by MLS Grid
- 2015-08-20 Listed $34,900 MIBOR as Distributed by MLS Grid
Property tax history
+64.8%/yrLatest (2025): $5,392 · +8.3% YoY. Source: county tax records.
Cash-flow waterfall
monthlySold comps — $/sqft
last 12 mo · ≤1 miLoading sold comps…