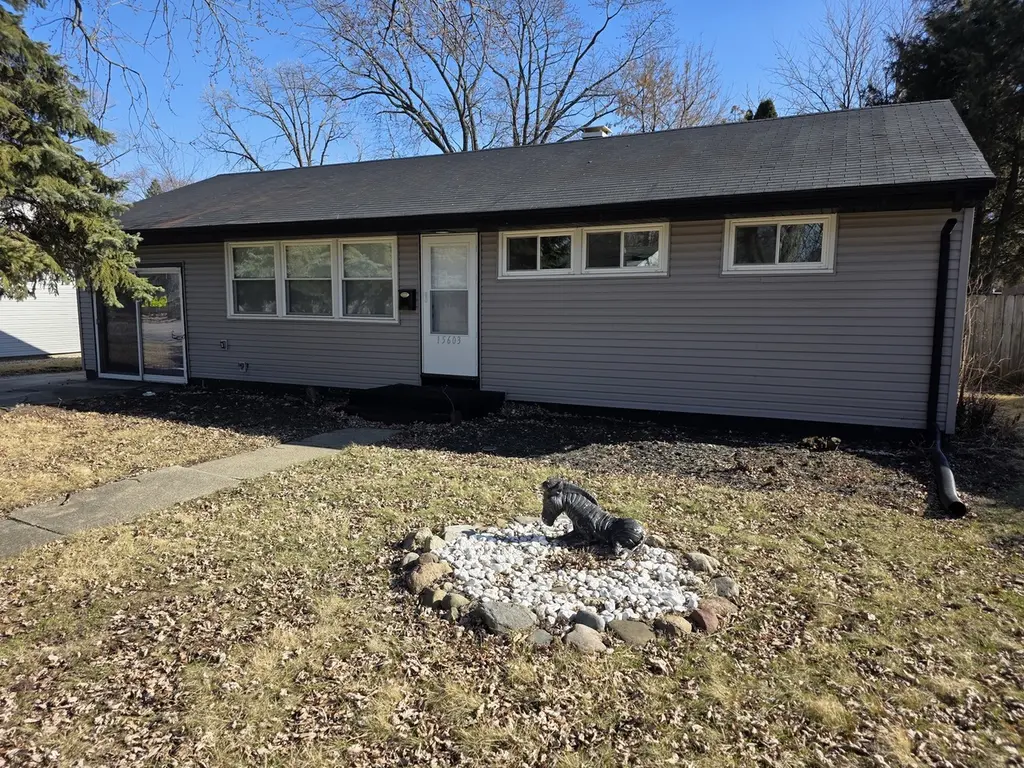
15603 Park Ln · South Holland, IL
Flood risk 1/10 · Minimal
- FEMA flood zone
- X (unshaded)
- Chance of flooding over 30 yrs
- 0.0%
- Est. flood insurance / yr
- $473 – $860
Fire risk 1/10 · Minimal
- Est. fire insurance / yr
- $804 – $1,492
Heat risk 3/10 · Minor
- Hot days now (above 101°F)
- 7 days/yr
- Hot days in 30 yrs
- 15 days/yr
Wind risk 2/10 · Minimal
- Chance of severe wind over 30 yrs
- —
Air-quality risk 4/10 · Minor
- Unhealthy air days now
- 4 days/yr
- Unhealthy air days in 30 yrs
- 5 days/yr
Risk factors via First Street. Map © Google.
Why this score? — see what drove the F grade
The composite is a weighted blend of 9 inputs, each scored 0–100. Each bar is that input's sub-score; the figure is the points it added to the 100-point composite (weight × sub-score).
- Cash flow +9.3/30.0
- Livability +3.9/5.0
- 1% rule +3.6/10.0
- DSCR +2.6/10.0
- Rent growth +2.5/5.0
- Condition / age +2.5/5.0
- Schools +0.7/10.0
- ARV discount +0.0/15.0
- Appreciation +0.0/10.0
$199,900
🖨 Deal sheet 📄 Offer letter ✓ Due diligence
Key facts
- Fully remodeled
- Updated kitchen
- Natural sunlight
Tags
Property features AI
Finance
- Other: Property not currently leased; Possession at closing
- HOA & community: No master association fee required
Exterior
- Parking: Detached garage with garage door opener (concrete, side driveway); Two total parking spaces, two garage spaces
- Utilities: Water from Lake Michigan; Public sewer; Electric with circuit breakers
- Home design: Detached single-family home; One-story layout; Fee simple ownership; Rehab completed in 2025; Estimated living area approximately 1,200 finished square feet; Built before 1978
- Construction: Vinyl siding; Asphalt roof; Estimated age range: 71–80 years
- Exterior features: Deck
Interior
- Kitchen: Kitchen on main level with ceramic tile flooring, approx. 12 x 10
- Bedrooms: Master bedroom (main level) — carpeted, approx. 16 x 12; Bedroom 2 (main level) — carpeted, approx. 11 x 9; Bedroom 3 (main level) — carpeted, approx. 9 x 7
- Flooring: Carpet in main living areas and bedrooms; Ceramic tile in kitchen; Vinyl in laundry
- Bathrooms: One full bathroom
- Heating & cooling: Natural gas forced air heating; Central air conditioning
- Interior features: Five total rooms; Window screens; Electric fireplace in the living room
- Laundry & utility: In-unit laundry (main level) with vinyl flooring, approx. 8 x 7
Neighborhood map
What this means for you Summary
Snapshot
- This is a 3-bed/1.0-bath single-family listed at $200k.
Deal economics
- At list price, monthly cash flow is $-147 ($-2k/yr) — negative.
- To cash-flow at today's rent, offer at most $174k (13.0% below list).
- To meet the 1% rule (rent ≥ 1% of price), the offer needs to be $172k (13.8% below list).
- Recommended offer: $172k (13.8% below list) — sets the bar for 1% rule.
- Cap rate 5.4% vs local median 8.4% in South Holland — below-typical yield; the buyer is paying a premium for something (appreciation thesis, condition, location) that the cap rate doesn't capture.
Location & tenants
- Location reads 77/100 on livability (#167 in IL, #3,071 nationally) — a middle-class / working-renter tenant base. Strengths: commute A+, housing A+, cost of living A; Watch: crime C-, amenities C-, schools D+.
- Thornton Twp Hsd 205 (suburban): math 7% / reading 8% proficiency, ranked #594 of 620 in IL (top 96%) — low school quality limits family demand, transient renter base, plan for 1-2y turnover.
- Market conditions: 135 active listings in the ZIP; 3 comparable units currently listed for rent nearby; rentals at typical pace (median 22d on market — plan ~3-4 weeks tenant-placement turnaround); 6,272 units permitted in Cook County in 2024 (4,658 in 5+ unit buildings).
Forward outlook
- Local home prices are declining (-3.0%/yr); year-one equity from $1k of loan paydown is wiped out by about $6k of value loss. Plan a longer hold.
Negotiation context
- It's been on market 22 days — a 2% lower offer ($197k) is reasonable based on typical stale-listing flexibility.
- 4 sale attempts with the ask held roughly flat each time — persistent listings suggest the price (not the market) is what's stuck; bring a comps-based counter.
- Current owner paid $75k; list at $200k implies a 167% gain — meaningful room to come down on a strong offer.
Risks & watch-outs
- Watch-outs: built in 1954 — expect roof / HVAC / electrical / plumbing capex.
Questions for the listing agent
- What do current leases actually rent for vs. the listed asking? Can we see a recent rent roll and the last 12 months of T-12 income?
- Built in 1954 — when were the roof, HVAC, electrical panel, plumbing, and water heater last replaced?
- Is there a deadline driving the sale (1031 exchange, divorce, estate, relocation)? That informs how much negotiation room exists.
- Schools are D-rated, which usually means shorter tenancies and higher turnover. Who's the typical renter profile here, and what's been the actual vacancy rate?
- The area grade is low — what's the realistic commute time and amenity access for the typical tenant pool here? Any planned neighborhood developments (good or bad) we should know about?
- What's the average days-on-market for RENTAL listings here right now (not sales)? A rising rental-DOM trend means longer vacancies and softer asking-rent achievability than the comps imply.
- What's the recent tenant-quality profile in this submarket — average credit score on applications, eviction rate, late-payment / NSF rate, and stable-employment percentage? A property-management company in the area should have these aggregated.
- How much new for-sale + rental construction is in the pipeline within 1–3 miles? Heavy new supply typically softens prices + rents 12–24 months out; constrained supply supports both.
Investment metrics
- 1% rule
- 0.86% ✗
- Cap rate
- 5.41%
- Cash-on-cash
- -3.15%
- DSCR
- 0.86
- GRM
- 9.7
CMA / ARV
- ARV (on-the-fly)
- $152,064
- Comps found
- 6
Show comp detail 6 sales within ~0.75 mi
| Address | Dist | Beds/Ba | Sqft | Sold | Price | $/sf | Match |
|---|---|---|---|---|---|---|---|
| 15532 Elm St | 0.08mi | 3/1.0 | 936 (+8%) | 12mo | $159,900 | $171 | 72 |
| 15503 Park Ln | 0.18mi | 3/2.0 | 968 (+12%) | 0mo | $170,000 | $176 | 68 |
| 15445 Elm St | 0.15mi | 4/1.5 (+1) | 912 (+6%) | 15mo | $185,000 | $203 | 64 |
| 15732 Chicago Rd | 0.23mi | 3/1.0 | 782 (-10%) | 19mo | $147,873 | $189 | 58 |
| 15402 Cherry St | 0.24mi | 3/1.5 | 988 (+14%) | 17mo | $140,000 | $142 | 49 |
| 15325 Cottage Grove Ave | 0.51mi | 2/1.0 (-1) | 955 (+10%) | 12mo | $158,000 | $165 | 43 |
Match score weights: distance 35% · size 25% · config 20% · recency 20%. Top-matched comps best support the ARV.
Projected returns pro-forma
-3.0% appreciation · 3.0% rent growth · sell at horizon
- IRR
- -21.5%
- Equity multiple
- 0.26×
- Total profit
- $-41,659
- Equity at exit
- $29,806
- IRR
- -15.0%
- Equity multiple
- 0.14×
- Total profit
- $-47,919
- Equity at exit
- $17,284
Cash invested: $55,972 (down + closing). Projections, not guarantees.
Landlord ↔ Tenant lean methodology
- Overall (STATE)
- 43 Moderately Tenant-Leaning
- State Illinois
- 43 Moderately Tenant-Leaning · D+7
- County
- — inherits STATE
- City
- — inherits STATE
ZIP-level market 60473
- Active inventory
- 135
- Price-to-rent
- 9.7×
Monthly cashflow live
- Estimated rent
- $1,724 medium interval (Pro) →
- Mortgage (P&I)
- −$1,048
- Tax from tax record
- −$377 /mo · $4,528/yr
- Insurance
- −$83
- HOA
- −$0
- Vacancy / Maint / Mgmt
- −$362
- Net cashflow
- $-147
Break-even live
UW: 25.0% down · 7.5% · 30yr · 1.5% tax · 5.0% vac · 8.0% maint · 8.0% mgmt
Financing live
Cash to close
- Down payment
- $49,975
- Closing costs
- $5,997
- Reserves months
- —
- Total cash needed
- —
Loan-product check · same deal, 3 products live
Conventional
25% down · 7.5% · 30yr
- Down + closing
- —
- Monthly P&I
- —
- Monthly cashflow
- —
- DSCR
- —
- Eligible?
- —
Personal DTI + credit; lowest rate.
DSCR
20% down · 8.5% · 30yr
- Down + closing
- —
- Monthly P&I
- —
- Monthly cashflow
- —
- DSCR
- —
- Eligible?
- —
No personal income docs; deal must DSCR.
Hard money
10% down · 12.0% · 12mo
- Down + closing
- —
- Monthly P&I
- —
- Monthly cashflow
- —
- DSCR
- —
- Eligible?
- —
Short-term bridge; refi at stabilization.
Rent comps 3 comps
| Address | Beds | Baths | Sqft | Rent | $/sqft | DOM | Units | Dist |
|---|---|---|---|---|---|---|---|---|
| 15238 Doctor Martin Luther King Junior Dr Unit 2W Dolton, IL | 2.0 | 1.0 | 800 | $1,500 | $1.88 | 10d | 1 | 0.41mi |
| 14817 Champlain Ave Dolton, IL | 2.0 | 1.0 | 980 | $2,430 | $2.48 | 21d | 1 | 0.95mi |
| 14500 Cottage Grove Ave Unit 3 Dolton, IL | 2.0 | 1.0 | 1000 | $1,475 | $1.48 | 24d | 1 | 1.43mi |
Listing history 32 events
-
2026-06-18days on market $199,900 Active 22 DOM
-
2026-06-17days on market $199,900 Active 21 DOM
-
2026-06-16days on market $199,900 Active 20 DOM
-
2026-06-15days on market $199,900 Active 19 DOM
-
2026-06-13days on market $199,900 Active 17 DOM
-
2026-06-13days on market $199,900 Active 16 DOM
-
2026-06-09days on market $199,900 Active 13 DOM
-
2026-06-08days on market $199,900 Active 12 DOM
-
2026-06-07days on market $199,900 Active 11 DOM
-
2026-06-04days on market $199,900 Active 8 DOM
-
2026-06-03days on market $199,900 Active 7 DOM
-
2026-06-02days on market $199,900 Active 6 DOM
-
2026-06-01days on market $199,900 Active 5 DOM
-
2026-05-31days on market $199,900 Active 4 DOM
-
2026-05-27historical
-
2026-05-27$199,900 Active
-
2026-05-12historical
-
2026-04-09Active
-
2026-04-06historical
-
2026-04-01price
-
2026-03-05price
-
2026-02-25Active
-
2025-12-15historical
-
2025-09-24price
-
2025-08-12price
-
2025-06-16price
-
2025-05-29Active
-
2025-05-12historical
-
2024-11-07soldstatus $75,000
-
2024-09-27soldstatus $75,000 Closed
-
2024-09-03historical Contingent - No Showings
-
2024-08-23price $109,000
ⓘ Source: listings_history table (triggers on properties + properties_extension) + one-shot
backfill from property_details.listing_events for pre-trigger history.
Tax reassessment forecast IL · Partial reset (capped growth)
- Current annual tax
- $4,528 · $377/mo
- Projected year-2 tax
- $4,533 · $378/mo
- Expected delta
- +$5/yr ($0/mo · 0.1%)
ⓘ Screening estimate from a state-policy table — verify with the county assessor before closing.
Climate risk First Street
- Flood 1/10 Low FEMA zone X (unshaded) · 0% chance over 30 yrs
- Wildfire 1/10 Low
- Heat 3/10 Moderate 7 d/yr ≥101°F today · 15 d/yr by 30 yrs out
- Wind 2/10 Low
- Air quality 4/10 Moderate 4 unhealthy d/yr today · 5 by 30 yrs out
Nearby sold comps map
Loading sold comps map…
Walkable amenities ~0.75 mi
Loading nearby amenities…
Taxation est. · year 1
- Rental income
- $20,685
- − Mortgage interest
- −$11,198
- − Property taxes
- −$4,528
- − Insurance
- −$1,000
- − Repairs & maintenance
- −$1,655
- − Management
- −$1,655
- − Depreciation
- −$5,815
- Taxable loss
- −$5,165
- Est. tax savings @ 24.0%
- +$1,239
- After-tax cash flow
- $-526/yr
For passive investors: Depreciation is non-cash, so a rental often shows a tax loss while cash-flowing — sheltering income. Rental losses are passive: they offset passive income freely, and up to $25,000/yr can offset ordinary (W-2) income if you actively participate and your MAGI is under $100k (phasing out to $0 by $150k); unused losses carry forward. On sale, claimed depreciation is recaptured at up to 25%, and gains may owe capital-gains tax (a 1031 exchange can defer both). Figures are a year-1 estimate at your 24.0% rate — not tax advice; consult a CPA.
Schools (NCES district)
- District
- Thornton Twp Hsd 205
- NCES district ID
- 1738970
- Math proficiency
- 7% ▬ 0.00%
- Reading proficiency
- 8% ▼ -2.00%
- Median HH income
- $43,392
- Composite
- 6.92/100
- National rank
- #9976
- State rank
- #594 of 620 in IL
Livability — South Holland
- Score
- 77/100
- State rank
- #167
- US rank
- #3071
Category grades
Schools grade is shown separately in the Schools card above.
Census & demographics
- Census place
- South Holland, IL
- City population
- 21,407
- Population (ZIP)
- 21,407
Population outlook (Cook County) Hauer SSP2
- Today (2025)
- 5,347,519 people
- By 2030
- 5,357,703 · +0.2%
- By 2040
- 5,324,924 · -0.4%
- By 2050
- 5,230,762 · -2.2%
- By 2075
- 4,785,735 · -10.5%
- By 2100
- 4,188,836 · -21.7%
Race, ethnicity, and origin ACS 2023
- Neighborhood character
- Predominantly Black (75%)
- Race & ethnicity
- Black 75% White 10% Hispanic / Latino 10% Two or more races 3% Asian 1%
- Hispanic origin (detail)
- Mexican 9% Puerto Rican 1%
- Common ancestry
- Iranian 3% Romanian 2%
- Foreign-born
- 6% · Canada, China
- Languages at home
- 87% English-only · Spanish 8% Other Asian/Pacific 1% Russian/Polish/Slavic 1%
Political lean MEDSL · Cook
- 2024 margin
- Solid D (+42.0) · D 70.4% · R 28.4% · Other 1.2%
- 2008→2024 swing
- -11.4pp toward R · 2008: 53.4pp · 2024: 42.0pp
- All cycles
- 2024: D+42.0 2020: D+50.3 2016: D+53.0 2012: D+49.4 2008: D+53.4
Not yet ingested
- Civics
- —
Market trends
- HPI YoY
- ▼ -114.36%
- Current HPI
- 201.2479
- Rent YoY
- —
- Metro
- —
- State GDP YoY
- ▲ 1.59%
- F500 in state
- 60
Industry mix (Fortune 500 HQ in IL)
| Industry | F500 HQs | Revenue |
|---|---|---|
| Insurance | 4 | $201B |
|
||
| Consumer Goods | 4 | $87B |
|
||
| Industrial Machinery | 3 | $64B |
|
||
| Healthcare | 2 | $55B |
|
||
| Retail / Pharmacy | 1 | $148B |
|
||
| Agriculture / Food | 1 | $86B |
|
||
Price history
+83.4% since first listed18 events — show timeline
- 2026-05-27 Listed $199,900 MRED as Distributed by MLS Grid
- 2026-05-27 Listing Removed — MRED as Distributed by MLS Grid
- 2026-05-12 Listing Removed — MRED as Distributed by MLS Grid
- 2026-04-09 Listed — MRED as Distributed by MLS Grid
- 2026-04-06 Listing Removed — MRED as Distributed by MLS Grid
- 2026-04-01 Price Changed — MRED as Distributed by MLS Grid
- 2026-03-05 Price Changed — MRED as Distributed by MLS Grid
- 2026-02-25 Listed — MRED as Distributed by MLS Grid
- 2025-12-15 Listing Removed — MRED as Distributed by MLS Grid
- 2025-09-24 Price Changed — MRED as Distributed by MLS Grid
- 2025-08-12 Price Changed — MRED as Distributed by MLS Grid
- 2025-06-16 Price Changed — MRED as Distributed by MLS Grid
- 2025-05-29 Listed — MRED as Distributed by MLS Grid
- 2025-05-12 Listing Removed — MRED as Distributed by MLS Grid
- 2024-11-07 Sold (Public Records) $75,000 Public Records
- 2024-09-27 Sold (MLS) $75,000 MRED as Distributed by MLS Grid
- 2024-09-03 Contingent — MRED as Distributed by MLS Grid
- 2024-08-23 Price Changed $109,000 MRED as Distributed by MLS Grid
Property tax history
+3.9%/yrLatest (2023): $4,528 · +46.9% YoY. Source: county tax records.
Cash-flow waterfall
monthlySold comps — $/sqft
last 12 mo · ≤1 miLoading sold comps…