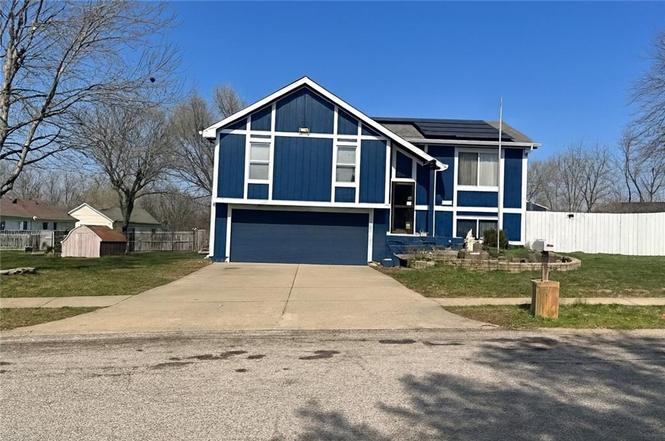
817 N Mohican Dr · Independence, MO
Flood risk 1/10 · Minimal
- FEMA flood zone
- X (unshaded)
- Chance of flooding over 30 yrs
- 0.0%
- Est. flood insurance / yr
- $473 – $860
Fire risk 1/10 · Minimal
- Est. fire insurance / yr
- $1,054 – $1,958
Heat risk 4/10 · Minor
- Hot days now (above 107°F)
- 7 days/yr
- Hot days in 30 yrs
- 17 days/yr
Wind risk 2/10 · Minimal
- Chance of severe wind over 30 yrs
- —
Air-quality risk 4/10 · Minor
- Unhealthy air days now
- 4 days/yr
- Unhealthy air days in 30 yrs
- 5 days/yr
Risk factors via First Street. Map © Google.
Why this score? — see what drove the C+ grade
The composite is a weighted blend of 9 inputs, each scored 0–100. Each bar is that input's sub-score; the figure is the points it added to the 100-point composite (weight × sub-score).
- Cash flow +21.1/30.0
- ARV discount +15.0/15.0
- DSCR +6.7/10.0
- 1% rule +6.4/10.0
- Livability +4.1/5.0
- Rent growth +3.4/5.0
- Schools +3.0/10.0
- Condition / age +2.5/5.0
- Appreciation +0.0/10.0
$165,000
🖨 Deal sheet 📄 Offer letter ✓ Due diligence
Listing remarks MLS
Move in ready 3 bedroom home in Fort Osage School District with finished basement and formal dining! Updated carpet/flooring and freshly painted inside and out. Ceiling fans in all bedrooms; Master has double closets and adjoining bath. Enjoy the deck overlooking the large fenced backyard!
Key facts
- Grape vines
- Large garden
- Fruit trees
Tags
Neighborhood map
What this means for you Summary
Snapshot
- This is a 3-bed/1.5-bath single-family listed at $165k.
Deal economics
- At list price, monthly cash flow is $237 ($3k/yr) — positive.
- The deal already cash-flows at list — no discount required.
- Meets the 1% rule at list price ($2k rent vs $165k).
- Cap rate 8.0% vs local median 5.0% in Independence — top-decile yield for the area; either an underpriced asset or a hidden risk that comps aren't pricing in. Stress-test before assuming the spread holds.
Location & tenants
- Location reads 82/100 on livability (#10 in MO, #1,296 nationally) — a professional / high-income tenant draw. Strengths: amenities A+, commute A+, cost of living A+; Watch: employment D+, crime F.
- Fort Osage R-I (rural): math 28% / reading 39% proficiency, ranked #213 of 324 in MO (top 66%) — families likely to look elsewhere, expect single-tenant / working-renter base with shorter leases.
- Zoned schools: Cler-Mont Elem. (math 32% / reading 37%, grade F, #676 of 1,115 statewide, top 66%, 318 students, 53% FRL); Fort Osage High (math 33% / reading 48%, grade F, #240 of 521 statewide, top 46%, 1,557 students, 39% FRL) — zoned schools at 46% FRL track the district average.
- Market conditions: Rents rising (+3.8%/yr); 106 active listings in the ZIP; 12 comparable units currently listed for rent nearby; rentals leasing fast (median 4d on market — plan ~1-2 weeks tenant-placement turnaround); 4,002 units permitted in Jackson County in 2024 (2,271 in 5+ unit buildings).
- This rent runs 33% of the median local income ($68k/yr) — at the standard rent-burdened threshold; future hikes will face affordability resistance.
Forward outlook
- Local home prices are declining (-3.0%/yr); year-one equity from $1k of loan paydown is wiped out by about $5k of value loss. Plan a longer hold.
- Jackson County population projected at +4% by 2050 — modest demand growth; plan on rents tracking national, not racing it.
Negotiation context
- Only 8 days on market — expect competitive offers; lowballing is unlikely to land.
- 5 sale attempts since 21y ago with the ask held roughly flat each time — persistent listings suggest the price (not the market) is what's stuck; bring a comps-based counter.
Questions for the listing agent
- Is there a deadline driving the sale (1031 exchange, divorce, estate, relocation)? That informs how much negotiation room exists.
- Crime grade is F in this area — have there been break-ins, vandalism, or insurance claims at this property in the last 3 years? What carrier currently insures it and at what premium?
- What's the average days-on-market for RENTAL listings here right now (not sales)? A rising rental-DOM trend means longer vacancies and softer asking-rent achievability than the comps imply.
- What's the recent tenant-quality profile in this submarket — average credit score on applications, eviction rate, late-payment / NSF rate, and stable-employment percentage? A property-management company in the area should have these aggregated.
- How much new for-sale + rental construction is in the pipeline within 1–3 miles? Heavy new supply typically softens prices + rents 12–24 months out; constrained supply supports both.
Investment metrics
- 1% rule
- 1.14% ✓
- Cap rate
- 8.02%
- Cash-on-cash
- 6.16%
- DSCR
- 1.27
- GRM
- 7.3
CMA / ARV
- ARV (on-the-fly)
- $279,816
- Comps found
- 12
Show comp detail 12 sales within ~0.75 mi
| Address | Dist | Beds/Ba | Sqft | Sold | Price | $/sf | Match |
|---|---|---|---|---|---|---|---|
| 818 N Wigwam Trl | 0.44mi | 3/2.0 | 1,653 (+5%) | 2mo | $194,900 | $118 | 68 |
| 658 N Mohican Dr | 0.17mi | 3/1.0 | 1,388 (-12%) | 4mo | $152,900 | $110 | 67 |
| 1320 N Holland Ct | 0.61mi | 3/2.0 | 1,613 (+3%) | 2mo | $367,900 | $228 | 64 |
| 18607 E 6th St | 0.62mi | 3/1.0 | 1,526 (-3%) | 3mo | $215,000 | $141 | 62 |
| 625 N Rockwell Ct | 0.23mi | 4/3.0 (+1) | 1,740 (+11%) | 2mo | $326,900 | $188 | 59 |
| 19113 E 14th St N | 0.72mi | 3/1.0 | 1,633 (+4%) | 2mo | $250,000 | $153 | 56 |
| 906 N Ponca Dr | 0.48mi | 3/1.5 | 1,362 (-13%) | 1mo | $225,000 | $165 | 55 |
| 816 N Tepee Dr | 0.32mi | 4/2.5 (+1) | 1,364 (-13%) | 1mo | $243,000 | $178 | 53 |
| 18505 E Bundschu Pl | 0.65mi | 3/2.5 | 1,712 (+9%) | 4mo | $320,000 | $187 | 48 |
| 1031 N Old Mill Rd | 0.54mi | 3/3.0 | 1,748 (+11%) | 3mo | $399,000 | $228 | 48 |
| 18805 E Arrowhead Dr | 0.42mi | 4/2.0 (+1) | 1,341 (-15%) | 4mo | $190,000 | $142 | 45 |
| 1126 N Holland Dr | 0.55mi | 3/2.5 | 1,803 (+15%) | 1mo | $385,000 | $214 | 45 |
Match score weights: distance 35% · size 25% · config 20% · recency 20%. Top-matched comps best support the ARV.
Projected returns pro-forma
-3.0% appreciation · 3.76% rent growth · sell at horizon
- IRR
- -5.8%
- Equity multiple
- 0.78×
- Total profit
- $-10,103
- Equity at exit
- $24,602
- IRR
- 4.8%
- Equity multiple
- 1.37×
- Total profit
- $17,044
- Equity at exit
- $14,266
Cash invested: $46,200 (down + closing). Projections, not guarantees.
Landlord ↔ Tenant lean methodology
- Overall (STATE)
- 81 Strongly Landlord-Friendly
- State Missouri
- 81 Strongly Landlord-Friendly · R+10
- County
- — inherits STATE
- City
- — inherits STATE
ZIP-level market 64056
- Rents YoY
- 3.8%
- Active inventory
- 106
- Price-to-rent
- 7.3×
Monthly cashflow live
- Estimated rent
- $1,877 high interval (Pro) →
- Mortgage (P&I)
- −$865
- Tax from tax record
- −$312 /mo · $3,741/yr
- Insurance
- −$69
- HOA
- −$0
- Vacancy / Maint / Mgmt
- −$394
- Net cashflow
- $237
Break-even live
UW: 25.0% down · 7.5% · 30yr · 1.5% tax · 5.0% vac · 8.0% maint · 8.0% mgmt
Financing live
Cash to close
- Down payment
- $41,250
- Closing costs
- $4,950
- Reserves months
- —
- Total cash needed
- —
Loan-product check · same deal, 3 products live
Conventional
25% down · 7.5% · 30yr
- Down + closing
- —
- Monthly P&I
- —
- Monthly cashflow
- —
- DSCR
- —
- Eligible?
- —
Personal DTI + credit; lowest rate.
DSCR
20% down · 8.5% · 30yr
- Down + closing
- —
- Monthly P&I
- —
- Monthly cashflow
- —
- DSCR
- —
- Eligible?
- —
No personal income docs; deal must DSCR.
Hard money
10% down · 12.0% · 12mo
- Down + closing
- —
- Monthly P&I
- —
- Monthly cashflow
- —
- DSCR
- —
- Eligible?
- —
Short-term bridge; refi at stabilization.
Rent comps 12 comps
| Address | Beds | Baths | Sqft | Rent | $/sqft | DOM | Units | Dist |
|---|---|---|---|---|---|---|---|---|
| 19246 E Ponca Dr Independence, MO | 3.0 | 1.5 | 1300 | $1,700 | $1.31 | 3d | 1 | 0.09mi |
| 19200 E Ponca Ter Independence, MO | 3.0 | 2.0 | 1195 | $1,973 | $1.65 | 43d | 1 | 0.15mi |
| 19300 E Salisbury Rd Independence, MO | 3.0 | 1.0 | 1257 | $1,845 | $1.47 | 1d | 1 | 0.50mi |
| 19200 E Salisbury Rd Independence, MO | 4.0 | 2.0 | 1518 | $2,000 | $1.32 | 23d | 1 | 0.53mi |
| 19703 E 15th St N Independence, MO | 3.0 | 2.0 | 2246 | $2,025 | $0.90 | 2d | 1 | 0.80mi |
| 1604 N Glen Ellyn St Independence, MO | 3.0 | 2.0 | 1330 | $1,845 | $1.39 | 15d | 1 | 0.95mi |
| 1617 N Belvidere Ave Independence, MO | 3.0 | 2.0 | 1642 | $2,006 | $1.22 | 1d | 1 | 0.98mi |
| 1406 N Ponca Dr Independence, MO | 4.0 | 1.0 | 1400 | $1,650 | $1.18 | 3d | 1 | 1.00mi |
| 18813 Lexington Rd Independence, MO | 2.0 | 1.5 | 1190 | $1,250 | $1.05 | 2d | 1 | 1.03mi |
| 808 N Piute Ave Independence, MO | 3.0 | 2.0 | 1948 | $1,725 | $0.89 | 1d | 1 | 1.04mi |
| 18410 E Shoshone Dr Independence, MO | 3.0 | 2.0 | 1426 | $1,450 | $1.02 | 43d | 1 | 1.14mi |
| 301 S Sue Ellen Ave Independence, MO | 3.0 | 2.0 | 1216 | $1,550 | $1.27 | 1d | 1 | 1.45mi |
Listing history 17 events
-
2025-12-03status Pending
-
2025-11-25$165,000 Active
-
2024-03-28status Pending
-
2024-03-28price $185,000
-
2024-03-27historical
-
2024-03-21$190,000 Active
-
2020-02-14soldstatus
-
2020-02-13soldstatus Sold 290-char remark
Show marketing remark (290 chars)
Move in ready 3 bedroom home in Fort Osage School District with finished basement and formal dining! Updated carpet/flooring and freshly painted inside and out. Ceiling fans in all bedrooms; Master has double closets and adjoining bath. Enjoy the deck overlooking the large fenced backyard!
-
2019-12-26status Pending 290-char remark
Show marketing remark (290 chars)
Move in ready 3 bedroom home in Fort Osage School District with finished basement and formal dining! Updated carpet/flooring and freshly painted inside and out. Ceiling fans in all bedrooms; Master has double closets and adjoining bath. Enjoy the deck overlooking the large fenced backyard!
-
2019-12-06status Active 290-char remark
Show marketing remark (290 chars)
Move in ready 3 bedroom home in Fort Osage School District with finished basement and formal dining! Updated carpet/flooring and freshly painted inside and out. Ceiling fans in all bedrooms; Master has double closets and adjoining bath. Enjoy the deck overlooking the large fenced backyard!
-
2019-12-05price $150,000 290-char remark
Show marketing remark (290 chars)
Move in ready 3 bedroom home in Fort Osage School District with finished basement and formal dining! Updated carpet/flooring and freshly painted inside and out. Ceiling fans in all bedrooms; Master has double closets and adjoining bath. Enjoy the deck overlooking the large fenced backyard!
-
2019-09-17historical 290-char remark
Show marketing remark (290 chars)
Move in ready 3 bedroom home in Fort Osage School District with finished basement and formal dining! Updated carpet/flooring and freshly painted inside and out. Ceiling fans in all bedrooms; Master has double closets and adjoining bath. Enjoy the deck overlooking the large fenced backyard!
-
2019-08-07$155,000 Active 290-char remark
Show marketing remark (290 chars)
Move in ready 3 bedroom home in Fort Osage School District with finished basement and formal dining! Updated carpet/flooring and freshly painted inside and out. Ceiling fans in all bedrooms; Master has double closets and adjoining bath. Enjoy the deck overlooking the large fenced backyard!
-
2005-11-04soldstatus
-
2005-11-03soldstatus
-
2005-09-30$92,500
-
1996-09-04soldstatus
ⓘ Source: listings_history table (triggers on properties + properties_extension) + one-shot
backfill from property_details.listing_events for pre-trigger history.
Tax reassessment forecast MO · Resets to sale price
- Current annual tax
- $3,741 · $312/mo
- Projected year-2 tax
- $3,741 · $312/mo
- Expected delta
- $0/yr ($0/mo · 0.0%)
ⓘ Screening estimate from a state-policy table — verify with the county assessor before closing.
Climate risk First Street
- Flood 1/10 Low FEMA zone X (unshaded) · 0% chance over 30 yrs
- Wildfire 1/10 Low
- Heat 4/10 Moderate 7 d/yr ≥107°F today · 17 d/yr by 30 yrs out
- Wind 2/10 Low
- Air quality 4/10 Moderate 4 unhealthy d/yr today · 5 by 30 yrs out
Nearby sold comps map
Loading sold comps map…
Walkable amenities ~0.75 mi
Loading nearby amenities…
Taxation est. · year 1
- Rental income
- $22,524
- − Mortgage interest
- −$9,243
- − Property taxes
- −$3,741
- − Insurance
- −$825
- − Repairs & maintenance
- −$1,802
- − Management
- −$1,802
- − Depreciation
- −$4,800
- Taxable income
- $311
- Est. tax owed @ 24.0%
- −$75
- After-tax cash flow
- $2,769/yr
For passive investors: Depreciation is non-cash, so a rental often shows a tax loss while cash-flowing — sheltering income. Rental losses are passive: they offset passive income freely, and up to $25,000/yr can offset ordinary (W-2) income if you actively participate and your MAGI is under $100k (phasing out to $0 by $150k); unused losses carry forward. On sale, claimed depreciation is recaptured at up to 25%, and gains may owe capital-gains tax (a 1031 exchange can defer both). Figures are a year-1 estimate at your 24.0% rate — not tax advice; consult a CPA.
Schools (NCES district)
- District
- Fort Osage R-I
- NCES district ID
- 2912290
- Math proficiency
- 28% ▼ -7.00%
- Reading proficiency
- 39% ▼ -5.00%
- Median HH income
- $57,441
- Composite
- 29.78/100
- National rank
- #6428
- State rank
- #213 of 324 in MO
Livability — Independence
- Score
- 82/100
- State rank
- #10
- US rank
- #1296
Category grades
Schools grade is shown separately in the Schools card above.
Census & demographics
- Census place
- Independence, MO
- County
- Jackson County · 687,798 people
- City population
- 117,675
- Metro
- Kansas City, MO-KS
- Population (ZIP)
- 17,395
- Household income
- $67,685
- Rent vs Own
- Severe rent burden
- 747.0
Population outlook (Jackson County) Hauer SSP2
- Today (2025)
- 719,589 people
- By 2030
- 731,456 · +1.6%
- By 2040
- 746,689 · +3.8%
- By 2050
- 749,289 · +4.1%
- By 2075
- 736,227 · +2.3%
- By 2100
- 668,210 · -7.1%
Race, ethnicity, and origin ACS 2023
- Neighborhood character
- Predominantly White (69%)
- Race & ethnicity
- White 69% Black 14% Hispanic / Latino 8% Two or more races 7% Pacific Islander 1%
- Hispanic origin (detail)
- Mexican 6%
- Common ancestry
- Italian 9% Lithuanian 2% Slovak 2%
- Foreign-born
- 3% · Canada
- Languages at home
- 96% English-only · Spanish 4%
Political lean MEDSL · Jackson
- 2024 margin
- D (+19.3) · D 58.9% · R 39.5% · Other 1.6%
- 2008→2024 swing
- -6.1pp toward R · 2008: 25.4pp · 2024: 19.3pp
- All cycles
- 2024: D+19.3 2020: D+22.0 2016: D+16.6 2012: D+19.0 2008: D+25.4
Not yet ingested
- Civics
- —
Market trends
- HPI YoY
- ▼ -163.60%
- Current HPI
- 286.349
- Rent YoY
- ▲ 3.76%
- Metro
- Kansas City, MO-KS
- State GDP YoY
- ▲ 1.84%
- F500 in state
- 20
Industry mix (Fortune 500 HQ in MO)
| Industry | F500 HQs | Revenue |
|---|---|---|
| Healthcare | 1 | $163B |
|
||
| Insurance | 1 | $21B |
|
||
| Industrial Technology | 1 | $17B |
|
||
| Retail | 1 | $16B |
|
||
| Industrial Distribution | 1 | $10B |
|
||
| Utilities | 1 | $9B |
|
||
Price history
+78.4% since first listed17 events — show timeline
- 2025-12-03 Pending — Heartland MLS as Distributed by MLS Grid
- 2025-11-25 Listed $165,000 Heartland MLS as Distributed by MLS Grid
- 2024-03-28 Pending — Heartland MLS as Distributed by MLS Grid
- 2024-03-28 Price Changed $185,000 Heartland MLS as Distributed by MLS Grid
- 2024-03-27 Listing Removed — Heartland MLS as Distributed by MLS Grid
- 2024-03-21 Listed $190,000 Heartland MLS as Distributed by MLS Grid
- 2020-02-14 Sold (Public Records) — Public Records
- 2020-02-13 Sold (MLS) — Heartland MLS as Distributed by MLS Grid
- 2019-12-26 Pending — Heartland MLS as Distributed by MLS Grid
- 2019-12-06 Relisted — Heartland MLS as Distributed by MLS Grid
- 2019-12-05 Price Changed $150,000 Heartland MLS as Distributed by MLS Grid
- 2019-09-17 Listing Removed — Heartland MLS as Distributed by MLS Grid
- 2019-08-07 Listed $155,000 Heartland MLS as Distributed by MLS Grid
- 2005-11-04 Sold (Public Records) — Public Records
- 2005-11-03 Sold (MLS) — Heartland MLS as Distributed by MLS Grid
- 2005-09-30 Listed $92,500 Heartland MLS as Distributed by MLS Grid
- 1996-09-04 Sold (Public Records) — Public Records
Property tax history
+9.0%/yrLatest (2025): $3,741 · +39.8% YoY. Source: county tax records.
Cash-flow waterfall
monthlySold comps — $/sqft
last 12 mo · ≤1 miLoading sold comps…