 🏷️ Likely Rental
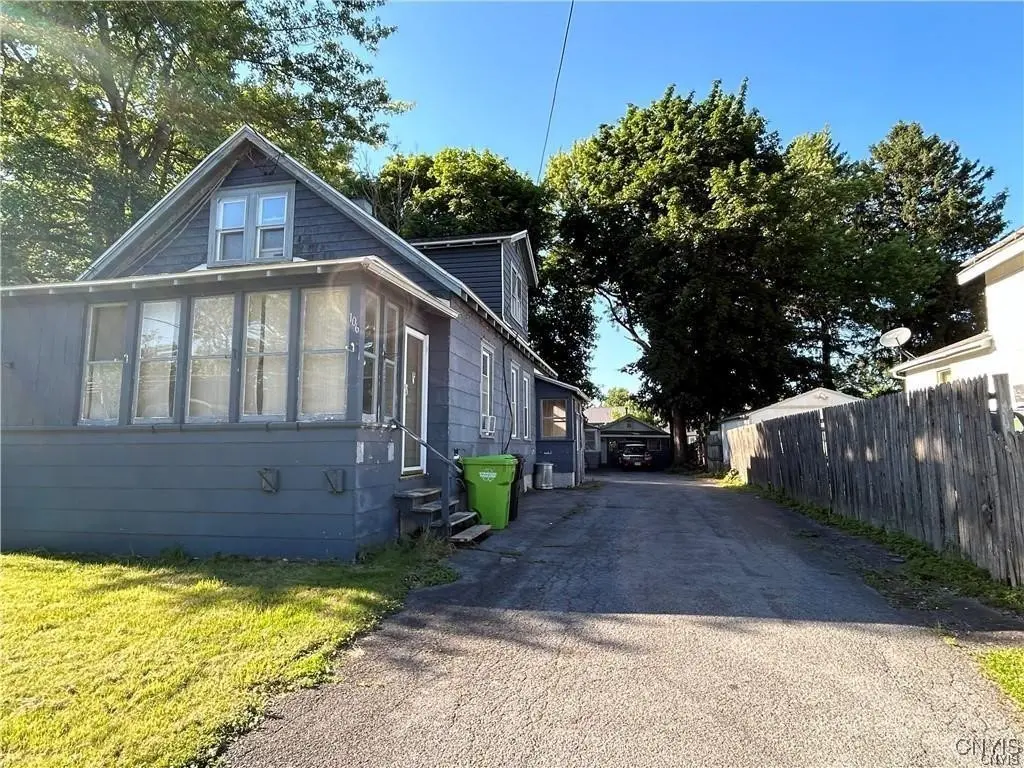
106 Garden City Dr · Mattydale, NY
Flood risk 1/10 · Minimal
- FEMA flood zone
- X (unshaded)
- Chance of flooding over 30 yrs
- 0.0%
- Est. flood insurance / yr
- $473 – $860
Fire risk 1/10 · Minimal
- Est. fire insurance / yr
- $691 – $1,283
Heat risk 3/10 · Minor
- Hot days now (above 95°F)
- 7 days/yr
- Hot days in 30 yrs
- 16 days/yr
Wind risk 1/10 · Minimal
- Chance of severe wind over 30 yrs
- 0.0%
Air-quality risk 2/10 · Minimal
- Unhealthy air days now
- 0 days/yr
- Unhealthy air days in 30 yrs
- 1 days/yr
Risk factors via First Street. Map © Google.
Why this score? — see what drove the D grade
The composite is a weighted blend of 9 inputs, each scored 0–100. Each bar is that input's sub-score; the figure is the points it added to the 100-point composite (weight × sub-score).
- ARV discount +15.0/15.0
- Appreciation +10.0/10.0
- Schools +4.2/10.0
- Livability +3.6/5.0
- Cash flow +2.9/30.0
- Rent growth +2.5/5.0
- Condition / age +2.5/5.0
- 1% rule +1.8/10.0
- DSCR +0.0/10.0
$259,900
🖨 Deal sheet (PDF) 📄 Offer letter ✓ Due diligence
Listing remarks MLS
Beautiful property, generates great income! 3 structures on one property. first building features downstairs and upstairs apt and full basement second building is a one family house with full basement third building is a one bedroom apt with a back shed, no basement but utility room! Each apt has a parking spot and there is plenty of parking for visitors All 4 apts generate approximately $3,500 a month for rent. No FHA mortgages as the current owner will not evict current renters.
Key facts
- Back shed
- Utility room
- Parking spot
Tags
Neighborhood map
What this means for you Summary
Snapshot
- This is a 3-bed/2.0-bath other listed at $260k.
Deal economics
- At list price, monthly cash flow is $-851 ($-10k/yr) — negative.
- To cash-flow at today's rent, offer at most $186k (28.6% below list).
- To meet the 1% rule (rent ≥ 1% of price), the offer needs to be $176k (32.1% below list).
- Recommended offer: $176k (32.1% below list) — sets the bar for 1% rule.
- Cap rate 2.4% vs local median 5.5% in Mattydale — below-typical yield; the buyer is paying a premium for something (appreciation thesis, condition, location) that the cap rate doesn't capture.
Location & tenants
- Location reads 72/100 on livability (#360 in NY) — a middle-class / working-renter tenant base. Strengths: cost of living A+, housing A+, health & safety A+; Watch: schools D, crime D, amenities F.
- North Syracuse Central School District (suburban): math 45% / reading 50% proficiency, ranked #402 of 590 in NY (top 68%) — families likely to look elsewhere, expect single-tenant / working-renter base with shorter leases.
- Market conditions: 20 active listings in the ZIP; 7 comparable units currently listed for rent nearby; rentals lingering (median 46d on market — plan ~5-8 weeks vacancy on turnover, expect pricing pressure); 57% of comp listings sitting > 30 days — soft ceiling on asking rent; 616 units permitted in Onondaga County in 2024 (256 in 5+ unit buildings).
Forward outlook
- In year one you build about $28k of equity ($2k loan paydown + $26k appreciation (10.0% local appreciation)).
- Onondaga County population projected to shrink 9% by 2050 — rents likely to lag national; underwrite the cash flow, not the appreciation.
- By year 2, paydown + projected appreciation supports a ~$45k cash-out refi (75% LTV) — recoverable capital for the next deal without selling this one.
Negotiation context
- It's been on market 235 days — a 12% lower offer ($229k) is reasonable based on typical stale-listing flexibility.
- 7 sale attempts since 6y ago with the ask held roughly flat each time — persistent listings suggest the price (not the market) is what's stuck; bring a comps-based counter.
- Current owner paid $155k; list at $260k implies a 68% gain — meaningful room to come down on a strong offer.
Risks & watch-outs
- Watch-outs: property tax is 3.6% of price; built in 1940 — expect roof / HVAC / electrical / plumbing capex.
Questions for the listing agent
- What do current leases actually rent for vs. the listed asking? Can we see a recent rent roll and the last 12 months of T-12 income?
- It's been on market 235 days. Have you received any prior offers? Is the seller open to a 32% concession, seller financing, or rate buy-down credit?
- Built in 1940 — when were the roof, HVAC, electrical panel, plumbing, and water heater last replaced?
- Property tax is high relative to price — has the assessment been appealed recently, and will the sale trigger a re-assessment?
- Why hasn't it sold? Are there any deal-killer items the seller is aware of (foundation, flood, title, zoning, code violations)?
- Is there a deadline driving the sale (1031 exchange, divorce, estate, relocation)? That informs how much negotiation room exists.
- Schools are D-rated, which usually means shorter tenancies and higher turnover. Who's the typical renter profile here, and what's been the actual vacancy rate?
- Crime grade is D in this area — have there been break-ins, vandalism, or insurance claims at this property in the last 3 years? What carrier currently insures it and at what premium?
- The area grade is low — what's the realistic commute time and amenity access for the typical tenant pool here? Any planned neighborhood developments (good or bad) we should know about?
- What's the average days-on-market for RENTAL listings here right now (not sales)? A rising rental-DOM trend means longer vacancies and softer asking-rent achievability than the comps imply.
- What's the recent tenant-quality profile in this submarket — average credit score on applications, eviction rate, late-payment / NSF rate, and stable-employment percentage? A property-management company in the area should have these aggregated.
- How much new for-sale + rental construction is in the pipeline within 1–3 miles? Heavy new supply typically softens prices + rents 12–24 months out; constrained supply supports both.
Investment metrics
- 1% rule
- 0.68% ✗
- Cap rate
- 2.36%
- Cash-on-cash
- -14.04%
- DSCR
- 0.38
- GRM
- 12.3
CMA / ARV
- ARV (median comp)
- $365,890
- List price
- $259,900
- Delta
- -28.97%
- Verdict
- UNDERPRICED
- Comps
- 13 within 1.0 mi
Projected returns pro-forma
10.0% appreciation · 3.0% rent growth · sell at horizon
- IRR
- 14.6%
- Equity multiple
- 2.20×
- Total profit
- $87,633
- Equity at exit
- $234,139
- IRR
- 14.4%
- Equity multiple
- 5.14×
- Total profit
- $301,303
- Equity at exit
- $504,929
Cash invested: $72,772 (down + closing). Projections, not guarantees.
Landlord ↔ Tenant lean methodology
- Overall (STATE)
- 15 Strongly Tenant-Friendly
- State New York
- 15 Strongly Tenant-Friendly · D+10
- County
- — inherits STATE
- City
- — inherits STATE
ZIP-level market 13211
- Home prices YoY
- 10.7%
- Active inventory
- 20
- Price-to-rent
- 12.3×
Monthly cashflow live
- Estimated rent
- $1,764 high interval (Pro) →
- Mortgage (P&I)
- −$1,363
- Tax from tax record
- −$774 /mo · $9,284/yr
- Insurance
- −$108
- HOA
- −$0
- Vacancy / Maint / Mgmt
- −$370
- Net cashflow
- $-851
Break-even live
Sensitivity live
| Price | -10% $-704 | -5% $-778 | +0% $-851 | +5% $-925 | +10% $-998 |
|---|---|---|---|---|---|
| Rent | -10% $-991 | -5% $-921 | +0% $-851 | +5% $-782 | +10% $-712 |
| Rate | -1.0pp $-720 | -0.5pp $-785 | base $-851 | +0.5pp $-919 | +1.0pp $-987 |
UW: 25.0% down · 7.5% · 30yr · 1.5% tax · 5.0% vac · 8.0% maint · 8.0% mgmt
Financing live
Cash to close
- Down payment
- $64,975
- Closing costs
- $7,797
- Reserves months
- —
- Total cash needed
- —
Loan-product check · same deal, 3 products live
Conventional
25% down · 7.5% · 30yr
- Down + closing
- —
- Monthly P&I
- —
- Monthly cashflow
- —
- DSCR
- —
- Eligible?
- —
Personal DTI + credit; lowest rate.
DSCR
20% down · 8.5% · 30yr
- Down + closing
- —
- Monthly P&I
- —
- Monthly cashflow
- —
- DSCR
- —
- Eligible?
- —
No personal income docs; deal must DSCR.
Hard money
10% down · 12.0% · 12mo
- Down + closing
- —
- Monthly P&I
- —
- Monthly cashflow
- —
- DSCR
- —
- Eligible?
- —
Short-term bridge; refi at stabilization.
Rent comps 7 comps
| Address | Beds | Baths | Sqft | Rent | $/sqft | DOM | Units | Dist |
|---|---|---|---|---|---|---|---|---|
| 106 Harrington St Syracuse, NY | 3.0 | 1.0 | 1168 | $1,875 | $1.61 | 45d | 1 | 0.15mi |
| 2802 Lemoyne Ave Unit 1 Syracuse, NY | 3.0 | 1.0 | 988 | $1,700 | $1.72 | 15d | 1 | 0.17mi |
| 1140 Wolf St Apt 3 Syracuse, NY | 2.0 | 1.0 | 800 | $1,200 | $1.50 | 45d | 1 | 1.02mi |
| 1132 Wolf St Unit 4 Syracuse, NY | 3.0 | 1.0 | 1041 | $1,350 | $1.30 | 45d | 1 | 1.03mi |
| 6715 Buckley Rd Syracuse, NY | 1.0–2.0 | 1.0 | 725 | $2,175 | $3.00 | 15d | 5 | 1.22mi |
| 286 Ross Park Syracuse, NY | 3.0 | 1.0 | 1100 | $1,500 | $1.36 | 46d | 1 | 1.22mi |
| 103 Hyland Dr Syracuse, NY | 3.0 | 1.0 | 1260 | $2,400 | $1.90 | 15d | 1 | 1.31mi |
Listing history 26 events
-
2026-05-05status Pending 490-char remark
Show marketing remark (490 chars)
Beautiful property, generates great income! 3 structures on one property. first building features downstairs and upstairs apt and full basement second building is a one family house with full basement third building is a one bedroom apt with a back shed, no basement but utility room! Each apt has a parking spot and there is plenty of parking for visitors All 4 apts generate approximately $3,500 a month for rent. No FHA mortgages as the current owner will not evict current renters.
-
2026-03-10status Active 490-char remark
Show marketing remark (490 chars)
Beautiful property, generates great income! 3 structures on one property. first building features downstairs and upstairs apt and full basement second building is a one family house with full basement third building is a one bedroom apt with a back shed, no basement but utility room! Each apt has a parking spot and there is plenty of parking for visitors All 4 apts generate approximately $3,500 a month for rent. No FHA mortgages as the current owner will not evict current renters.
-
2026-03-10price $259,900 490-char remark
Show marketing remark (490 chars)
Beautiful property, generates great income! 3 structures on one property. first building features downstairs and upstairs apt and full basement second building is a one family house with full basement third building is a one bedroom apt with a back shed, no basement but utility room! Each apt has a parking spot and there is plenty of parking for visitors All 4 apts generate approximately $3,500 a month for rent. No FHA mortgages as the current owner will not evict current renters.
-
2025-11-03historical Active Under Contract 490-char remark
Show marketing remark (490 chars)
Beautiful property, generates great income! 3 structures on one property. first building features downstairs and upstairs apt and full basement second building is a one family house with full basement third building is a one bedroom apt with a back shed, no basement but utility room! Each apt has a parking spot and there is plenty of parking for visitors All 4 apts generate approximately $3,500 a month for rent. No FHA mortgages as the current owner will not evict current renters.
-
2025-10-14price $264,900 490-char remark
Show marketing remark (490 chars)
Beautiful property, generates great income! 3 structures on one property. first building features downstairs and upstairs apt and full basement second building is a one family house with full basement third building is a one bedroom apt with a back shed, no basement but utility room! Each apt has a parking spot and there is plenty of parking for visitors All 4 apts generate approximately $3,500 a month for rent. No FHA mortgages as the current owner will not evict current renters.
-
2025-09-12$269,900 Active 490-char remark
Show marketing remark (490 chars)
Beautiful property, generates great income! 3 structures on one property. first building features downstairs and upstairs apt and full basement second building is a one family house with full basement third building is a one bedroom apt with a back shed, no basement but utility room! Each apt has a parking spot and there is plenty of parking for visitors All 4 apts generate approximately $3,500 a month for rent. No FHA mortgages as the current owner will not evict current renters.
-
2025-07-02historical
-
2025-03-28price $269,900
-
2025-02-25price $274,900
-
2025-01-08price $279,900
-
2025-01-02$290,000 Active
-
2024-12-18historical
-
2024-12-02status Active
-
2024-10-03status Active
-
2024-07-25status Pending
-
2024-07-05price $290,000
-
2024-07-05price $29,000
-
2024-06-18$299,900 Active
-
2020-07-30soldstatus $154,900
-
2020-07-22soldstatus $154,900 Closed Sale or Rented
-
2020-06-15status Pending Sale
-
2020-05-14status Under Contract- Do Not Show
-
2020-05-08historical Continue to Show- Under Contract
-
2020-04-30price $159,990
-
2020-02-28$175,000 Active
-
2004-12-22soldstatus $110,500
ⓘ Source: listings_history table (triggers on properties + properties_extension) + one-shot
backfill from property_details.listing_events for pre-trigger history.
Tax reassessment forecast NY · Partial reset (capped growth)
- Current annual tax
- $9,284 · $774/mo
- Projected year-2 tax
- $9,284 · $774/mo
- Expected delta
- $0/yr ($0/mo · 0.0%)
ⓘ Screening estimate from a state-policy table — verify with the county assessor before closing.
Climate risk First Street
- Flood 1/10 Low FEMA zone X (unshaded) · 0% chance over 30 yrs
- Wildfire 1/10 Low
- Heat 3/10 Moderate 7 d/yr ≥95°F today · 16 d/yr by 30 yrs out
- Wind 1/10 Low 0% chance of damaging wind over 30 yrs
- Air quality 2/10 Low 0 unhealthy d/yr today · 1 by 30 yrs out
Nearby sold comps map
Loading sold comps map…
Walkable amenities ~0.75 mi
Loading nearby amenities…
Taxation est. · year 1
- Rental income
- $21,169
- − Mortgage interest
- −$14,558
- − Property taxes
- −$9,284
- − Insurance
- −$1,300
- − Repairs & maintenance
- −$1,694
- − Management
- −$1,694
- − Depreciation
- −$7,561
- Taxable loss
- −$14,921
- Est. tax savings @ 24.0%
- +$3,581
- After-tax cash flow
- $-6,634/yr
For passive investors: Depreciation is non-cash, so a rental often shows a tax loss while cash-flowing — sheltering income. Rental losses are passive: they offset passive income freely, and up to $25,000/yr can offset ordinary (W-2) income if you actively participate and your MAGI is under $100k (phasing out to $0 by $150k); unused losses carry forward. On sale, claimed depreciation is recaptured at up to 25%, and gains may owe capital-gains tax (a 1031 exchange can defer both). Figures are a year-1 estimate at your 24.0% rate — not tax advice; consult a CPA.
Schools (NCES district)
- District
- North Syracuse Central School District
- NCES district ID
- 3621210
- Math proficiency
- 45% ▼ -9.00%
- Reading proficiency
- 50% ▲ 1.00%
- Median HH income
- $62,904
- Composite
- 41.93/100
- National rank
- #3356
- State rank
- #402 of 590 in NY
Livability — Mattydale
- Score
- 72/100
- State rank
- #360
- US rank
- #6130
Category grades
Schools grade is shown separately in the Schools card above.
Census & demographics
- Census place
- Mattydale, NY
- City population
- 6,155
- Population (ZIP)
- 6,155
Population outlook (Onondaga County) Hauer SSP2
- Today (2025)
- 467,894 people
- By 2030
- 463,381 · -1.0%
- By 2040
- 447,697 · -4.3%
- By 2050
- 426,399 · -8.9%
- By 2075
- 373,661 · -20.1%
- By 2100
- 307,967 · -34.2%
Race, ethnicity, and origin ACS 2023
- Neighborhood character
- Predominantly White (78%)
- Race & ethnicity
- White 78% Two or more races 7% Asian 5% Hispanic / Latino 5% Black 4%
- Common ancestry
- Romanian 7% Lithuanian 5% Iranian 2%
- Foreign-born
- 5% · Philippines, India, Vietnam
- Languages at home
- 93% English-only · Other Indo-European 2% Other Asian/Pacific 2% Russian/Polish/Slavic 1%
Political lean MEDSL · Onondaga
- 2024 margin
- D (+17.3) · D 58.6% · R 41.4%
- 2008→2024 swing
- -3.0pp toward R · 2008: 20.3pp · 2024: 17.3pp
- All cycles
- 2024: D+17.3 2020: D+20.6 2016: D+12.8 2012: D+21.1 2008: D+20.3
Not yet ingested
- Civics
- —
Market trends
- HPI YoY
- ▲ 31.87%
- Current HPI
- 330.266
- Rent YoY
- —
- Metro
- —
- State GDP YoY
- ▲ 2.60%
- F500 in state
- 92
Industry mix (Fortune 500 HQ in NY)
| Industry | F500 HQs | Revenue |
|---|---|---|
| Financial Services | 10 | $950B |
|
||
| Consumer Goods | 9 | $162B |
|
||
| Insurance | 4 | $225B |
|
||
| Telecommunications | 2 | $144B |
|
||
| Pharmaceuticals | 2 | $112B |
|
||
| Media / Entertainment | 2 | $69B |
|
||
Price history
+135.2% since first listed26 events — show timeline
- 2026-05-05 Pending — CNYIS
- 2026-03-10 Relisted — CNYIS
- 2026-03-10 Price Changed $259,900 CNYIS
- 2025-11-03 Contingent — CNYIS
- 2025-10-14 Price Changed $264,900 CNYIS
- 2025-09-12 Listed $269,900 CNYIS
- 2025-07-02 Listing Removed — CNYIS
- 2025-03-28 Price Changed $269,900 CNYIS
- 2025-02-25 Price Changed $274,900 CNYIS
- 2025-01-08 Price Changed $279,900 CNYIS
- 2025-01-02 Listed $290,000 CNYIS
- 2024-12-18 Listing Removed — CNYIS
- 2024-12-02 Relisted — CNYIS
- 2024-10-03 Relisted — CNYIS
- 2024-07-25 Pending — CNYIS
- 2024-07-05 Price Changed $290,000 CNYIS
- 2024-07-05 Price Changed $29,000 CNYIS
- 2024-06-18 Listed $299,900 CNYIS
- 2020-07-30 Sold (Public Records) $154,900 Public Records
- 2020-07-22 Sold (MLS) $154,900 CNYIS
- 2020-06-15 Pending — CNYIS
- 2020-05-14 Pending — CNYIS
- 2020-05-08 Contingent — CNYIS
- 2020-04-30 Price Changed $159,990 CNYIS
- 2020-02-28 Listed $175,000 CNYIS
- 2004-12-22 Sold (Public Records) $110,500 Public Records
Property tax history
+2.6%/yrLatest (2025): $9,284 · -0.5% YoY. Source: county tax records.
Cash-flow waterfall
monthlySold comps — $/sqft
last 12 mo · ≤1 miLoading sold comps…