 Duplex
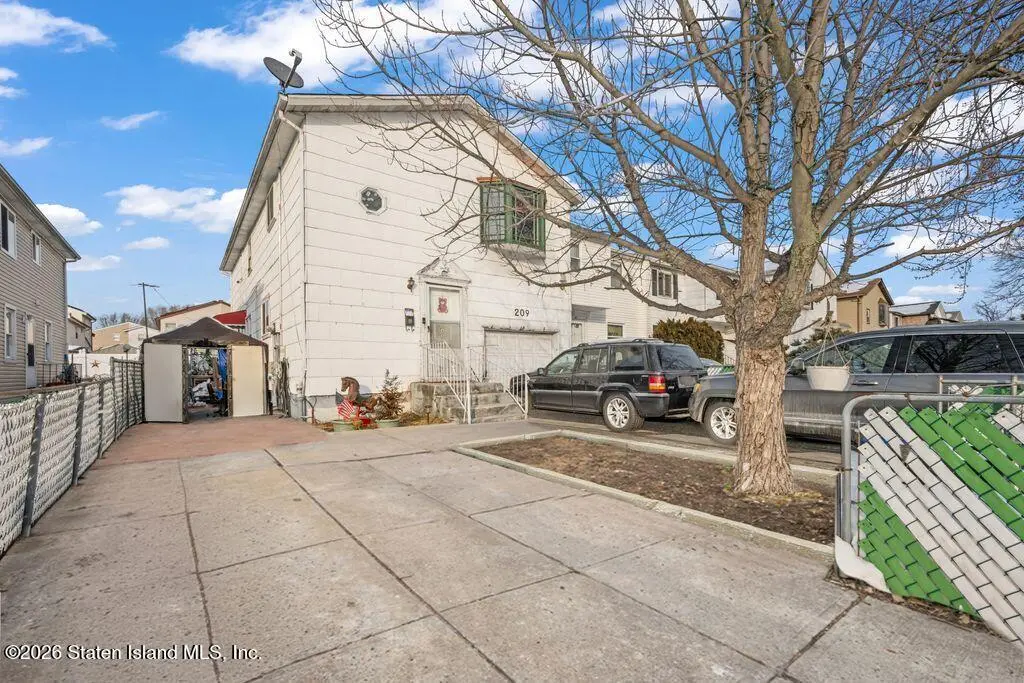
209 Regis Dr · New York, NY
Flood risk 5/10 · Moderate
- FEMA flood zone
- X (unshaded)
- Chance of flooding over 30 yrs
- 0.65%
- Est. flood insurance / yr
- $507 – $1,088
Fire risk 1/10 · Minimal
- Est. fire insurance / yr
- $691 – $1,283
Heat risk 7/10 · Major
- Hot days now (above 98°F)
- 7 days/yr
- Hot days in 30 yrs
- 15 days/yr
Wind risk 6/10 · Moderate
- Chance of severe wind over 30 yrs
- 51.0%
Air-quality risk 4/10 · Minor
- Unhealthy air days now
- 5 days/yr
- Unhealthy air days in 30 yrs
- 6 days/yr
Risk factors via First Street. Map © Google.
Why this score? — see what drove the D grade
The composite is a weighted blend of 9 inputs, each scored 0–100. Each bar is that input's sub-score; the figure is the points it added to the 100-point composite (weight × sub-score).
- Cash flow +12.2/30.0
- ARV discount +9.9/15.0
- Schools +5.0/10.0
- Livability +3.8/5.0
- DSCR +3.6/10.0
- Rent growth +3.5/5.0
- 1% rule +2.8/10.0
- Condition / age +2.5/5.0
- Appreciation +0.0/10.0
$799,999
🖨 Deal sheet (PDF) 📄 Offer letter ✓ Due diligence
Multi-family units
County records classify this as Multi-Family (2-4 Unit). Listing-text estimate: 2 units. confirmed
Listing remarks MLS
SPACIOUS 3 BR SEMI,NEW FULL BA,NEW HW HEATER,NEW ROOF,3 CAR DRVWY + GARAGE,CLOSE TO SHOPPING & TRANSPORT. HOMEOWNERS WARRANTY SUBJECT TO E & O. SB PAYS $25 SUB FEE. Level 1: B: FULL,1/2 BATH,LOTS OF CLOSETS,KIT,LNDRY RM,WORKSHOP,DR TO YARD L1: 2 BEDROOMS,EIK,LR,FOYER,FULL BATH/GARAGE SIDE ENTRANCE L2: EIK,LR/DR COMBO,FULL BATH, 3 BEDROOMS L3: ATTIC,CRAWL STORAGE
Key facts
- 3,300 sq ft lot
- Garage
- Built 1974
Neighborhood map
What this means for you Summary
Snapshot
- This is a 2 × 2-bed/2.8-bath units multifamily listed at $800k.
Deal economics
- At list price, monthly cash flow is $-164 ($-2k/yr) — negative. Per door: $-82/mo.
- To cash-flow at today's rent, offer at most $771k (3.6% below list).
- To meet the 1% rule (rent ≥ 1% of price), the offer needs to be $622k (22.2% below list).
- Recommended offer: $622k (22.2% below list) — sets the bar for 1% rule.
- Cap rate 6.0% vs local median 2.6% in New York — top-decile yield for the area; either an underpriced asset or a hidden risk that comps aren't pricing in. Stress-test before assuming the spread holds.
Location & tenants
- Location reads 75/100 on livability (#268 in NY, #4,188 nationally) — a middle-class / working-renter tenant base. Strengths: amenities A+, commute A+, health & safety A; Watch: crime F, cost of living F.
- Zoned schools: Staten Island School of Civic Leadership (math 47% / reading 67%, grade C+, #842 of 2,108 statewide, top 43%, 838 students, 76% FRL); Jhs 383 Philippa Schuyler (math 32% / reading 67%, grade C, #280 of 729 statewide, top 40%, 822 students, 85% FRL); Midwood High School (math 94% / reading 96%, grade A+, #83 of 1,100 statewide, top 8%, 4,062 students, 73% FRL).
- Market conditions: Rents rising (+3.9%/yr); 499 active listings in the ZIP; 3 comparable units currently listed for rent nearby; rentals at typical pace (median 27d on market — plan ~3-4 weeks tenant-placement turnaround); solid renter incomes; 480 units permitted in Richmond County in 2024 (22 in 5+ unit buildings).
- At $6,224/mo this rent would consume 71% of the median local household income ($105k/yr) (locally 2168% of renters already pay >50% of income on rent) — very limited rent-growth headroom before tenants either downsize or default.
Forward outlook
- Local home prices are declining (-3.0%/yr); year-one equity from $6k of loan paydown is wiped out by about $24k of value loss. Plan a longer hold.
- Richmond County population projected to shrink 5% by 2050 — rents likely to lag national; underwrite the cash flow, not the appreciation.
Negotiation context
- It's been on market 77 days — a 6% lower offer ($752k) is reasonable based on typical stale-listing flexibility.
- 2 sale attempts since 27y ago with the ask held roughly flat each time — persistent listings suggest the price (not the market) is what's stuck; bring a comps-based counter.
- Current owner paid $222k; list at $800k implies a 260% gain — meaningful room to come down on a strong offer.
Risks & watch-outs
- Climate carrying-cost: moderate flood risk; major wind risk, 51% chance of damaging wind over 30y; extreme-heat days projected 7→15/yr by 2055 (HVAC capex compounding) — expect insurance premiums to compound above CPI over the hold.
Questions for the listing agent
- What do current leases actually rent for vs. the listed asking? Can we see a recent rent roll and the last 12 months of T-12 income?
- It's been on market 77 days. Have you received any prior offers? Is the seller open to a 22% concession, seller financing, or rate buy-down credit?
- Can we see the unit-by-unit rent roll, current vacancy, and any below-market leases? What's the average tenancy length?
- What capital expenditures (roof, boiler, parking lot, exteriors) have been made in the last 5 years, and what's planned in the next 2?
- Built in 1974 — when were the roof, HVAC, electrical panel, plumbing, and water heater last replaced?
- Why hasn't it sold? Are there any deal-killer items the seller is aware of (foundation, flood, title, zoning, code violations)?
- Is there a deadline driving the sale (1031 exchange, divorce, estate, relocation)? That informs how much negotiation room exists.
- Schools are B-rated — typically a magnet for longer-tenancy family renters. What's the average tenant stay here, and is there a school-zone premium baked into asking?
- Crime grade is F in this area — have there been break-ins, vandalism, or insurance claims at this property in the last 3 years? What carrier currently insures it and at what premium?
- The area grade is low — what's the realistic commute time and amenity access for the typical tenant pool here? Any planned neighborhood developments (good or bad) we should know about?
- What's the average days-on-market for RENTAL listings here right now (not sales)? A rising rental-DOM trend means longer vacancies and softer asking-rent achievability than the comps imply.
- What's the recent tenant-quality profile in this submarket — average credit score on applications, eviction rate, late-payment / NSF rate, and stable-employment percentage? A property-management company in the area should have these aggregated.
- How much new apartment / multifamily construction is in the pipeline within 1–3 miles? Heavy new supply (>2% of stock underway) typically softens rents 12–24 months out; light construction supports rent growth.
Investment metrics
- 1% rule
- 0.78% ✗
- Cap rate
- 6.05%
- Cash-on-cash
- -0.88%
- DSCR
- 0.96
- GRM
- 10.7
CMA / ARV
- ARV (on-the-fly)
- $845,104
- Comps found
- 11
Show comp detail 11 sales within ~0.75 mi
| Address | Dist | Beds/Ba | Sqft | Sold | Price | $/sf | Match |
|---|---|---|---|---|---|---|---|
| 95 Regis Dr | 0.21mi | 5/3.0 (+1) | 1,896 (-1%) | 8mo | $838,000 | $442 | 66 |
| 191 Lamberts Ln | 0.31mi | 5/3.0 (+1) | 1,860 (-3%) | 3mo | $935,000 | $503 | 63 |
| 37 Ludwig Ln | 0.22mi | 4/1.0 | 2,000 (+5%) | 6mo | $750,000 | $375 | 59 |
| 151 Amity Pl | 0.19mi | 3/2.5 (-1) | 1,800 (-6%) | 10mo | $747,000 | $415 | 56 |
| 11 Firth Rd | 0.75mi | 3/4.5 (-1) | 1,960 (+2%) | 2mo | $995,000 | $508 | 50 |
| 61 Comstock Ave | 0.17mi | 3/2.0 (-1) | 1,700 (-11%) | 7mo | $730,000 | $429 | 49 |
| 147 Kirshon Ave | 0.40mi | 4/3.5 | 2,114 (+11%) | 8mo | $990,000 | $468 | 48 |
| 44 Oliver Pl | 0.62mi | 4/2.5 | 1,980 (+4%) | 16mo | $865,000 | $437 | 40 |
| 24 Nadal Pl | 0.60mi | 5/2.0 (+1) | 2,022 (+6%) | 7mo | $720,000 | $356 | 37 |
| 8 Nadal Pl | 0.57mi | 4/2.0 | 2,100 (+10%) | 8mo | $970,000 | $462 | 36 |
| 90 Levit Ave | 0.69mi | 4/4.0 | 2,184 (+14%) | 4mo | $1,075,000 | $492 | 34 |
Match score weights: distance 35% · size 25% · config 20% · recency 20%. Top-matched comps best support the ARV.
Projected returns pro-forma
-3.0% appreciation · 3.93% rent growth · sell at horizon
- IRR
- -16.8%
- Equity multiple
- 0.40×
- Total profit
- $-134,403
- Equity at exit
- $119,282
- IRR
- -7.2%
- Equity multiple
- 0.52×
- Total profit
- $-106,666
- Equity at exit
- $69,169
Cash invested: $224,000 (down + closing). Projections, not guarantees.
Landlord ↔ Tenant lean methodology
- Overall (CITY)
- 0 Strongly Tenant-Friendly
- State New York
- 15 Strongly Tenant-Friendly · D+10
- County
- — inherits STATE
- City New York
- 0 Strongly Tenant-Friendly · D+34
ZIP-level market 10314
- Rents YoY
- 3.9%
- Active inventory
- 499
- Price-to-rent
- 21.4×
Monthly cashflow live
- Estimated rent
- $6,224 medium interval (Pro) →
- Mortgage (P&I)
- −$4,195
- Tax from tax record
- −$553 /mo · $6,632/yr
- Insurance
- −$333
- HOA
- −$0
- Lot rent
- −$0
- Vacancy / Maint / Mgmt
- −$1,307
- Net cashflow
- $-164
Break-even live
Sensitivity live
| Price | -10% $289 | -5% $62 | +0% $-164 | +5% $-391 | +10% $-617 |
|---|---|---|---|---|---|
| Rent | -10% $-656 | -5% $-410 | +0% $-164 | +5% $82 | +10% $327 |
| Rate | -1.0pp $239 | -0.5pp $39 | base $-164 | +0.5pp $-372 | +1.0pp $-583 |
2-unit breakdown (identical units grouped — click to expand)
| Units | Beds | Baths | Est. rent |
|---|---|---|---|
| 2× units | 2 | 2.8 | $6,224 |
| #1 | 2 | 2.8 | $3,112 |
| #2 | 2 | 2.8 | $3,112 |
| Total (2 units) | $6,224 | ||
UW: 25.0% down · 7.5% · 30yr · 1.5% tax · 5.0% vac · 8.0% maint · 8.0% mgmt
Financing live
Cash to close
- Down payment
- $200,000
- Closing costs
- $24,000
- Reserves months
- —
- Total cash needed
- —
Loan-product check · same deal, 3 products live
Conventional
25% down · 7.5% · 30yr
- Down + closing
- —
- Monthly P&I
- —
- Monthly cashflow
- —
- DSCR
- —
- Eligible?
- —
Personal DTI + credit; lowest rate.
DSCR
20% down · 8.5% · 30yr
- Down + closing
- —
- Monthly P&I
- —
- Monthly cashflow
- —
- DSCR
- —
- Eligible?
- —
No personal income docs; deal must DSCR.
Hard money
10% down · 12.0% · 12mo
- Down + closing
- —
- Monthly P&I
- —
- Monthly cashflow
- —
- DSCR
- —
- Eligible?
- —
Short-term bridge; refi at stabilization.
Rent comps 3 comps
| Address | Beds | Baths | Sqft | Rent | $/sqft | DOM | Units | Dist |
|---|---|---|---|---|---|---|---|---|
| 581 W Caswell Ave Unit 2 Staten Island, NY | 3.0 | 2.0 | 2292 | $3,200 | $1.40 | 17d | 1 | 0.39mi |
| 110 Spartan Ave Unit 2 Staten Island, NY | 3.0 | 1.5 | 2400 | $3,500 | $1.46 | 27d | 1 | 0.44mi |
| 147 Vedder Ave Unit 1 Staten Island, NY | 3.0 | 3.0 | 2188 | $3,800 | $1.74 | 27d | 1 | 0.87mi |
Listing history 7 events
-
2026-04-27status Pending
-
2026-02-09$799,999 Active
-
2026-02-02historical
-
2026-01-24historical
-
2000-01-04soldstatus $222,000
-
1999-09-17soldstatus $222,000 377-char remark
Show marketing remark (377 chars)
SPACIOUS 3 BR SEMI,NEW FULL BA,NEW HW HEATER,NEW ROOF,3 CAR DRVWY + GARAGE,CLOSE TO SHOPPING & TRANSPORT. HOMEOWNERS WARRANTY SUBJECT TO E & O. SB PAYS $25 SUB FEE. Level 1: B: FULL,1/2 BATH,LOTS OF CLOSETS,KIT,LNDRY RM,WORKSHOP,DR TO YARD L1: 2 BEDROOMS,EIK,LR,FOYER,FULL BATH/GARAGE SIDE ENTRANCE L2: EIK,LR/DR COMBO,FULL BATH, 3 BEDROOMS L3: ATTIC,CRAWL STORAGE
-
1999-02-15$219,900 377-char remark
Show marketing remark (377 chars)
SPACIOUS 3 BR SEMI,NEW FULL BA,NEW HW HEATER,NEW ROOF,3 CAR DRVWY + GARAGE,CLOSE TO SHOPPING & TRANSPORT. HOMEOWNERS WARRANTY SUBJECT TO E & O. SB PAYS $25 SUB FEE. Level 1: B: FULL,1/2 BATH,LOTS OF CLOSETS,KIT,LNDRY RM,WORKSHOP,DR TO YARD L1: 2 BEDROOMS,EIK,LR,FOYER,FULL BATH/GARAGE SIDE ENTRANCE L2: EIK,LR/DR COMBO,FULL BATH, 3 BEDROOMS L3: ATTIC,CRAWL STORAGE
ⓘ Source: listings_history table (triggers on properties + properties_extension) + one-shot
backfill from property_details.listing_events for pre-trigger history.
Tax reassessment forecast NY · Partial reset (capped growth)
- Current annual tax
- $6,632 · $553/mo
- Projected year-2 tax
- $10,076 · $840/mo
- Expected delta
- +$3,444/yr (+$287/mo · 51.9%)
ⓘ Screening estimate from a state-policy table — verify with the county assessor before closing.
Climate risk First Street
- Flood 5/10 Major FEMA zone X (unshaded) · 65% chance over 30 yrs
- Wildfire 1/10 Low
- Heat 7/10 Severe 7 d/yr ≥98°F today · 15 d/yr by 30 yrs out
- Wind 6/10 Major 51% chance of damaging wind over 30 yrs
- Air quality 4/10 Moderate 5 unhealthy d/yr today · 6 by 30 yrs out
Nearby sold comps map
Loading sold comps map…
Walkable amenities ~0.75 mi
Loading nearby amenities…
Taxation est. · year 1
- Rental income
- $74,688
- − Mortgage interest
- −$44,812
- − Property taxes
- −$6,632
- − Insurance
- −$4,000
- − Repairs & maintenance
- −$5,975
- − Management
- −$5,975
- − Depreciation
- −$23,273
- Taxable loss
- −$15,979
- Est. tax savings @ 24.0%
- +$3,835
- After-tax cash flow
- $1,863/yr
For passive investors: Depreciation is non-cash, so a rental often shows a tax loss while cash-flowing — sheltering income. Rental losses are passive: they offset passive income freely, and up to $25,000/yr can offset ordinary (W-2) income if you actively participate and your MAGI is under $100k (phasing out to $0 by $150k); unused losses carry forward. On sale, claimed depreciation is recaptured at up to 25%, and gains may owe capital-gains tax (a 1031 exchange can defer both). Figures are a year-1 estimate at your 24.0% rate — not tax advice; consult a CPA.
Schools (NCES district)
No district data.
Livability — New York
- Score
- 75/100
- State rank
- #268
- US rank
- #4188
Category grades
Schools grade is shown separately in the Schools card above.
Census & demographics
- Census place
- New York, NY
- County
- Richmond County · 404,174 people
- City population
- 7,731,280
- Metro
- New York-Newark-Jersey City, NY-NJ-PA
- Population (ZIP)
- 93,915
- Household income
- $104,613
- Rent vs Own
- Severe rent burden
- 2168.0
Population outlook (Richmond County) Hauer SSP2
- Today (2025)
- 482,784 people
- By 2030
- 481,831 · -0.2%
- By 2040
- 473,159 · -2.0%
- By 2050
- 457,242 · -5.3%
- By 2075
- 408,029 · -15.5%
- By 2100
- 341,459 · -29.3%
Race, ethnicity, and origin ACS 2023
- Neighborhood character
- Diverse neighborhood (Simpson 0.58)
- Race & ethnicity
- White 60% Asian 19% Hispanic / Latino 15% Two or more races 8% Black 4%
- Hispanic origin (detail)
- Mexican 3% Puerto Rican 7% Dominican 1%
- Common ancestry
- Romanian 4% Scotch-Irish 2% Subsaharan African 1%
- Foreign-born
- 28% · Canada, China, South Korea
- Languages at home
- 61% English-only · Spanish 9% Chinese 7% Other Indo-European 7%
Political lean MEDSL · Richmond
- 2024 margin
- Strong R (+29.8) · D 35.1% · R 64.9%
- 2008→2024 swing
- -25.7pp toward R · 2008: -4.0pp · 2024: -29.8pp
- All cycles
- 2024: R+29.8 2020: R+14.9 2016: R+16.8 2012: D+0.8 2008: R+4.0
Not yet ingested
- Civics
- —
Market trends
- HPI YoY
- ▼ -553.73%
- Current HPI
- 378.3872
- Rent YoY
- ▲ 3.93%
- Metro
- New York-Newark-Jersey City, NY-NJ-PA
- State GDP YoY
- ▲ 2.60%
- F500 in state
- 92
Industry mix (Fortune 500 HQ in NY)
| Industry | F500 HQs | Revenue |
|---|---|---|
| Financial Services | 10 | $950B |
|
||
| Consumer Goods | 9 | $162B |
|
||
| Insurance | 4 | $225B |
|
||
| Telecommunications | 2 | $144B |
|
||
| Pharmaceuticals | 2 | $112B |
|
||
| Media / Entertainment | 2 | $69B |
|
||
Price history
+263.8% since first listed7 events — show timeline
- 2026-04-27 Pending — SIBORMLS
- 2026-02-09 Listed $799,999 SIBORMLS
- 2026-02-02 Listing Removed — SIBORMLS
- 2026-01-24 Coming Soon — SIBORMLS
- 2000-01-04 Sold (Public Records) $222,000 Public Records
- 1999-09-17 Sold (MLS) $222,000 SIBORMLS
- 1999-02-15 Listed $219,900 SIBORMLS
Property tax history
+4.5%/yrLatest (2025): $6,632 · +6.0% YoY. Source: county tax records.
Cash-flow waterfall
monthlySold comps — $/sqft
last 12 mo · ≤1 miLoading sold comps…