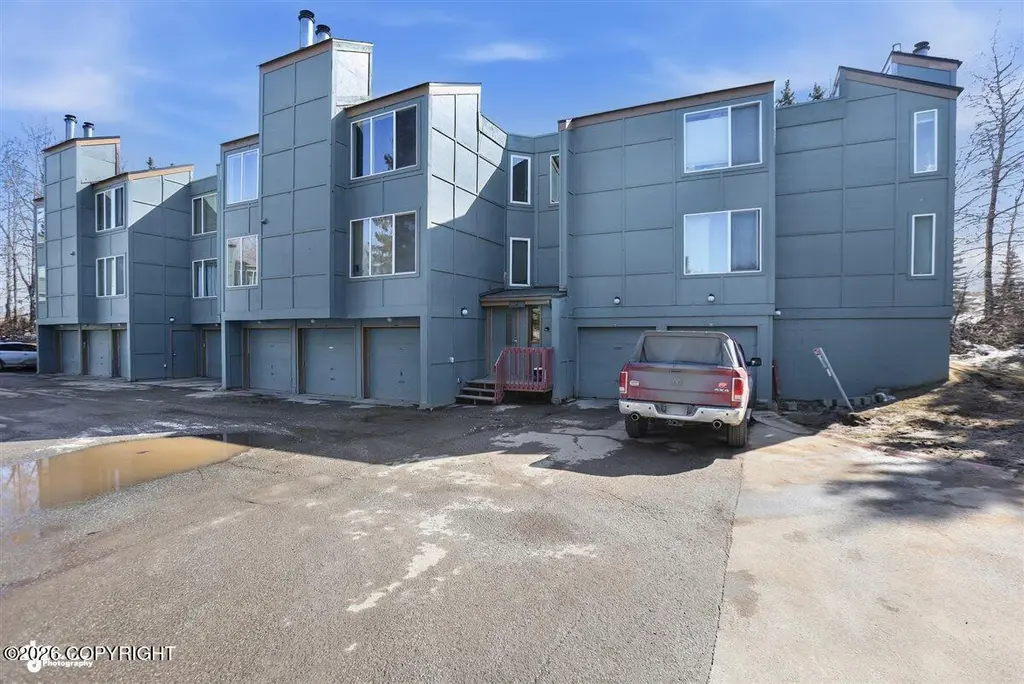
212 Sweetgale Ct #212 · Anchorage, AK
Flood risk 1/10 · Minimal
- FEMA flood zone
- X (unshaded)
- Chance of flooding over 30 yrs
- 0.0%
- Est. flood insurance / yr
- $507 – $1,088
Fire risk No data
- Est. fire insurance / yr
- —
Heat risk No data
- Hot days now (above threshold)
- —
- Hot days in 30 yrs
- —
Wind risk No data
- Chance of severe wind over 30 yrs
- —
Air-quality risk 1/10 · Minimal
- Unhealthy air days now
- —
- Unhealthy air days in 30 yrs
- —
Risk factors via First Street. Map © Google.
Why this score? — see what drove the D grade
The composite is a weighted blend of 9 inputs, each scored 0–100. Each bar is that input's sub-score; the figure is the points it added to the 100-point composite (weight × sub-score).
- Appreciation +8.1/10.0
- Cash flow +7.9/30.0
- ARV discount +7.5/15.0
- 1% rule +4.0/10.0
- Livability +3.9/5.0
- Schools +3.7/10.0
- Rent growth +2.5/5.0
- Condition / age +2.5/5.0
- DSCR +1.9/10.0
$240,000
🖨 Deal sheet (PDF) 📄 Offer letter ✓ Due diligence
Listing remarks
Beautifully updated 2 bed, 1.5 bath condo featuring abundant natural light and a bright, open feel throughout. The remodeled kitchen offers quartz countertops, pendant lighting, new oven/stove, added cabinetry, and a stylish marble backsplash, flowing seamlessly into the main living space. Enjoy luxury vinyl plank flooring throughout and a cozy fireplace with elegant marble surround, creating a modern yet inviting atmosphere. Zoned for Taku Elementary, Romig Middle, and West High School.
Key facts
- $420 HOA
- 2 garage spots
- Built 1978
Neighborhood map
What this means for you Summary
Snapshot
- This is a 2-bed/1.5-bath condo listed at $240k.
Deal economics
- At list price, monthly cash flow is $-258 ($-3k/yr) — negative.
- To cash-flow at today's rent, offer at most $194k (19.0% below list).
- To meet the 1% rule (rent ≥ 1% of price), the offer needs to be $215k (10.3% below list).
- Recommended offer: $194k (19.0% below list) — sets the bar for cash-flow.
- Cap rate 5.0% vs local median 3.8% in Anchorage — top-decile yield for the area; either an underpriced asset or a hidden risk that comps aren't pricing in. Stress-test before assuming the spread holds.
Location & tenants
- Location reads 78/100 on livability (#6 in AK, #2,553 nationally) — a middle-class / working-renter tenant base. Strengths: amenities A+, commute A+, employment A+; Watch: crime F, cost of living F.
- Anchorage School District (urban): math 37% / reading 43% proficiency, ranked #6 of 21 in AK (top 29%) — families likely to look elsewhere, expect single-tenant / working-renter base with shorter leases.
- Zoned schools: Taku Elementary (math 22% / reading 27%, grade F, #122 of 156 statewide, top 81%, 286 students, 72% FRL); Romig Middle School (math 24% / reading 44%, grade F, #22 of 36 statewide, top 63%, 720 students, 37% FRL); West High School (math 32% / reading 27%, grade F, #39 of 61 statewide, top 65%, 1,763 students, 40% FRL).
- Market conditions: 51 active listings in the ZIP; 21 comparable units currently listed for rent nearby; rentals at typical pace (median 26d on market — plan ~3-4 weeks tenant-placement turnaround); solid renter incomes; 306 units permitted in Anchorage Municipality in 2024 (90 in 5+ unit buildings).
Forward outlook
- In year one you build about $17k of equity ($2k loan paydown + $15k appreciation (6.2% local appreciation)).
- Anchorage County population projected at +12% by 2050 — modest demand growth; plan on rents tracking national, not racing it.
- By year 3, paydown + projected appreciation supports a ~$41k cash-out refi (75% LTV) — recoverable capital for the next deal without selling this one.
Negotiation context
- Only 2 days on market — expect competitive offers; lowballing is unlikely to land.
- 3 sale attempts since 32y ago with the ask held roughly flat each time — persistent listings suggest the price (not the market) is what's stuck; bring a comps-based counter.
Questions for the listing agent
- What do current leases actually rent for vs. the listed asking? Can we see a recent rent roll and the last 12 months of T-12 income?
- Built in 1978 — when were the roof, HVAC, electrical panel, plumbing, and water heater last replaced?
- What does the HOA fee cover, when was the last increase, and are there any pending special assessments or reserve-fund shortfalls?
- Any open or pending special assessments — roof, HVAC, plumbing, elevator, façade? What's the per-unit balance and payoff schedule, and is the seller paying it off at close or rolling it to the buyer?
- Is there a deadline driving the sale (1031 exchange, divorce, estate, relocation)? That informs how much negotiation room exists.
- Schools are B-rated — typically a magnet for longer-tenancy family renters. What's the average tenant stay here, and is there a school-zone premium baked into asking?
- Crime grade is F in this area — have there been break-ins, vandalism, or insurance claims at this property in the last 3 years? What carrier currently insures it and at what premium?
- The area grade is low — what's the realistic commute time and amenity access for the typical tenant pool here? Any planned neighborhood developments (good or bad) we should know about?
- What's the average days-on-market for RENTAL listings here right now (not sales)? A rising rental-DOM trend means longer vacancies and softer asking-rent achievability than the comps imply.
- What's the recent tenant-quality profile in this submarket — average credit score on applications, eviction rate, late-payment / NSF rate, and stable-employment percentage? A property-management company in the area should have these aggregated.
- How much new apartment / multifamily construction is in the pipeline within 1–3 miles? Heavy new supply (>2% of stock underway) typically softens rents 12–24 months out; light construction supports rent growth.
Investment metrics
- 1% rule
- 0.90% ✗
- Cap rate
- 5.00%
- Cash-on-cash
- -4.61%
- DSCR
- 0.79
- GRM
- 9.3
CMA / ARV
No comps found within radius.
Projected returns pro-forma
6.2% appreciation · 3.0% rent growth · sell at horizon
- IRR
- 12.2%
- Equity multiple
- 1.83×
- Total profit
- $55,856
- Equity at exit
- $153,835
- IRR
- 12.9%
- Equity multiple
- 3.63×
- Total profit
- $176,890
- Equity at exit
- $281,566
Cash invested: $67,200 (down + closing). Projections, not guarantees.
Landlord ↔ Tenant lean methodology
- Overall (STATE)
- 80 Strongly Landlord-Friendly
- State Alaska
- 80 Strongly Landlord-Friendly · R+8
- County
- — inherits STATE
- City
- — inherits STATE
ZIP-level market 99518
- Home prices YoY
- 2.1%
- Active inventory
- 51
- Price-to-rent
- 9.3×
Monthly cashflow live
- Estimated rent
- $2,153 high interval (Pro) →
- Mortgage (P&I)
- −$1,259
- Tax from tax record
- −$180 /mo · $2,160/yr
- Insurance
- −$100
- HOA
- −$420
- Lot rent
- −$0
- Vacancy / Maint / Mgmt
- −$452
- Net cashflow
- $-258
Break-even live
Sensitivity live
| Price | -10% $-122 | -5% $-190 | +0% $-258 | +5% $-326 | +10% $-394 |
|---|---|---|---|---|---|
| Rent | -10% $-428 | -5% $-343 | +0% $-258 | +5% $-173 | +10% $-88 |
| Rate | -1.0pp $-137 | -0.5pp $-197 | base $-258 | +0.5pp $-320 | +1.0pp $-384 |
UW: 25.0% down · 7.5% · 30yr · 1.5% tax · 5.0% vac · 8.0% maint · 8.0% mgmt
Financing live
Cash to close
- Down payment
- $60,000
- Closing costs
- $7,200
- Reserves months
- —
- Total cash needed
- —
Loan-product check · same deal, 3 products live
Conventional
25% down · 7.5% · 30yr
- Down + closing
- —
- Monthly P&I
- —
- Monthly cashflow
- —
- DSCR
- —
- Eligible?
- —
Personal DTI + credit; lowest rate.
DSCR
20% down · 8.5% · 30yr
- Down + closing
- —
- Monthly P&I
- —
- Monthly cashflow
- —
- DSCR
- —
- Eligible?
- —
No personal income docs; deal must DSCR.
Hard money
10% down · 12.0% · 12mo
- Down + closing
- —
- Monthly P&I
- —
- Monthly cashflow
- —
- DSCR
- —
- Eligible?
- —
Short-term bridge; refi at stabilization.
Rent comps 21 comps
| Address | Beds | Baths | Sqft | Rent | $/sqft | DOM | Units | Dist |
|---|---|---|---|---|---|---|---|---|
| 6388 Fairweather Dr Anchorage, AK | 3.0 | 2.0 | 1372 | $2,500 | $1.82 | 46d | 1 | 0.29mi |
| 5911 Denali St Unit B2 Anchorage, AK | 3.0 | 1.5 | 1100 | $1,700 | $1.55 | 25d | 1 | 0.62mi |
| 7308 Chugach Meadows Loop Anchorage, AK | 2.0 | 2.5 | 1240 | $2,550 | $2.06 | 16d | 1 | 0.64mi |
| 7310 Chugach Meadows Loop Anchorage, AK | 2.0 | 2.0 | 1028 | $2,399 | $2.33 | 23d | 1 | 0.64mi |
| 701 E 78th Ave Unit 705 Anchorage, AK | 2.0 | 2.0 | 1020 | $2,450 | $2.40 | 16d | 1 | 0.64mi |
| 7330 Meadow St Anchorage, AK | 2.0 | 2.0 | 1028 | $2,399 | $2.33 | 25d | 1 | 0.67mi |
| 7371 Huntsmen Cir Unit 16A Anchorage, AK | 2.0 | 2.0 | 741 | $1,995 | $2.69 | 46d | 1 | 0.71mi |
| 290 E 56th Ave Unit 290 Anchorage, AK | 2.0 | 2.0 | 1500 | $2,300 | $1.53 | 46d | 1 | 0.77mi |
| 7538 Foxridge Way Unit 8H8H Anchorage, AK | 2.0 | 2.0 | 741 | $2,500 | $3.37 | 16d | 1 | 0.80mi |
| 1674 Woodroe Ln #14 Anchorage, AK | 3.0 | 2.0 | 1365 | $2,500 | $1.83 | 46d | 1 | 0.82mi |
| 5215 Mockingbird Dr Anchorage, AK | 2.0 | 1.0 | 642 | $1,700 | $2.65 | 16d | 10 | 0.95mi |
| 2134 E 56th Ave Anchorage, AK | 1.0–2.0 | 1.0–2.0 | 1015 | $2,839 | $2.80 | 16d | 8 | 1.01mi |
| 2237 E 56th Ave Anchorage, AK | 1.0–2.0 | 1.0–2.0 | 681 | $1,819 | $2.67 | 23d | 6 | 1.14mi |
| 1041 W 77th Ave Anchorage, AK | 2.0 | 1.5 | 1448 | $2,700 | $1.86 | 25d | 1 | 1.22mi |
| 5360 Lake Otis Pkwy Unit 04 Anchorage, AK | 2.0 | 1.0 | 850 | $1,695 | $1.99 | 25d | 1 | 1.25mi |
| 4631 Juneau St Anchorage, AK | 1.0 | 1.0 | 765 | $1,375 | $1.80 | 25d | 1 | 1.27mi |
| 2230 E 52nd Ave #4 Anchorage, AK | 2.0 | 1.0 | 1015 | $1,950 | $1.92 | 46d | 1 | 1.28mi |
| 5300 Lake Otis Pkwy Unit 11 Anchorage, AK | 2.0 | 1.0 | 850 | $1,695 | $1.99 | 16d | 1 | 1.28mi |
| 4611 Juneau St Anchorage, AK | 1.0–2.0 | 1.0 | 800 | $1,750 | $2.19 | 46d | 1 | 1.29mi |
| 1008 W 80th Ave Anchorage, AK | 3.0 | 1.5 | 1267 | $2,400 | $1.89 | 46d | 1 | 1.31mi |
| 2969 Silver Chase Ct Anchorage, AK | 3.0 | 2.0 | 1388 | $2,700 | $1.95 | 46d | 1 | 1.42mi |
HOA detail condo
- Monthly dues
- $420 · $5,040/yr
- Assessments
- None detected in remarks — confirm with the listing agent.
Listing history 7 events
-
2026-04-27status Pending
-
2026-04-25$240,000 Active
-
2018-09-19$152,000
-
2013-02-13soldstatus
-
2005-11-02soldstatus
-
2004-02-09soldstatus
-
1994-03-28$65,000
ⓘ Source: listings_history table (triggers on properties + properties_extension) + one-shot
backfill from property_details.listing_events for pre-trigger history.
Tax reassessment forecast AK · Partial reset (capped growth)
- Current annual tax
- $2,160 · $180/mo
- Projected year-2 tax
- $2,508 · $209/mo
- Expected delta
- +$348/yr (+$29/mo · 16.1%)
ⓘ Screening estimate from a state-policy table — verify with the county assessor before closing.
Climate risk First Street
- Flood 1/10 Low FEMA zone X (unshaded) · 0% chance over 30 yrs
- Air quality 1/10 Low
Nearby sold comps map
Loading sold comps map…
Walkable amenities ~0.75 mi
Loading nearby amenities…
Taxation est. · year 1
- Rental income
- $25,830
- − Mortgage interest
- −$13,444
- − Property taxes
- −$2,160
- − Insurance
- −$1,200
- − Repairs & maintenance
- −$2,066
- − Management
- −$2,066
- − HOA
- −$5,040
- − Depreciation
- −$6,982
- Taxable loss
- −$7,128
- Est. tax savings @ 24.0%
- +$1,711
- After-tax cash flow
- $-1,386/yr
For passive investors: Depreciation is non-cash, so a rental often shows a tax loss while cash-flowing — sheltering income. Rental losses are passive: they offset passive income freely, and up to $25,000/yr can offset ordinary (W-2) income if you actively participate and your MAGI is under $100k (phasing out to $0 by $150k); unused losses carry forward. On sale, claimed depreciation is recaptured at up to 25%, and gains may owe capital-gains tax (a 1031 exchange can defer both). Figures are a year-1 estimate at your 24.0% rate — not tax advice; consult a CPA.
Schools (NCES district)
- District
- Anchorage School District
- NCES district ID
- 0200180
- Math proficiency
- 37% ▼ -2.00%
- Reading proficiency
- 43% ▲ 1.00%
- Median HH income
- $76,447
- Composite
- 37.0/100
- National rank
- #4523
- State rank
- #6 of 21 in AK
Livability — Anchorage
- Score
- 78/100
- State rank
- #6
- US rank
- #2553
Category grades
Schools grade is shown separately in the Schools card above.
Census & demographics
- Census place
- Anchorage, AK
- County
- Anchorage Borough · 246,594 people
- City population
- 218,117
- Metro
- Anchorage, AK
- Population (ZIP)
- 9,764
- Household income
- $93,995
- Rent vs Own
- Severe rent burden
- 385.0
Population outlook (Anchorage County) Hauer SSP2
- Today (2025)
- 314,993 people
- By 2030
- 321,771 · +2.2%
- By 2040
- 335,493 · +6.5%
- By 2050
- 352,799 · +12.0%
- By 2075
- 414,771 · +31.7%
- By 2100
- 474,485 · +50.6%
Race, ethnicity, and origin ACS 2023
- Neighborhood character
- Diverse neighborhood (Simpson 0.67)
- Race & ethnicity
- White 56% Two or more races 17% Hispanic / Latino 12% Black 7% Native American 5% Asian 4%
- Hispanic origin (detail)
- Mexican 6% Puerto Rican 1%
- Common ancestry
- Portuguese 4% Lithuanian 2% Romanian 2%
- Foreign-born
- 6% · Canada, South Korea, China
- Languages at home
- 91% English-only · Spanish 5% Tagalog/Filipino 2% Korean 1%
Political lean MEDSL · Anchorage
- 2024 margin
- D (+12.7) · D 56.3% · R 43.7%
- 2016→2024 swing
- +27.9pp toward D · 2016: -15.2pp · 2024: 12.7pp
- All cycles
- 2024: D+12.7 2016: R+15.2
Not yet ingested
- Civics
- —
Market trends
- HPI YoY
- ▲ 6.20%
- Current HPI
- 294.8217
- Rent YoY
- —
- Metro
- Anchorage, AK
- State GDP YoY
- —
- F500 in state
- 0
Price history
+269.2% since first listed7 events — show timeline
- 2026-04-27 Pending — AKMLS
- 2026-04-25 Listed $240,000 AKMLS
- 2018-09-19 Listed $152,000 AKMLS
- 2013-02-13 Sold (Public Records) — Public Records
- 2005-11-02 Sold (Public Records) — Public Records
- 2004-02-09 Sold (Public Records) — Public Records
- 1994-03-28 Listed $65,000 AKMLS
Property tax history
+1.5%/yrLatest (2025): $2,160 · +29.2% YoY. Source: county tax records.
Cash-flow waterfall
monthlySold comps — $/sqft
last 12 mo · ≤1 miLoading sold comps…