3871 Grosh Dr · Antrim, PA
Flood risk 1/10 · Minimal
- FEMA flood zone
- X (unshaded)
- Chance of flooding over 30 yrs
- 0.0%
- Est. flood insurance / yr
- $507 – $1,088
Fire risk 3/10 · Minor
- Est. fire insurance / yr
- $511 – $949
Heat risk 5/10 · Moderate
- Hot days now (above 100°F)
- 7 days/yr
- Hot days in 30 yrs
- 16 days/yr
Wind risk 2/10 · Minimal
- Chance of severe wind over 30 yrs
- 3.0%
Air-quality risk 1/10 · Minimal
- Unhealthy air days now
- 0 days/yr
- Unhealthy air days in 30 yrs
- 0 days/yr
Risk factors via First Street. Map © Google.
Why this score? — see what drove the B- grade
The composite is a weighted blend of 9 inputs, each scored 0–100. Each bar is that input's sub-score; the figure is the points it added to the 100-point composite (weight × sub-score).
- Cash flow +30.0/30.0
- 1% rule +10.0/10.0
- DSCR +10.0/10.0
- ARV discount +7.5/15.0
- Schools +4.7/10.0
- Rent growth +2.5/5.0
- Livability +2.5/5.0
- Condition / age +2.2/5.0
- Appreciation +0.0/10.0
$54,000
🖨 Deal sheet 📄 Offer letter ✓ Due diligence
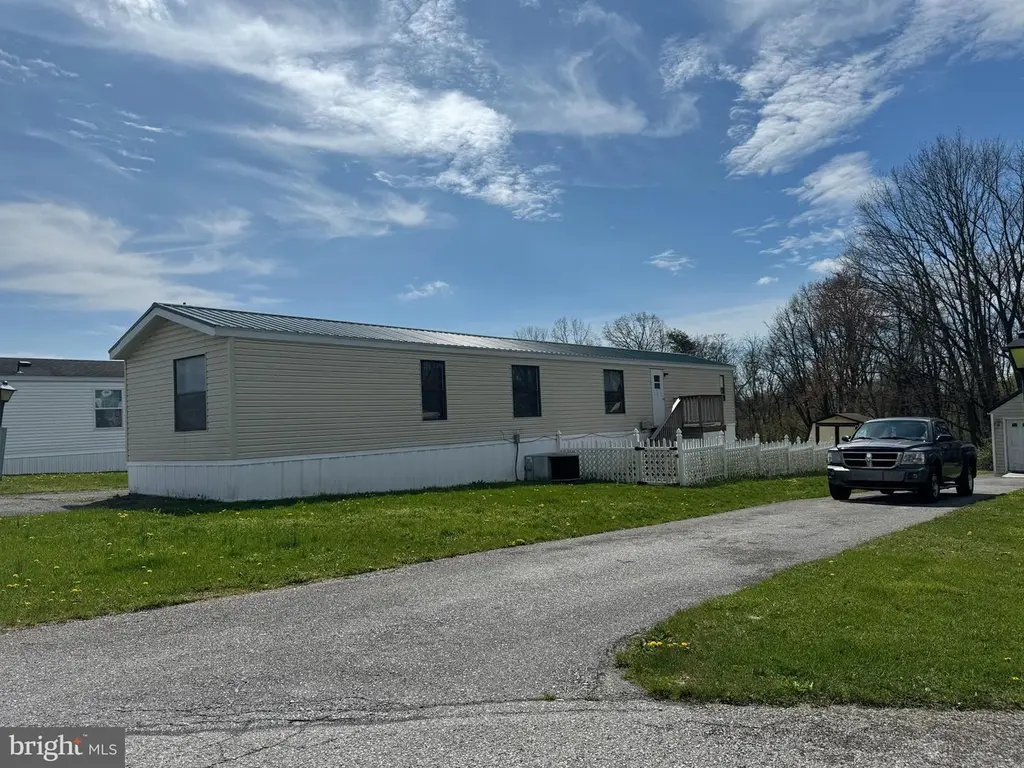
Listing remarks
Picture yourself here--this spacious three bedroom, two bathroom mobile home is located in a small mobile home park in a country setting! The home has newer carpet throughout and newer vinyl flooring in the kitchen. There is an updated full bath also with newer vinyl flooring. A small fenced in area off the back entrance is perfect for small children or a small dog. The main entrance has ramp access with a covered porch. The property comes with a shed and has a nice yard with a small section of woods as the backdrop. Very low taxes at less than $200 per year! The owner is willing to finance a portion of the purchase. The seller is building a home which is anticipated to be completed in J
Key facts
- Fenced in area
- Covered porch
- Updated full bath
Tags
Property features AI
Finance
- Financial info: Monthly ground rent payment of $425
Exterior
- Parking: Driveway parking for 2 vehicles; Total of 2 garage/parking spaces
- Utilities: Private/community water; Private sewer; Electric utilities
- Home design: Detached modular/manufactured home; Effective year renovated 2024; Average property condition; Ground rent ownership
- Construction: Metal roof; Other foundation; Storm windows
- Exterior features: Play area; Awnings; Vinyl fencing; Balcony; Deck(s); Shed
Interior
- Kitchen: Electric oven/range; Range hood; Refrigerator
- Bedrooms: Three bedrooms on the main level
- Flooring: Carpet; Vinyl
- Bathrooms: Two full bathrooms on the main level
- Heating & cooling: Electric heat pump; Central air (electric); Electric hot water
- Interior features: Ceiling fans; Eat-in kitchen; Carpeted areas
- Laundry & utility: Washer/dryer hookups
Neighborhood map
What this means for you Summary
Snapshot
- This is a 3-bed/2.0-bath single-family listed at $54k. Condition is rated fair.
Deal economics
- At list price, monthly cash flow is $894 ($11k/yr) — positive.
- The deal already cash-flows at list — no discount required.
- Meets the 1% rule at list price ($2k rent vs $54k).
- Recommended offer: $53k (1.5% below list) — sets the bar for market timing.
Location & tenants
- Location reads: area grade B — affects rentability + tenant quality, not the cash-flow math above.
- Greencastle-Antrim SD (suburban): math 43% / reading 65% proficiency, ranked #118 of 539 in PA (top 22%) — acceptable for families but not a draw, mixed tenant base, ~2y average lease.
- Market conditions: 122 active listings in the ZIP; 633 units permitted in Franklin County in 2024 (112 in 5+ unit buildings).
Forward outlook
- Local home prices are declining (-3.0%/yr); year-one equity from $373 of loan paydown is wiped out by about $2k of value loss. Plan a longer hold.
- At projected returns (-3.0% appreciation + 3.0% rent growth), your $15k cash investment doubles in ~2 years — after that, you're playing with house money.
Negotiation context
- It's been on market 23 days — a 2% lower offer ($53k) is reasonable based on typical stale-listing flexibility.
Risks & watch-outs
- Climate carrying-cost: extreme-heat days projected 7→16/yr by 2055 (HVAC capex compounding) — expect insurance premiums to compound above CPI over the hold.
Questions for the listing agent
- Have any recent inspections been done? Can we get a copy of the seller's disclosures and any deferred-maintenance estimates?
- Is there a deadline driving the sale (1031 exchange, divorce, estate, relocation)? That informs how much negotiation room exists.
- What's the average days-on-market for RENTAL listings here right now (not sales)? A rising rental-DOM trend means longer vacancies and softer asking-rent achievability than the comps imply.
- What's the recent tenant-quality profile in this submarket — average credit score on applications, eviction rate, late-payment / NSF rate, and stable-employment percentage? A property-management company in the area should have these aggregated.
- How much new for-sale + rental construction is in the pipeline within 1–3 miles? Heavy new supply typically softens prices + rents 12–24 months out; constrained supply supports both.
Investment metrics
- 1% rule
- 2.97% ✓
- Cap rate
- 26.16%
- Cash-on-cash
- 70.95%
- DSCR
- 4.16
- GRM
- 2.8
CMA / ARV
- ARV (median comp)
- $183,872
- List price
- $54,000
- Delta
- -70.63%
- Verdict
- UNDERPRICED
- Comps
- 3 within 1.0 mi
Show comp detail 2 sales within ~0.75 mi
| Address | Dist | Beds/Ba | Sqft | Sold | Price | $/sf | Match |
|---|---|---|---|---|---|---|---|
| 7017 Guitner | 0.33mi | 2/1.0 (-1) | 864 (-14%) | 18mo | $175,000 | $203 | 37 |
| 3232 Enoch Brown Rd | 0.67mi | 3/1.0 | 1,104 (+10%) | 22mo | $244,000 | $221 | 31 |
Match score weights: distance 35% · size 25% · config 20% · recency 20%. Top-matched comps best support the ARV.
Projected returns pro-forma
-3.0% appreciation · 3.0% rent growth · sell at horizon
- IRR
- 70.6%
- Equity multiple
- 4.19×
- Total profit
- $48,214
- Equity at exit
- $8,052
- IRR
- 74.6%
- Equity multiple
- 8.63×
- Total profit
- $115,401
- Equity at exit
- $4,669
Cash invested: $15,120 (down + closing). Projections, not guarantees.
Landlord ↔ Tenant lean methodology
- Overall (STATE)
- 62 Landlord-Friendly
- State Pennsylvania
- 62 Landlord-Friendly · EVEN
- County
- — inherits STATE
- City
- — inherits STATE
ZIP-level market 17225
- Home prices YoY
- -19.0%
- Active inventory
- 122
- Price-to-rent
- 2.8×
Monthly cashflow live
- Estimated rent
- $1,604 medium interval (Pro) →
- Mortgage (P&I)
- −$283
- Tax est. 1.5%
- −$68 /mo · $810/yr
- Insurance
- −$22
- HOA
- −$0
- Vacancy / Maint / Mgmt
- −$337
- Net cashflow
- $894
Break-even live
UW: 25.0% down · 7.5% · 30yr · 1.5% tax · 5.0% vac · 8.0% maint · 8.0% mgmt
Financing live
Cash to close
- Down payment
- $13,500
- Closing costs
- $1,620
- Reserves months
- —
- Total cash needed
- —
Loan-product check · same deal, 3 products live
Conventional
25% down · 7.5% · 30yr
- Down + closing
- —
- Monthly P&I
- —
- Monthly cashflow
- —
- DSCR
- —
- Eligible?
- —
Personal DTI + credit; lowest rate.
DSCR
20% down · 8.5% · 30yr
- Down + closing
- —
- Monthly P&I
- —
- Monthly cashflow
- —
- DSCR
- —
- Eligible?
- —
No personal income docs; deal must DSCR.
Hard money
10% down · 12.0% · 12mo
- Down + closing
- —
- Monthly P&I
- —
- Monthly cashflow
- —
- DSCR
- —
- Eligible?
- —
Short-term bridge; refi at stabilization.
Listing history 7 events
-
2026-06-05days on market $54,000 Active 23 DOM
-
2026-06-03remarks 699-char remark
-
2026-06-02days on market $54,000 Active 21 DOM
-
2026-06-01days on market $54,000 Active 20 DOM
-
2026-05-31days on market $54,000 Active 19 DOM
-
2026-05-30days on market $54,000 Active 18 DOM
-
2026-05-12$54,000 Active 693-char remark
ⓘ Source: listings_history table (triggers on properties + properties_extension) + one-shot
backfill from property_details.listing_events for pre-trigger history.
Climate risk First Street
- Flood 1/10 Low FEMA zone X (unshaded) · 0% chance over 30 yrs
- Wildfire 3/10 Moderate
- Heat 5/10 Major 7 d/yr ≥100°F today · 16 d/yr by 30 yrs out
- Wind 2/10 Low 3% chance of damaging wind over 30 yrs
- Air quality 1/10 Low 0 unhealthy d/yr today · 0 by 30 yrs out
Nearby sold comps map
Loading sold comps map…
Walkable amenities ~0.75 mi
Loading nearby amenities…
Taxation est. · year 1
- Rental income
- $19,248
- − Mortgage interest
- −$3,025
- − Property taxes
- −$810
- − Insurance
- −$270
- − Repairs & maintenance
- −$1,540
- − Management
- −$1,540
- − Depreciation
- −$1,571
- Taxable income
- $10,493
- Est. tax owed @ 24.0%
- −$2,518
- After-tax cash flow
- $8,210/yr
For passive investors: Depreciation is non-cash, so a rental often shows a tax loss while cash-flowing — sheltering income. Rental losses are passive: they offset passive income freely, and up to $25,000/yr can offset ordinary (W-2) income if you actively participate and your MAGI is under $100k (phasing out to $0 by $150k); unused losses carry forward. On sale, claimed depreciation is recaptured at up to 25%, and gains may owe capital-gains tax (a 1031 exchange can defer both). Figures are a year-1 estimate at your 24.0% rate — not tax advice; consult a CPA.
Condition & rehab AI · 13 photos
This mobile home is in fair condition with some repairs and maintenance needed, particularly to the roof and exterior siding. A new roof and exterior paint would significantly improve its appearance and increase its resale value.
Repairs flagged
- Major roof — The satellite image shows visible rust and wear on the metal roof.
- Minor exterior siding — There is some discoloration and minor damage visible on the exterior siding.
- Minor interior walls — There is some discoloration and minor damage visible on the interior walls.
Value-add opportunities
- Resale repair roof — A new roof will significantly improve the home's appearance and increase its resale value.
- Resale paint exterior siding — Painting the exterior siding will improve the home's curb appeal and increase its resale value.
- Both repair and replace flooring — Repairing and replacing the flooring will improve the home's appearance and increase its resale and rental value.
Renovation cost estimate screening
| Repair item | Severity | Est. cost |
|---|---|---|
| roof · The satellite image shows visible rust and wear on the metal roof. | Major | $15,000–50,000 |
| exterior siding · There is some discoloration and minor damage visible on the exterior siding. | Minor | $500–3,000 |
| interior walls · There is some discoloration and minor damage visible on the interior walls. | Minor | $500–3,000 |
| Total estimated repair cost · 3 items | $16,000–56,000 |
Value-add ROI direction
- Resale repair roof — A new roof will significantly improve the home's appearance and increase its resale value. ↑
- Resale paint exterior siding — Painting the exterior siding will improve the home's curb appeal and increase its resale value. ↑
- Both repair and replace flooring — Repairing and replacing the flooring will improve the home's appearance and increase its resale and rental value. ↑
ⓘ Cost ranges are severity-bucket heuristics (US national rule-of-thumb). Get contractor quotes + a written scope before underwriting a rehab budget.
Schools (NCES district)
- District
- Greencastle-Antrim SD
- NCES district ID
- 4211010
- Math proficiency
- 43% ▼ -14.00%
- Reading proficiency
- 65% ▼ -9.00%
- Median HH income
- $62,541
- Composite
- 47.21/100
- National rank
- #2319
- State rank
- #118 of 539 in PA
Livability — Antrim
No livability data for this city. (Only ~50 U.S. cities are tracked.)
Census & demographics
- Population (ZIP)
- 20,335
Population outlook (Franklin County) Hauer SSP2
- Today (2025)
- 157,827 people
- By 2030
- 158,933 · +0.7%
- By 2040
- 159,060 · +0.8%
- By 2050
- 155,132 · -1.7%
- By 2075
- 138,545 · -12.2%
- By 2100
- 112,321 · -28.8%
Race, ethnicity, and origin ACS 2023
- Neighborhood character
- Predominantly White (90%)
- Race & ethnicity
- White 90% Two or more races 4% Black 3% Asian 2% Hispanic / Latino 1%
- Common ancestry
- Romanian 4% Italian 4% American 2%
- Foreign-born
- 4% · Canada, China
- Languages at home
- 96% English-only · Spanish 1% Russian/Polish/Slavic 1%
Political lean MEDSL · Franklin
- 2024 margin
- Solid R (+43.0) · D 28.1% · R 71.1%
- 2008→2024 swing
- -10.4pp toward R · 2008: -32.6pp · 2024: -43.0pp
- All cycles
- 2024: R+43.0 2020: R+43.1 2016: R+46.5 2012: R+38.5 2008: R+32.6
Not yet ingested
- Civics
- —
Market trends
- HPI YoY
- ▼ -54.84%
- Current HPI
- 233.5857
- Rent YoY
- —
- Metro
- —
- State GDP YoY
- ▲ 1.68%
- F500 in state
- 34
Industry mix (Fortune 500 HQ in PA)
| Industry | F500 HQs | Revenue |
|---|---|---|
| Healthcare | 2 | $309B |
|
||
| Insurance | 2 | $27B |
|
||
| Telecommunications / Media | 1 | $124B |
|
||
| Industrial Distribution | 1 | $22B |
|
||
| Financial Services | 1 | $20B |
|
||
| Chemicals / Materials | 1 | $18B |
|
||
Price history
2 events — show timeline
- 2026-06-05 Listing Removed — BRIGHT MLS
- 2026-05-12 Listed $54,000 BRIGHT MLS
Cash-flow waterfall
monthlySold comps — $/sqft
last 12 mo · ≤1 miLoading sold comps…