5103 Eigel St · Houston, TX
Flood risk 1/10 · Minimal
- FEMA flood zone
- X (unshaded)
- Chance of flooding over 30 yrs
- 0.0%
- Est. flood insurance / yr
- $507 – $1,088
Fire risk 1/10 · Minimal
- Est. fire insurance / yr
- $1,222 – $2,270
Heat risk 9/10 · Severe
- Hot days now (above 109°F)
- 7 days/yr
- Hot days in 30 yrs
- 24 days/yr
Wind risk 9/10 · Severe
- Chance of severe wind over 30 yrs
- 99.0%
Air-quality risk 3/10 · Minor
- Unhealthy air days now
- 2 days/yr
- Unhealthy air days in 30 yrs
- 3 days/yr
Risk factors via First Street. Map © Google.
Why this score? — see what drove the C- grade
The composite is a weighted blend of 9 inputs, each scored 0–100. Each bar is that input's sub-score; the figure is the points it added to the 100-point composite (weight × sub-score).
- Cash flow +21.5/30.0
- ARV discount +8.9/15.0
- DSCR +6.8/10.0
- 1% rule +6.0/10.0
- Livability +3.7/5.0
- Schools +2.7/10.0
- Condition / age +2.5/5.0
- Rent growth +2.3/5.0
- Appreciation +0.0/10.0
$415,000
🖨 Deal sheet 📄 Offer letter ✓ Due diligence
Listing remarks MLS
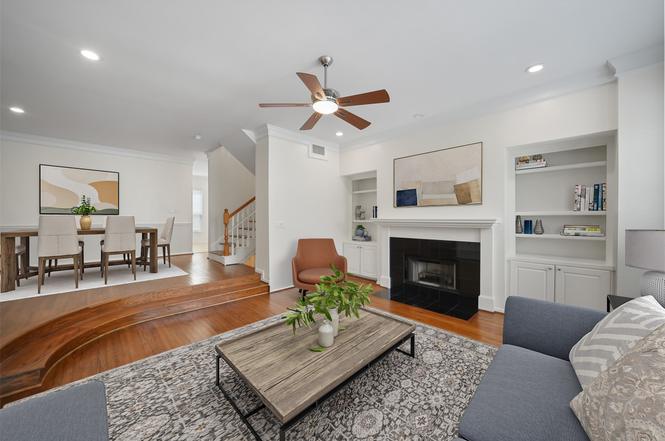
Beautiful townhome in one of Houston's most sought-after inner loop locations — minutes from Memorial Park, Downtown, Montrose, and the Heights. Walkable to Starbucks with easy access to the best of Houston's dining, entertainment, and sports venues. Meticulously refreshed in 2026 with fresh paint, new carpet, refinished hardwoods, and updated plumbing fixtures. Roof replaced in 2024 — confidence from the ground up. Soaring ceilings and oversized windows flood the living spaces with natural light while framing views of mature trees. Cozy up by the gas log fireplace on cooler Houston evenings. A two-car garage with private driveway delivers the convenience inner loop buyers prize — and with no HOA fees, you keep more of what you earn. Turnkey, move-in ready, and perfectly located.
Key facts
- Inner loop location
- Gas log fireplace
- Two-car garage
Tags
Neighborhood map
What this means for you Summary
Snapshot
- This is a 3-bed/3.5-bath townhouse listed at $415k.
Deal economics
- At list price, monthly cash flow is $620 ($7k/yr) — positive.
- The deal already cash-flows at list — no discount required.
- Meets the 1% rule at list price ($5k rent vs $415k).
- Recommended offer: $390k (6.0% below list) — sets the bar for market timing.
- Cap rate 8.1% vs local median 3.2% in Houston — top-decile yield for the area; either an underpriced asset or a hidden risk that comps aren't pricing in. Stress-test before assuming the spread holds.
Location & tenants
- Location reads 74/100 on livability (#184 in TX, #4,771 nationally) — a middle-class / working-renter tenant base. Strengths: amenities A+, cost of living A+, housing A+; Watch: schools D, crime F.
- Houston ISD (urban): math 27% / reading 35% proficiency, ranked #593 of 826 in TX (top 72%) — families likely to look elsewhere, expect single-tenant / working-renter base with shorter leases; 71% free/reduced lunch — lower-income household profile, screen leases tightly.
- Market conditions: Rents soft (-0.8%/yr); 646 active listings in the ZIP; 38 comparable units currently listed for rent nearby; rentals at typical pace (median 25d on market — plan ~3-4 weeks tenant-placement turnaround); 42% of comp listings sitting > 30 days — soft ceiling on asking rent; high-income renter base; 29,883 units permitted in Harris County in 2024 (8,621 in 5+ unit buildings).
- This rent runs 38% of the median local income ($145k/yr) — at the standard rent-burdened threshold; future hikes will face affordability resistance.
Forward outlook
- Local home prices are declining (-3.0%/yr); year-one equity from $3k of loan paydown is wiped out by about $12k of value loss. Plan a longer hold.
- Harris County population projected at +47% by 2050 — long-run rental-demand tailwind backs the buy-and-hold thesis.
Negotiation context
- It's been on market 63 days — a 6% lower offer ($390k) is reasonable based on typical stale-listing flexibility.
- 7 sale attempts since 25y ago; this cycle's ask has dropped $24k (5%) from the opening price — seller is motivated, your offer sets the floor, not the list.
- Current owner paid $215k; list at $415k implies a 93% gain — meaningful room to come down on a strong offer.
Risks & watch-outs
- Climate carrying-cost: severe wind risk, 99% chance of damaging wind over 30y; extreme-heat days projected 7→24/yr by 2055 (HVAC capex compounding) — expect insurance premiums to compound above CPI over the hold.
Questions for the listing agent
- It's been on market 63 days. Have you received any prior offers? Is the seller open to a 6% concession, seller financing, or rate buy-down credit?
- Why hasn't it sold? Are there any deal-killer items the seller is aware of (foundation, flood, title, zoning, code violations)?
- Is there a deadline driving the sale (1031 exchange, divorce, estate, relocation)? That informs how much negotiation room exists.
- Schools are D-rated, which usually means shorter tenancies and higher turnover. Who's the typical renter profile here, and what's been the actual vacancy rate?
- Crime grade is F in this area — have there been break-ins, vandalism, or insurance claims at this property in the last 3 years? What carrier currently insures it and at what premium?
- What's the average days-on-market for RENTAL listings here right now (not sales)? A rising rental-DOM trend means longer vacancies and softer asking-rent achievability than the comps imply.
- What's the recent tenant-quality profile in this submarket — average credit score on applications, eviction rate, late-payment / NSF rate, and stable-employment percentage? A property-management company in the area should have these aggregated.
- How much new for-sale + rental construction is in the pipeline within 1–3 miles? Heavy new supply typically softens prices + rents 12–24 months out; constrained supply supports both.
Investment metrics
- 1% rule
- 1.10% ✓
- Cap rate
- 8.08%
- Cash-on-cash
- 6.40%
- DSCR
- 1.28
- GRM
- 7.6
CMA / ARV
- ARV (median comp)
- $428,532
- List price
- $415,000
- Delta
- -3.16%
- Verdict
- FAIR
- Comps
- 20 within 1.0 mi
Show comp detail 12 sales within ~0.75 mi
| Address | Dist | Beds/Ba | Sqft | Sold | Price | $/sf | Match |
|---|---|---|---|---|---|---|---|
| 1361 Moy St | 0.12mi | 3/3.5 | 2,275 (-10%) | 1mo | $450,000 | $198 | 78 |
| 409 Detering St | 0.61mi | 3/3.5 | 2,462 (-2%) | 1mo | $494,000 | $201 | 67 |
| 5208 Blossom St #5 | 0.49mi | 3/3.5 | 2,340 (-7%) | 0mo | $435,000 | $186 | 65 |
| 5811 Rose St | 0.62mi | 3/2.5 | 2,477 (-2%) | 0mo | $735,000 | $297 | 64 |
| 1517 Asbury St | 0.35mi | 3/2.5 | 2,763 (+10%) | 2mo | $410,000 | $148 | 62 |
| 5527 Darling Unit A | 0.62mi | 3/2.5 | 2,401 (-5%) | 1mo | $450,000 | $187 | 58 |
| 1625 Mcdonald St | 0.74mi | 3/3.5 | 2,401 (-5%) | 2mo | $425,000 | $177 | 57 |
| 414 Snover St | 0.74mi | 3/3.0 | 2,423 (-4%) | 1mo | $539,900 | $223 | 56 |
| 5213 Feagan St Unit H | 0.62mi | 3/3.5 | 2,750 (+9%) | 1mo | $699,900 | $255 | 54 |
| 910 Malone St #104 | 0.49mi | 2/2.5 (-1) | 2,312 (-8%) | 1mo | $499,900 | $216 | 54 |
| 408 Parker St | 0.64mi | 3/3.5 | 2,197 (-13%) | 0mo | $415,000 | $189 | 48 |
| 117 Roy St | 0.71mi | 3/3.5 | 2,216 (-12%) | 2mo | $432,000 | $195 | 45 |
Match score weights: distance 35% · size 25% · config 20% · recency 20%. Top-matched comps best support the ARV.
Projected returns pro-forma
-3.0% appreciation · 0.0% rent growth · sell at horizon
- IRR
- -10.0%
- Equity multiple
- 0.65×
- Total profit
- $-41,020
- Equity at exit
- $61,878
- IRR
- -5.5%
- Equity multiple
- 0.69×
- Total profit
- $-36,010
- Equity at exit
- $35,882
Cash invested: $116,200 (down + closing). Projections, not guarantees.
Landlord ↔ Tenant lean methodology
- Overall (STATE)
- 87 Strongly Landlord-Friendly
- State Texas
- 87 Strongly Landlord-Friendly · R+5
- County
- — inherits STATE
- City
- — inherits STATE
ZIP-level market 77007
- Rents YoY
- -0.8%
- Active inventory
- 646
- Price-to-rent
- 7.6×
Monthly cashflow live
- Estimated rent
- $4,562 high interval (Pro) →
- Mortgage (P&I)
- −$2,176
- Tax from tax record
- −$635 /mo · $7,622/yr
- Insurance
- −$173
- HOA
- −$0
- Vacancy / Maint / Mgmt
- −$958
- Net cashflow
- $620
Break-even live
UW: 25.0% down · 7.5% · 30yr · 1.5% tax · 5.0% vac · 8.0% maint · 8.0% mgmt
Financing live
Cash to close
- Down payment
- $103,750
- Closing costs
- $12,450
- Reserves months
- —
- Total cash needed
- —
Loan-product check · same deal, 3 products live
Conventional
25% down · 7.5% · 30yr
- Down + closing
- —
- Monthly P&I
- —
- Monthly cashflow
- —
- DSCR
- —
- Eligible?
- —
Personal DTI + credit; lowest rate.
DSCR
20% down · 8.5% · 30yr
- Down + closing
- —
- Monthly P&I
- —
- Monthly cashflow
- —
- DSCR
- —
- Eligible?
- —
No personal income docs; deal must DSCR.
Hard money
10% down · 12.0% · 12mo
- Down + closing
- —
- Monthly P&I
- —
- Monthly cashflow
- —
- DSCR
- —
- Eligible?
- —
Short-term bridge; refi at stabilization.
Rent comps 38 comps
| Address | Beds | Baths | Sqft | Rent | $/sqft | DOM | Units | Dist |
|---|---|---|---|---|---|---|---|---|
| 4917 Nolda St Houston, TX | 3.0 | 3.5 | 1764 | $5,000 | $2.83 | 24d | 1 | 0.12mi |
| 5305 Nett St Unit A Houston, TX | 3.0 | 3.5 | 2104 | $2,950 | $1.40 | 24d | 1 | 0.29mi |
| 5237 Center St Houston, TX | 3.0 | 3.0 | 2284 | $2,995 | $1.31 | 44d | 1 | 0.30mi |
| 5108 Larkin St Houston, TX | 3.0 | 3.5 | 2108 | $2,850 | $1.35 | 44d | 1 | 0.30mi |
| 4608 Nett St Houston, TX | 3.0 | 4.0 | 2261 | $3,750 | $1.66 | 44d | 1 | 0.37mi |
| 5610 Schuler St Houston, TX | 3.0 | 3.5 | 2614 | $3,111 | $1.19 | 5d | 1 | 0.39mi |
| 4510 Inker St Houston, TX | 4.0 | 4.0 | 2293 | $4,500 | $1.96 | 44d | 1 | 0.39mi |
| 5235 Petty St Unit B Houston, TX | 3.0 | 2.5 | 2532 | $3,000 | $1.18 | 44d | 1 | 0.40mi |
| 5336 Darling St Unit 1225767P Houston, TX | 3.0 | 3.0 | 2292 | $5,570 | $2.43 | 8d | 1 | 0.44mi |
| 5811 Maxie St Houston, TX | 3.0 | 3.5 | 2226 | $3,000 | $1.35 | 44d | 1 | 0.48mi |
| 4311 Marina St Houston, TX | 3.0 | 4.0 | 2328 | $3,599 | $1.55 | 44d | 1 | 0.49mi |
| 4444 Center St Houston, TX | 3.0 | 3.0 | 2121 | $3,200 | $1.51 | 44d | 1 | 0.49mi |
| 2103 Radcliffe St Unit 1225772P Houston, TX | 3.0 | 2.0 | 1797 | $4,729 | $2.63 | 8d | 1 | 0.50mi |
| 2210 Radcliffe St Houston, TX | 3.0 | 3.5 | 2066 | $2,716 | $1.31 | 8d | 1 | 0.52mi |
| 543 T C Jester Blvd Unit 1225766P Houston, TX | 3.0 | 3.5 | 2389 | $5,222 | $2.19 | 16d | 1 | 0.58mi |
| 5427 Kansas St Houston, TX | 3.0 | 4.0 | 2156 | $2,700 | $1.25 | 44d | 1 | 0.60mi |
| 920 Westcott St Houston, TX | 1.0–2.0 | 1.0–2.0 | 1175 | $3,306 | $2.81 | 1d | 29 | 0.62mi |
| 915 Thompson St Unit 915 Houston, TX | 4.0 | 3.5 | 3200 | $8,500 | $2.66 | 24d | 1 | 0.62mi |
| 1221 Bonner St Houston, TX | 3.0 | 3.5 | 2252 | $3,200 | $1.42 | 44d | 1 | 0.63mi |
| 917 Thompson St Unit 917 Houston, TX | 4.0 | 3.5 | 3200 | $8,000 | $2.50 | 24d | 1 | 0.63mi |
| 913 Thompson St #913 Houston, TX | 4.0 | 3.5 | 3200 | $8,500 | $2.66 | 24d | 1 | 0.63mi |
| 911 Thompson St #911 Houston, TX | 4.0 | 3.5 | 3200 | $8,500 | $2.66 | 24d | 1 | 0.63mi |
| 5530 Kiam St Unit 1019540P Houston, TX | 4.0 | 2.5 | 2680 | $15,799 | $5.90 | 44d | 1 | 0.69mi |
| 5530 Kiam St Houston, TX | 4.0 | 2.5 | 2688 | $9,750 | $3.63 | 44d | 1 | 0.69mi |
| 929 Westcott St Houston, TX | 1.0–3.0 | 1.0–3.0 | 1375 | $9,263 | $6.74 | 3d | 22 | 0.71mi |
| 5620 Petty St Houston, TX | 4.0 | 3.5 | 2891 | $8,750 | $3.03 | 44d | 1 | 0.72mi |
| 5620 Petty St Unit 1019538P Houston, TX | 4.0 | 3.5 | 2884 | $16,259 | $5.64 | 22d | 1 | 0.72mi |
| 5732 Darling St Unit 1056419P Houston, TX | 3.0 | 3.5 | 2400 | $7,771 | $3.24 | 44d | 1 | 0.85mi |
| 5201 Memorial Dr Houston, TX | 1.0–2.0 | 1.0–2.5 | 1071 | $3,361 | $3.14 | 2d | 21 | 0.91mi |
| 707 Marston St Unit 510 Houston, TX | 3.0 | 2.0 | 2310 | $12,482 | $5.40 | 3d | 1 | 1.15mi |
| 3333 Allen Pkwy Unit 1000 Houston, TX | 2.0 | 2.5 | 1860 | $4,500 | $2.42 | 44d | 1 | 1.25mi |
| 811 Buffalo Park Dr Unit 3187 Houston, TX | 3.0 | 2.0 | 3632 | $15,392 | $4.24 | 3d | 1 | 1.25mi |
| 811 Buffalo Park Dr Unit 510 Houston, TX | 3.0 | 2.0 | 3632 | $15,424 | $4.25 | 11d | 1 | 1.25mi |
| 811 Buffalo Park Dr Unit 844 Houston, TX | 3.0 | 2.0 | 3632 | $14,913 | $4.11 | 14d | 1 | 1.25mi |
| 1027 Gross St Houston, TX | 4.0 | 3.5 | 3035 | $5,800 | $1.91 | 44d | 1 | 1.34mi |
| 1332 Dorothy St Houston, TX | 3.0 | 3.5 | 2980 | $6,500 | $2.18 | 22d | 1 | 1.42mi |
| 1723 W 14th St Unit B Houston, TX | 3.0 | 3.5 | 2373 | $3,400 | $1.43 | 21d | 1 | 1.46mi |
| 3131 Memorial Ct Houston, TX | 2.0 | 1.0–2.5 | 1336 | $3,418 | $2.56 | 2d | 32 | 1.49mi |
Listing history 32 events
-
2026-06-18days on market $415,000 Active 63 DOM
-
2026-06-17days on market $415,000 Active 62 DOM
-
2026-06-16days on market $415,000 Active 61 DOM
-
2026-06-15remarks 693-char remark
-
2026-06-15days on market $415,000 Active 60 DOM
-
2026-06-13days on market $415,000 Active 58 DOM
-
2026-06-10days on market $415,000 Active 54 DOM
-
2026-06-08days on market $415,000 Active 53 DOM
-
2026-06-07days on market $415,000 Active 52 DOM
-
2026-06-04days on market $415,000 Active 49 DOM
-
2026-06-01days on market $415,000 Active 46 DOM
-
2026-05-31days on market $415,000 Active 45 DOM
-
2026-04-30price $425,000 812-char remark
Show marketing remark (812 chars)
Beautiful townhome in one of Houston's most sought-after inner loop locations — minutes from Memorial Park, Downtown, Montrose, and the Heights. Walkable to Starbucks with easy access to the best of Houston's dining, entertainment, and sports venues. Meticulously refreshed in 2026 with fresh paint, new carpet, refinished hardwoods, and updated plumbing fixtures. Roof replaced in 2024 — confidence from the ground up. Soaring ceilings and oversized windows flood the living spaces with natural light while framing views of mature trees. Cozy up by the gas log fireplace on cooler Houston evenings. A two-car garage with private driveway delivers the convenience inner loop buyers prize — and with no HOA fees, you keep more of what you earn. Turnkey, move-in ready, and perfectly located.
-
2026-04-16$439,000 Active 812-char remark
Show marketing remark (812 chars)
Beautiful townhome in one of Houston's most sought-after inner loop locations — minutes from Memorial Park, Downtown, Montrose, and the Heights. Walkable to Starbucks with easy access to the best of Houston's dining, entertainment, and sports venues. Meticulously refreshed in 2026 with fresh paint, new carpet, refinished hardwoods, and updated plumbing fixtures. Roof replaced in 2024 — confidence from the ground up. Soaring ceilings and oversized windows flood the living spaces with natural light while framing views of mature trees. Cozy up by the gas log fireplace on cooler Houston evenings. A two-car garage with private driveway delivers the convenience inner loop buyers prize — and with no HOA fees, you keep more of what you earn. Turnkey, move-in ready, and perfectly located.
-
2024-08-10historical $2,750
-
2024-08-03$2,750
-
2005-06-30soldstatus
-
2005-04-15historical
-
2004-11-01$244,900
-
2004-10-29historical
-
2004-07-30$269,900
-
2003-06-25soldstatus
-
2003-03-15historical
-
2003-02-10historical
-
2003-02-07$244,900
-
2002-11-04$249,900
-
2001-10-07historical
-
2001-08-13$234,900
-
2001-01-01soldstatus
-
2000-03-06soldstatus
-
2000-01-01soldstatus $215,000
-
2000-01-01soldstatus $205,000
ⓘ Source: listings_history table (triggers on properties + properties_extension) + one-shot
backfill from property_details.listing_events for pre-trigger history.
Tax reassessment forecast TX · Resets to sale price
- Current annual tax
- $7,622 · $635/mo
- Projected year-2 tax
- $7,622 · $635/mo
- Expected delta
- $0/yr ($0/mo · 0.0%)
ⓘ Screening estimate from a state-policy table — verify with the county assessor before closing.
Climate risk First Street
- Flood 1/10 Low FEMA zone X (unshaded) · 0% chance over 30 yrs
- Wildfire 1/10 Low
- Heat 9/10 Extreme 7 d/yr ≥109°F today · 24 d/yr by 30 yrs out
- Wind 9/10 Extreme 99% chance of damaging wind over 30 yrs
- Air quality 3/10 Moderate 2 unhealthy d/yr today · 3 by 30 yrs out
Nearby sold comps map
Loading sold comps map…
Walkable amenities ~0.75 mi
Loading nearby amenities…
Taxation est. · year 1
- Rental income
- $54,743
- − Mortgage interest
- −$23,246
- − Property taxes
- −$7,622
- − Insurance
- −$2,075
- − Repairs & maintenance
- −$4,379
- − Management
- −$4,379
- − Depreciation
- −$12,073
- Taxable income
- $968
- Est. tax owed @ 24.0%
- −$232
- After-tax cash flow
- $7,202/yr
For passive investors: Depreciation is non-cash, so a rental often shows a tax loss while cash-flowing — sheltering income. Rental losses are passive: they offset passive income freely, and up to $25,000/yr can offset ordinary (W-2) income if you actively participate and your MAGI is under $100k (phasing out to $0 by $150k); unused losses carry forward. On sale, claimed depreciation is recaptured at up to 25%, and gains may owe capital-gains tax (a 1031 exchange can defer both). Figures are a year-1 estimate at your 24.0% rate — not tax advice; consult a CPA.
Schools (NCES district)
- District
- Houston ISD
- NCES district ID
- 4823640
- Math proficiency
- 27% ▼ -18.00%
- Reading proficiency
- 35% ▼ -6.00%
- Median HH income
- $46,054
- Composite
- 26.63/100
- National rank
- #7173
- State rank
- #593 of 826 in TX
Livability — Houston
- Score
- 74/100
- State rank
- #184
- US rank
- #4771
Category grades
Schools grade is shown separately in the Schools card above.
Census & demographics
- Census place
- Houston, TX
- County
- Harris County · 4,702,590 people
- City population
- 3,226,434
- Metro
- Houston-The Woodlands-Sugar Land, TX
- Population (ZIP)
- 47,808
- Household income
- $144,911
- Rent vs Own
- Severe rent burden
- 1812.0
Population outlook (Harris County) Hauer SSP2
- Today (2025)
- 5,571,493 people
- By 2030
- 6,089,821 · +9.3%
- By 2040
- 7,142,806 · +28.2%
- By 2050
- 8,185,864 · +46.9%
- By 2075
- 10,574,329 · +89.8%
- By 2100
- 12,109,958 · +117.4%
Race, ethnicity, and origin ACS 2023
- Neighborhood character
- Diverse neighborhood (Simpson 0.63)
- Race & ethnicity
- White 57% Hispanic / Latino 17% Two or more races 13% Asian 11% Black 9%
- Hispanic origin (detail)
- Mexican 12%
- Common ancestry
- Slovak 3% Romanian 3% Italian 3%
- Foreign-born
- 19% · Canada, China, South Korea
- Languages at home
- 75% English-only · Spanish 12% Other Indo-European 4% Chinese 2%
Political lean MEDSL · Harris
- 2024 margin
- Lean D (+5.5) · D 52.0% · R 46.4% · Other 1.6%
- 2008→2024 swing
- +3.9pp toward D · 2008: 1.6pp · 2024: 5.5pp
- All cycles
- 2024: D+5.5 2020: D+13.3 2016: D+12.4 2012: D+0.1 2008: D+1.6
Not yet ingested
- Civics
- —
Market trends
- HPI YoY
- ▼ -219.42%
- Current HPI
- 159.8157
- Rent YoY
- ▼ -0.83%
- Metro
- Houston-The Woodlands-Sugar Land, TX
- State GDP YoY
- ▲ 3.95%
- F500 in state
- 110
Industry mix (Fortune 500 HQ in TX)
| Industry | F500 HQs | Revenue |
|---|---|---|
| Energy | 16 | $1,198B |
|
||
| Technology | 5 | $198B |
|
||
| Engineering / Construction | 4 | $72B |
|
||
| Energy Services | 3 | $60B |
|
||
| Utilities | 3 | $41B |
|
||
| Healthcare | 2 | $330B |
|
||
Price history
+97.7% since first listed20 events — show timeline
- 2026-04-30 Price Changed $425,000 HARMLS
- 2026-04-16 Listed $439,000 HARMLS
- 2024-08-10 Rental Removed $2,750 HARMLS
- 2024-08-03 Listed for Rent $2,750 HARMLS
- 2005-06-30 Sold (Public Records) — Public Records
- 2005-04-15 Listing Removed — HARMLS
- 2004-11-01 Listed $244,900 HARMLS
- 2004-10-29 Listing Removed — HARMLS
- 2004-07-30 Listed $269,900 HARMLS
- 2003-06-25 Sold (Public Records) — Public Records
- 2003-03-15 Listing Removed — HARMLS
- 2003-02-10 Listing Removed — HARMLS
- 2003-02-07 Listed $244,900 HARMLS
- 2002-11-04 Listed $249,900 HARMLS
- 2001-10-07 Listing Removed — HARMLS
- 2001-08-13 Listed $234,900 HARMLS
- 2001-01-01 Sold (Public Records) — Public Records
- 2000-03-06 Sold (Public Records) — Public Records
- 2000-01-01 Sold (Public Records) $205,000 Public Records
- 2000-01-01 Sold (Public Records) $215,000 Public Records
Property tax history
+3.4%/yrLatest (2025): $7,622 · -8.2% YoY. Source: county tax records.
Cash-flow waterfall
monthlySold comps — $/sqft
last 12 mo · ≤1 miLoading sold comps…