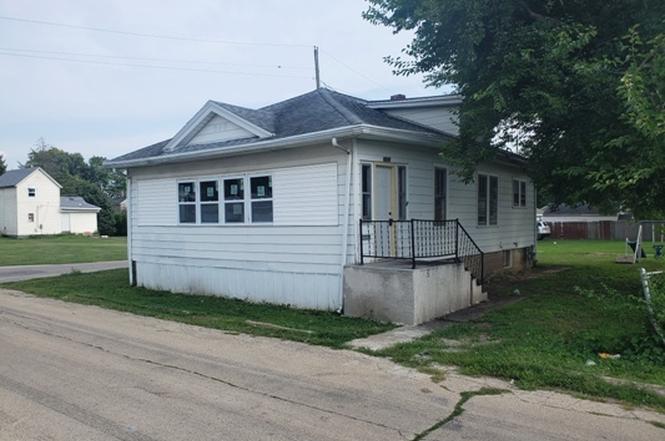
356 W Cypress St · Kankakee, IL
Flood risk 1/10 · Minimal
- FEMA flood zone
- X (unshaded)
- Chance of flooding over 30 yrs
- 0.0%
- Est. flood insurance / yr
- $473 – $860
Fire risk 1/10 · Minimal
- Est. fire insurance / yr
- $804 – $1,492
Heat risk 3/10 · Minor
- Hot days now (above 105°F)
- 7 days/yr
- Hot days in 30 yrs
- 16 days/yr
Wind risk 2/10 · Minimal
- Chance of severe wind over 30 yrs
- 1.0%
Air-quality risk 2/10 · Minimal
- Unhealthy air days now
- 1 days/yr
- Unhealthy air days in 30 yrs
- 1 days/yr
Risk factors via First Street. Map © Google.
Why this score? — see what drove the B- grade
The composite is a weighted blend of 9 inputs, each scored 0–100. Each bar is that input's sub-score; the figure is the points it added to the 100-point composite (weight × sub-score).
- Cash flow +30.0/30.0
- 1% rule +10.0/10.0
- DSCR +10.0/10.0
- ARV discount +7.5/15.0
- Rent growth +3.6/5.0
- Livability +3.1/5.0
- Condition / age +2.5/5.0
- Schools +0.8/10.0
- Appreciation +0.0/10.0
$59,900
🖨 Deal sheet (PDF) 📄 Offer letter ✓ Due diligence
Listing remarks
Seller has completed some repairs including new flooring, new exterior doors, kitchen cabinets, fixtures and countertops. New vanity, countertops, and fixtures in the bathroom. Sellers Addendum, Proof of funds, and $1000 for Earnest Money as a cashier's check required by seller. "This property is eligible under the Freddie Mac First Look Initiative through 10/04/2025.
Key facts
- New vanity
- New exterior doors
- Fixtures
Tags
Property features AI
Finance
- Other: Property located within Kankakee corporate limits; Directions: W Court St to N 5th to Cypress
- HOA & community: No master association fee required
Exterior
- Utilities: Public water; Public sewer
- Home design: Detached single-family home; One-story; Fee simple ownership; Built over 100 years ago; Rehab completed in 2025; Aluminum siding
- Construction: Aluminum siding exterior
- Exterior features: Lot dimensions approximately 60 x 50; Lot less than 0.25 acre
Interior
- Kitchen: Kitchen included (10 x 15); Pantry
- Bedrooms: Master bedroom (main level, 12 x 14); Second bedroom (main level, 12 x 10)
- Bathrooms: 1 full bathroom
- Heating & cooling: Natural gas heating; Forced air
- Interior features: Unfinished full basement; Enclosed porch (27 x 6); Pantry (6 x 6); Dining room (12 x 13); Kitchen (10 x 15); Living room (13 x 9); Laundry room; Family room
- Laundry & utility: Laundry room; Unfinished full basement (utility space)
Neighborhood map
What this means for you Summary
Snapshot
- This is a 2-bed/1.0-bath other listed at $60k.
Deal economics
- At list price, monthly cash flow is $553 ($7k/yr) — positive.
- The deal already cash-flows at list — no discount required.
- Meets the 1% rule at list price ($1k rent vs $60k).
- Recommended offer: $53k (12.0% below list) — sets the bar for market timing.
- Cap rate 17.4% vs local median 5.7% in Kankakee — top-decile yield for the area; either an underpriced asset or a hidden risk that comps aren't pricing in. Stress-test before assuming the spread holds.
Location & tenants
- Location reads 62/100 on livability (#832 in IL) — a middle-class / working-renter tenant base. Strengths: commute A+, cost of living A+, housing A; Watch: crime F, amenities F, employment D-.
- Kankakee SD 111 (urban): math 6% / reading 13% proficiency, ranked #584 of 620 in IL (top 94%) — low school quality limits family demand, transient renter base, plan for 1-2y turnover; 78% free/reduced lunch — lower-income household profile, screen leases tightly.
- Zoned schools: John Kennedy Middle Grade School (math 7% / reading 19%, grade F, #1,362 of 2,056 statewide, top 66%, 543 students, 0% FRL); Kankakee Junior High School (math 4% / reading 15%, grade F, #597 of 665 statewide, top 91%, 560 students, 0% FRL); Kankakee High School (math 6% / reading 10%, grade F, #587 of 693 statewide, top 85%, 1,513 students, 0% FRL) — zoned schools average 0% FRL vs 78% district-wide (78 pts lower); this property's tenant base skews higher-income than the district average.
- Market conditions: Rents rising fast (+4.4%/yr); 114 active listings in the ZIP; 3 comparable units currently listed for rent nearby; rentals lingering (median 46d on market — plan ~5-8 weeks vacancy on turnover, expect pricing pressure); 100% of comp listings sitting > 30 days — soft ceiling on asking rent; 145 units permitted in Kankakee County in 2024 (5 in 5+ unit buildings).
Forward outlook
- Local home prices are declining (-3.0%/yr); year-one equity from $414 of loan paydown is wiped out by about $2k of value loss. Plan a longer hold.
- Kankakee County population projected at -19% by 2050 — secular population decline; favor cash flow + early exit over multi-decade hold.
- At projected returns (-3.0% appreciation + 4.4% rent growth), your $17k cash investment doubles in ~3 years — after that, you're playing with house money.
Negotiation context
- It's been on market 257 days — a 12% lower offer ($53k) is reasonable based on typical stale-listing flexibility.
- Current owner paid $46k; 30% above their basis — modest negotiation headroom, anchor on the comps not their cost.
Risks & watch-outs
- Watch-outs: built in 1918 — expect roof / HVAC / electrical / plumbing capex.
Questions for the listing agent
- It's been on market 257 days. Have you received any prior offers? Is the seller open to a 12% concession, seller financing, or rate buy-down credit?
- Built in 1918 — when were the roof, HVAC, electrical panel, plumbing, and water heater last replaced?
- Why hasn't it sold? Are there any deal-killer items the seller is aware of (foundation, flood, title, zoning, code violations)?
- Is there a deadline driving the sale (1031 exchange, divorce, estate, relocation)? That informs how much negotiation room exists.
- Schools are F-rated, which usually means shorter tenancies and higher turnover. Who's the typical renter profile here, and what's been the actual vacancy rate?
- Crime grade is F in this area — have there been break-ins, vandalism, or insurance claims at this property in the last 3 years? What carrier currently insures it and at what premium?
- What's the average days-on-market for RENTAL listings here right now (not sales)? A rising rental-DOM trend means longer vacancies and softer asking-rent achievability than the comps imply.
- What's the recent tenant-quality profile in this submarket — average credit score on applications, eviction rate, late-payment / NSF rate, and stable-employment percentage? A property-management company in the area should have these aggregated.
- How much new for-sale + rental construction is in the pipeline within 1–3 miles? Heavy new supply typically softens prices + rents 12–24 months out; constrained supply supports both.
Investment metrics
- 1% rule
- 2.04% ✓
- Cap rate
- 17.37%
- Cash-on-cash
- 39.56%
- DSCR
- 2.76
- GRM
- 4.1
CMA / ARV
No comps found within radius.
Projected returns pro-forma
-3.0% appreciation · 4.38% rent growth · sell at horizon
- IRR
- 37.4%
- Equity multiple
- 2.62×
- Total profit
- $27,249
- Equity at exit
- $8,931
- IRR
- 44.7%
- Equity multiple
- 5.56×
- Total profit
- $76,417
- Equity at exit
- $5,179
Cash invested: $16,772 (down + closing). Projections, not guarantees.
Landlord ↔ Tenant lean methodology
- Overall (STATE)
- 43 Moderately Tenant-Leaning
- State Illinois
- 43 Moderately Tenant-Leaning · D+7
- County
- — inherits STATE
- City
- — inherits STATE
ZIP-level market 60901
- Home prices YoY
- -32.5%
- Rents YoY
- 4.4%
- Active inventory
- 114
- Price-to-rent
- 4.1×
Monthly cashflow live
- Estimated rent
- $1,224 medium interval (Pro) →
- Mortgage (P&I)
- −$314
- Tax est. 1.5%
- −$75 /mo · $898/yr
- Insurance
- −$25
- HOA
- −$0
- Vacancy / Maint / Mgmt
- −$257
- Net cashflow
- $553
Break-even live
Sensitivity live
| Price | -10% $594 | -5% $574 | +0% $553 | +5% $532 | +10% $511 |
|---|---|---|---|---|---|
| Rent | -10% $456 | -5% $505 | +0% $553 | +5% $601 | +10% $650 |
| Rate | -1.0pp $583 | -0.5pp $568 | base $553 | +0.5pp $537 | +1.0pp $522 |
UW: 25.0% down · 7.5% · 30yr · 1.5% tax · 5.0% vac · 8.0% maint · 8.0% mgmt
Financing live
Cash to close
- Down payment
- $14,975
- Closing costs
- $1,797
- Reserves months
- —
- Total cash needed
- —
Loan-product check · same deal, 3 products live
Conventional
25% down · 7.5% · 30yr
- Down + closing
- —
- Monthly P&I
- —
- Monthly cashflow
- —
- DSCR
- —
- Eligible?
- —
Personal DTI + credit; lowest rate.
DSCR
20% down · 8.5% · 30yr
- Down + closing
- —
- Monthly P&I
- —
- Monthly cashflow
- —
- DSCR
- —
- Eligible?
- —
No personal income docs; deal must DSCR.
Hard money
10% down · 12.0% · 12mo
- Down + closing
- —
- Monthly P&I
- —
- Monthly cashflow
- —
- DSCR
- —
- Eligible?
- —
Short-term bridge; refi at stabilization.
Rent comps 3 comps
| Address | Beds | Baths | Sqft | Rent | $/sqft | DOM | Units | Dist |
|---|---|---|---|---|---|---|---|---|
| 243 S 5th Ave Unit 247 Kankakee, IL | 2.0 | 1.0 | 1000 | $1,150 | $1.15 | 45d | 1 | 0.48mi |
| 319 S 5th Ave Unit 4 Kankakee, IL | 1.0 | 1.0 | 750 | $1,115 | $1.49 | 45d | 1 | 0.55mi |
| 1017 N Schuyler Ave Unit 3 Kankakee, IL | 2.0 | 1.0 | 800 | $1,375 | $1.72 | 45d | 1 | 0.56mi |
Listing history 10 events
-
2026-05-20soldstatus $46,000 Closed
-
2026-05-18status Pending
-
2026-02-19historical Contingent - Continue to Show
-
2026-02-13price $59,900
-
2026-01-15price $64,900
-
2025-12-19price $72,900
-
2025-11-17price $77,900
-
2025-10-17price $82,900
-
2025-09-03$89,900 Active
-
2006-12-15soldstatus $45,000
ⓘ Source: listings_history table (triggers on properties + properties_extension) + one-shot
backfill from property_details.listing_events for pre-trigger history.
Climate risk First Street
- Flood 1/10 Low FEMA zone X (unshaded) · 0% chance over 30 yrs
- Wildfire 1/10 Low
- Heat 3/10 Moderate 7 d/yr ≥105°F today · 16 d/yr by 30 yrs out
- Wind 2/10 Low 100% chance of damaging wind over 30 yrs
- Air quality 2/10 Low 1 unhealthy d/yr today · 1 by 30 yrs out
Nearby sold comps map
Loading sold comps map…
Walkable amenities ~0.75 mi
Loading nearby amenities…
Taxation est. · year 1
- Rental income
- $14,686
- − Mortgage interest
- −$3,355
- − Property taxes
- −$898
- − Insurance
- −$300
- − Repairs & maintenance
- −$1,175
- − Management
- −$1,175
- − Depreciation
- −$1,743
- Taxable income
- $6,041
- Est. tax owed @ 24.0%
- −$1,450
- After-tax cash flow
- $5,185/yr
For passive investors: Depreciation is non-cash, so a rental often shows a tax loss while cash-flowing — sheltering income. Rental losses are passive: they offset passive income freely, and up to $25,000/yr can offset ordinary (W-2) income if you actively participate and your MAGI is under $100k (phasing out to $0 by $150k); unused losses carry forward. On sale, claimed depreciation is recaptured at up to 25%, and gains may owe capital-gains tax (a 1031 exchange can defer both). Figures are a year-1 estimate at your 24.0% rate — not tax advice; consult a CPA.
Schools (NCES district)
- District
- Kankakee SD 111
- NCES district ID
- 1720760
- Math proficiency
- 6% ▼ -7.00%
- Reading proficiency
- 13% ▼ -6.00%
- Median HH income
- $37,968
- Composite
- 8.03/100
- National rank
- #9921
- State rank
- #584 of 620 in IL
Livability — Kankakee
- Score
- 62/100
- State rank
- #832
- US rank
- #16432
Category grades
Schools grade is shown separately in the Schools card above.
Census & demographics
- Census place
- Kankakee, IL
- County
- Kankakee County · 61,801 people
- City population
- 33,128
- Metro
- Kankakee, IL
- Population (ZIP)
- 33,128
- Household income
- $58,309
- Rent vs Own
- Severe rent burden
- 1317.0
Population outlook (Kankakee County) Hauer SSP2
- Today (2025)
- 105,479 people
- By 2030
- 101,792 · -3.5%
- By 2040
- 93,479 · -11.4%
- By 2050
- 85,061 · -19.4%
- By 2075
- 67,314 · -36.2%
- By 2100
- 52,439 · -50.3%
Race, ethnicity, and origin ACS 2023
- Neighborhood character
- Diverse neighborhood (Simpson 0.65)
- Race & ethnicity
- White 47% Black 30% Hispanic / Latino 19% Two or more races 7%
- Hispanic origin (detail)
- Mexican 16%
- Common ancestry
- Lithuanian 4% Romanian 4% Slovak 1%
- Foreign-born
- 10% · Canada
- Languages at home
- 82% English-only · Spanish 16%
Political lean MEDSL · Kankakee
- 2024 margin
- Strong R (+20.8) · D 38.7% · R 59.5% · Other 1.8%
- 2008→2024 swing
- -25.4pp toward R · 2008: 4.6pp · 2024: -20.8pp
- All cycles
- 2024: R+20.8 2020: R+16.5 2016: R+13.3 2012: R+3.4 2008: D+4.6
Not yet ingested
- Civics
- —
Market trends
- HPI YoY
- ▼ -92.12%
- Current HPI
- 190.8755
- Rent YoY
- ▲ 4.38%
- Metro
- Kankakee, IL
- State GDP YoY
- ▲ 1.59%
- F500 in state
- 60
Industry mix (Fortune 500 HQ in IL)
| Industry | F500 HQs | Revenue |
|---|---|---|
| Insurance | 4 | $201B |
|
||
| Consumer Goods | 4 | $87B |
|
||
| Industrial Machinery | 3 | $64B |
|
||
| Healthcare | 2 | $55B |
|
||
| Retail / Pharmacy | 1 | $148B |
|
||
| Agriculture / Food | 1 | $86B |
|
||
Price history
+2.2% since first listed10 events — show timeline
- 2026-05-20 Sold (MLS) $46,000 MRED as Distributed by MLS Grid
- 2026-05-18 Pending — MRED as Distributed by MLS Grid
- 2026-02-19 Contingent — MRED as Distributed by MLS Grid
- 2026-02-13 Price Changed $59,900 MRED as Distributed by MLS Grid
- 2026-01-15 Price Changed $64,900 MRED as Distributed by MLS Grid
- 2025-12-19 Price Changed $72,900 MRED as Distributed by MLS Grid
- 2025-11-17 Price Changed $77,900 MRED as Distributed by MLS Grid
- 2025-10-17 Price Changed $82,900 MRED as Distributed by MLS Grid
- 2025-09-03 Listed $89,900 MRED as Distributed by MLS Grid
- 2006-12-15 Sold (Public Records) $45,000 Public Records
Property tax history
+18.3%/yrLatest (2024): $3,014 · +41.0% YoY. Source: county tax records.
Cash-flow waterfall
monthlySold comps — $/sqft
last 12 mo · ≤1 miLoading sold comps…