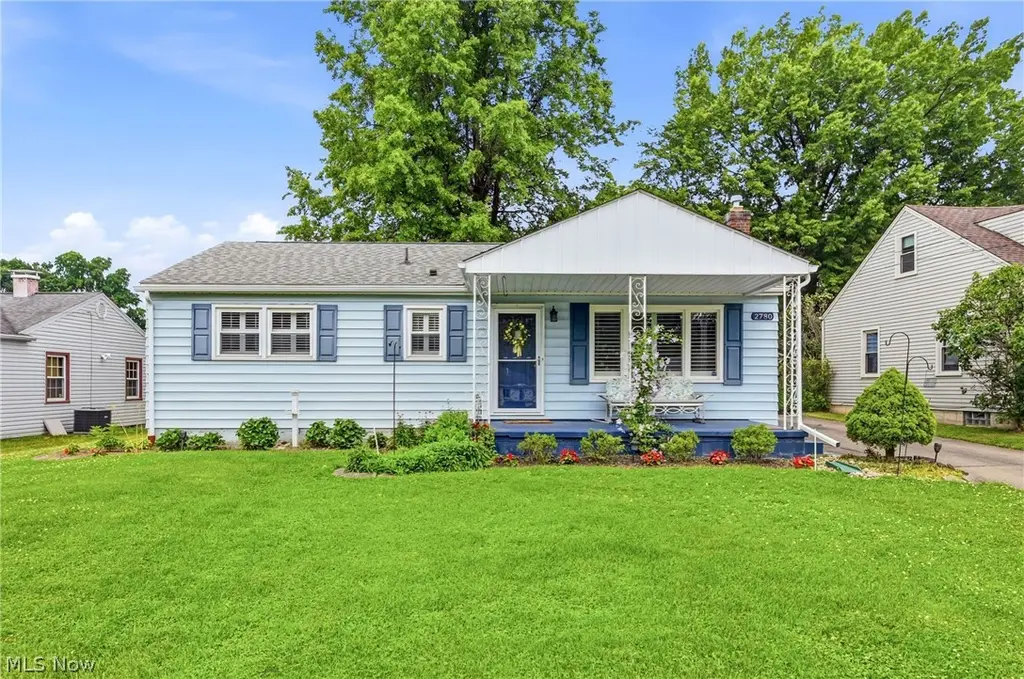
2780 Brunswick Rd · Youngstown, OH
Flood risk 1/10 · Minimal
- FEMA flood zone
- X (unshaded)
- Chance of flooding over 30 yrs
- 0.0%
- Est. flood insurance / yr
- $473 – $860
Fire risk 1/10 · Minimal
- Est. fire insurance / yr
- $713 – $1,323
Heat risk 3/10 · Minor
- Hot days now (above 98°F)
- 7 days/yr
- Hot days in 30 yrs
- 17 days/yr
Wind risk 1/10 · Minimal
- Chance of severe wind over 30 yrs
- —
Air-quality risk 2/10 · Minimal
- Unhealthy air days now
- 1 days/yr
- Unhealthy air days in 30 yrs
- 2 days/yr
Risk factors via First Street. Map © Google.
Why this score? — see what drove the F grade
The composite is a weighted blend of 9 inputs, each scored 0–100. Each bar is that input's sub-score; the figure is the points it added to the 100-point composite (weight × sub-score).
- Cash flow +10.6/30.0
- Livability +4.0/5.0
- DSCR +3.0/10.0
- Rent growth +2.5/5.0
- Condition / age +2.5/5.0
- 1% rule +2.2/10.0
- ARV discount +1.7/15.0
- Schools +0.9/10.0
- Appreciation +0.0/10.0
$174,900
🖨 Deal sheet (PDF) 📄 Offer letter ✓ Due diligence
Listing remarks MLS
Squeaky clean and move in ready! This 3 bedroom ranch has been loved by one family it's entire life and it shows. Features include a newer furnace and hot water tank, replacement windows, waterproofed basement, central air conditioning, gleaming hardwood floors throughout and a new kitchen floor. Enjoy spending time on the enclosed back patio or watching the world go by from the spacious front porch. Come take a look. This one will go fast!
Key facts
- Hardwood flooring
- Colorful flower beds
- Curb appeal
Tags
Property features AI
Exterior
- Parking: Detached garage; Driveway; 1 garage space
- Utilities: Public water; Public sewer
- Home design: Single-story; Block foundation
- Construction: Aluminum siding; Asphalt/fiberglass roof
- Exterior features: Enclosed patio/porch; Patio; Porch
Interior
- Bedrooms: 3 main-level bedrooms
- Bathrooms: 1 full bathroom; 1 half bathroom; 1 main-level bathroom
- Heating & cooling: Forced-air gas heating; Central air conditioning
- Interior features: Full, partially finished basement
Neighborhood map
What this means for you Summary
Snapshot
- This is a 2-bed/1.5-bath single-family listed at $175k.
Deal economics
- At list price, monthly cash flow is $-88 ($-1k/yr) — negative.
- To cash-flow at today's rent, offer at most $159k (8.9% below list).
- To meet the 1% rule (rent ≥ 1% of price), the offer needs to be $126k (27.7% below list).
- Recommended offer: $126k (27.7% below list) — sets the bar for 1% rule.
Location & tenants
- Location reads 81/100 on livability (#99 in OH, #1,506 nationally) — a professional / high-income tenant draw. Strengths: amenities A+, commute A+, cost of living A+; Watch: crime F, employment F.
- Youngstown City (urban): math 8% / reading 17% proficiency, ranked #649 of 656 in OH (top 99%) — low school quality limits family demand, transient renter base, plan for 1-2y turnover; 88% free/reduced lunch — lower-income household profile, screen leases tightly.
- Market conditions: 79 active listings in the ZIP; 3 comparable units currently listed for rent nearby; rentals at typical pace (median 23d on market — plan ~3-4 weeks tenant-placement turnaround); 147 units permitted in Mahoning County in 2024 (0 in 5+ unit buildings).
Forward outlook
- Local home prices are declining (-3.0%/yr); year-one equity from $1k of loan paydown is wiped out by about $5k of value loss. Plan a longer hold.
- Mahoning County population projected at -14% by 2050 — secular population decline; favor cash flow + early exit over multi-decade hold.
Negotiation context
- Only 3 days on market — expect competitive offers; lowballing is unlikely to land.
- 3 sale attempts since 11y ago with the ask held roughly flat each time — persistent listings suggest the price (not the market) is what's stuck; bring a comps-based counter.
- Current owner paid $56k; list at $175k implies a 212% gain — meaningful room to come down on a strong offer.
Risks & watch-outs
- Watch-outs: built in 1956 — expect roof / HVAC / electrical / plumbing capex.
Questions for the listing agent
- What do current leases actually rent for vs. the listed asking? Can we see a recent rent roll and the last 12 months of T-12 income?
- Built in 1956 — when were the roof, HVAC, electrical panel, plumbing, and water heater last replaced?
- Is there a deadline driving the sale (1031 exchange, divorce, estate, relocation)? That informs how much negotiation room exists.
- Crime grade is F in this area — have there been break-ins, vandalism, or insurance claims at this property in the last 3 years? What carrier currently insures it and at what premium?
- The area grade is low — what's the realistic commute time and amenity access for the typical tenant pool here? Any planned neighborhood developments (good or bad) we should know about?
- What's the average days-on-market for RENTAL listings here right now (not sales)? A rising rental-DOM trend means longer vacancies and softer asking-rent achievability than the comps imply.
- What's the recent tenant-quality profile in this submarket — average credit score on applications, eviction rate, late-payment / NSF rate, and stable-employment percentage? A property-management company in the area should have these aggregated.
- How much new for-sale + rental construction is in the pipeline within 1–3 miles? Heavy new supply typically softens prices + rents 12–24 months out; constrained supply supports both.
Investment metrics
- 1% rule
- 0.72% ✗
- Cap rate
- 5.69%
- Cash-on-cash
- -2.16%
- DSCR
- 0.90
- GRM
- 11.5
CMA / ARV
- ARV (on-the-fly)
- $154,960
- Comps found
- 12
Show comp detail 12 sales within ~0.75 mi
| Address | Dist | Beds/Ba | Sqft | Sold | Price | $/sf | Match |
|---|---|---|---|---|---|---|---|
| 2934 Brunswick Rd | 0.19mi | 3/2.0 (+1) | 1,028 (-1%) | 1mo | $185,000 | $180 | 82 |
| 2821 Rexford Rd | 0.14mi | 3/2.0 (+1) | 1,088 (+5%) | 5mo | $207,500 | $191 | 75 |
| 1984 S Schenley Ave | 0.67mi | 2/2.0 | 1,021 (-2%) | 1mo | $165,000 | $162 | 63 |
| 2078 Cranbrook Dr | 0.60mi | 2/2.0 | 1,100 (+6%) | 2mo | $149,900 | $136 | 59 |
| 2592 Nadyne Dr | 0.29mi | 3/1.0 (+1) | 1,144 (+10%) | 5mo | $135,000 | $118 | 58 |
| 3286 S Wendover Cir | 0.35mi | 3/2.0 (+1) | 1,144 (+10%) | 3mo | $186,000 | $163 | 58 |
| 2569 S Schenley Ave | 0.32mi | 3/2.0 (+1) | 1,134 (+9%) | 8mo | $169,000 | $149 | 56 |
| 3380 Sunnybrooke Dr | 0.70mi | 3/1.0 (+1) | 960 (-8%) | 4mo | $105,500 | $110 | 45 |
| 2435 Canfield Rd | 0.60mi | 3/1.0 (+1) | 1,134 (+9%) | 9mo | $80,000 | $71 | 42 |
| 3185 Sunnybrooke Dr | 0.69mi | 3/1.0 (+1) | 1,144 (+10%) | 2mo | $168,000 | $147 | 42 |
| 3730 Baymar Dr | 0.64mi | 3/1.0 (+1) | 1,134 (+9%) | 10mo | $138,000 | $122 | 40 |
| 3325 Sunnybrooke Dr | 0.72mi | 3/2.0 (+1) | 910 (-12%) | 4mo | $173,000 | $190 | 35 |
Match score weights: distance 35% · size 25% · config 20% · recency 20%. Top-matched comps best support the ARV.
Projected returns pro-forma
-3.0% appreciation · 3.0% rent growth · sell at horizon
- IRR
- -19.9%
- Equity multiple
- 0.31×
- Total profit
- $-33,999
- Equity at exit
- $26,078
- IRR
- -12.9%
- Equity multiple
- 0.24×
- Total profit
- $-37,044
- Equity at exit
- $15,122
Cash invested: $48,972 (down + closing). Projections, not guarantees.
Landlord ↔ Tenant lean methodology
- Overall (STATE)
- 73 Landlord-Friendly
- State Ohio
- 73 Landlord-Friendly · R+6
- County
- — inherits STATE
- City
- — inherits STATE
ZIP-level market 44511
- Home prices YoY
- -12.6%
- Active inventory
- 79
- Price-to-rent
- 11.5×
Monthly cashflow live
- Estimated rent
- $1,265 medium interval (Pro) →
- Mortgage (P&I)
- −$917
- Tax from tax record
- −$97 /mo · $1,165/yr
- Insurance
- −$73
- HOA
- −$0
- Vacancy / Maint / Mgmt
- −$266
- Net cashflow
- $-88
Break-even live
Sensitivity live
| Price | -10% $11 | -5% $-38 | +0% $-88 | +5% $-137 | +10% $-187 |
|---|---|---|---|---|---|
| Rent | -10% $-188 | -5% $-138 | +0% $-88 | +5% $-38 | +10% $12 |
| Rate | -1.0pp $0 | -0.5pp $-43 | base $-88 | +0.5pp $-133 | +1.0pp $-179 |
UW: 25.0% down · 7.5% · 30yr · 1.5% tax · 5.0% vac · 8.0% maint · 8.0% mgmt
Financing live
Cash to close
- Down payment
- $43,725
- Closing costs
- $5,247
- Reserves months
- —
- Total cash needed
- —
Loan-product check · same deal, 3 products live
Conventional
25% down · 7.5% · 30yr
- Down + closing
- —
- Monthly P&I
- —
- Monthly cashflow
- —
- DSCR
- —
- Eligible?
- —
Personal DTI + credit; lowest rate.
DSCR
20% down · 8.5% · 30yr
- Down + closing
- —
- Monthly P&I
- —
- Monthly cashflow
- —
- DSCR
- —
- Eligible?
- —
No personal income docs; deal must DSCR.
Hard money
10% down · 12.0% · 12mo
- Down + closing
- —
- Monthly P&I
- —
- Monthly cashflow
- —
- DSCR
- —
- Eligible?
- —
Short-term bridge; refi at stabilization.
Rent comps 3 comps
| Address | Beds | Baths | Sqft | Rent | $/sqft | DOM | Units | Dist |
|---|---|---|---|---|---|---|---|---|
| 3968 Staatz Dr Youngstown, OH | 3.0 | 1.5 | 1112 | $1,650 | $1.48 | 45d | 1 | 1.05mi |
| 3639 Shelby Rd Youngstown, OH | 2.0 | 1.0 | 936 | $1,200 | $1.28 | 23d | 1 | 1.15mi |
| 4222 New Rd Youngstown, OH | 3.0 | 1.0 | 874 | $835 | $0.96 | 15d | 1 | 1.47mi |
Listing history 3 events
-
2026-06-15days on market $174,900 Active 3 DOM
-
2026-06-13remarks 699-char remark
-
2026-06-13$174,900 Active 1 DOM
ⓘ Source: listings_history table (triggers on properties + properties_extension) + one-shot
backfill from property_details.listing_events for pre-trigger history.
Tax reassessment forecast OH · Partial reset (capped growth)
- Current annual tax
- $1,165 · $97/mo
- Projected year-2 tax
- $1,947 · $162/mo
- Expected delta
- +$782/yr (+$65/mo · 67.1%)
ⓘ Screening estimate from a state-policy table — verify with the county assessor before closing.
Climate risk First Street
- Flood 1/10 Low FEMA zone X (unshaded) · 0% chance over 30 yrs
- Wildfire 1/10 Low
- Heat 3/10 Moderate 7 d/yr ≥98°F today · 17 d/yr by 30 yrs out
- Wind 1/10 Low
- Air quality 2/10 Low 1 unhealthy d/yr today · 2 by 30 yrs out
Nearby sold comps map
Loading sold comps map…
Walkable amenities ~0.75 mi
Loading nearby amenities…
Taxation est. · year 1
- Rental income
- $15,177
- − Mortgage interest
- −$9,797
- − Property taxes
- −$1,165
- − Insurance
- −$874
- − Repairs & maintenance
- −$1,214
- − Management
- −$1,214
- − Depreciation
- −$5,088
- Taxable loss
- −$4,175
- Est. tax savings @ 24.0%
- +$1,002
- After-tax cash flow
- $-53/yr
For passive investors: Depreciation is non-cash, so a rental often shows a tax loss while cash-flowing — sheltering income. Rental losses are passive: they offset passive income freely, and up to $25,000/yr can offset ordinary (W-2) income if you actively participate and your MAGI is under $100k (phasing out to $0 by $150k); unused losses carry forward. On sale, claimed depreciation is recaptured at up to 25%, and gains may owe capital-gains tax (a 1031 exchange can defer both). Figures are a year-1 estimate at your 24.0% rate — not tax advice; consult a CPA.
Schools (NCES district)
- District
- Youngstown City
- NCES district ID
- 3904516
- Math proficiency
- 8% ▼ -15.00%
- Reading proficiency
- 17% ▼ -10.00%
- Median HH income
- $25,257
- Composite
- 9.29/100
- National rank
- #9858
- State rank
- #649 of 656 in OH
Livability — Youngstown
- Score
- 81/100
- State rank
- #99
- US rank
- #1506
Category grades
Schools grade is shown separately in the Schools card above.
Census & demographics
- Census place
- Youngstown, OH
- County
- Mahoning County · 84,956 people
- City population
- 28,503
- Metro
- Youngstown-Warren-Boardman, OH-PA
- Population (ZIP)
- 18,909
- Household income
- $56,880
- Rent vs Own
- Severe rent burden
- 336.0
Population outlook (Mahoning County) Hauer SSP2
- Today (2025)
- 223,932 people
- By 2030
- 218,387 · -2.5%
- By 2040
- 205,367 · -8.3%
- By 2050
- 193,606 · -13.5%
- By 2075
- 173,694 · -22.4%
- By 2100
- 151,147 · -32.5%
Race, ethnicity, and origin ACS 2023
- Neighborhood character
- Majority White (64%)
- Race & ethnicity
- White 64% Black 23% Hispanic / Latino 8% Two or more races 7% Native American 1%
- Hispanic origin (detail)
- Mexican 2% Puerto Rican 4%
- Common ancestry
- Romanian 5% Lithuanian 1% Slovak 1%
- Foreign-born
- 1% · Canada
- Languages at home
- 96% English-only · Spanish 3%
Political lean MEDSL · Mahoning
- 2024 margin
- Lean R (+9.4) · D 44.9% · R 54.4%
- 2008→2024 swing
- -36.1pp toward R · 2008: 26.6pp · 2024: -9.4pp
- All cycles
- 2024: R+9.4 2020: R+1.9 2016: D+3.0 2012: D+27.7 2008: D+26.6
Not yet ingested
- Civics
- —
Market trends
- HPI YoY
- ▼ -40.81%
- Current HPI
- 283.9088
- Rent YoY
- —
- Metro
- Youngstown-Warren-Boardman, OH-PA
- State GDP YoY
- ▲ 1.98%
- F500 in state
- 48
Industry mix (Fortune 500 HQ in OH)
| Industry | F500 HQs | Revenue |
|---|---|---|
| Insurance | 3 | $145B |
|
||
| Industrial Machinery | 3 | $49B |
|
||
| Financial Services | 3 | $24B |
|
||
| Consumer Goods | 2 | $93B |
|
||
| Aerospace / Defense | 2 | $47B |
|
||
| Utilities | 2 | $33B |
|
||
Price history
+192.0% since first listed8 events — show timeline
- 2026-06-12 Listed $174,900 MLSNOW
- 2019-01-03 Listing Removed — MLSNOW
- 2018-11-01 Price Changed $77,000 MLSNOW
- 2018-10-23 Listed $79,900 MLSNOW
- 2015-11-06 Sold (Public Records) $56,000 Public Records
- 2015-11-06 Sold (MLS) $56,000 MLSNOW
- 2015-09-02 Pending — MLSNOW
- 2015-08-19 Listed $59,900 MLSNOW
Property tax history
-0.4%/yrLatest (2025): $1,165 · -13.0% YoY. Source: county tax records.
Cash-flow waterfall
monthlySold comps — $/sqft
last 12 mo · ≤1 miLoading sold comps…