203 E Congress St · Morenci, MI
Flood risk 1/10 · Minimal
- FEMA flood zone
- X (unshaded)
- Chance of flooding over 30 yrs
- 0.0%
- Est. flood insurance / yr
- $507 – $1,088
Fire risk 1/10 · Minimal
- Est. fire insurance / yr
- $784 – $1,456
Heat risk 3/10 · Minor
- Hot days now (above 100°F)
- 7 days/yr
- Hot days in 30 yrs
- 16 days/yr
Wind risk 2/10 · Minimal
- Chance of severe wind over 30 yrs
- —
Air-quality risk 2/10 · Minimal
- Unhealthy air days now
- 1 days/yr
- Unhealthy air days in 30 yrs
- 1 days/yr
Risk factors via First Street. Map © Google.
Why this score? — see what drove the D grade
The composite is a weighted blend of 9 inputs, each scored 0–100. Each bar is that input's sub-score; the figure is the points it added to the 100-point composite (weight × sub-score).
- Cash flow +10.2/30.0
- Appreciation +10.0/10.0
- ARV discount +7.9/15.0
- Livability +3.7/5.0
- Schools +3.0/10.0
- DSCR +2.9/10.0
- Rent growth +2.5/5.0
- Condition / age +2.5/5.0
- 1% rule +2.3/10.0
$179,900
🖨 Deal sheet (PDF) 📄 Offer letter ✓ Due diligence
Listing remarks MLS
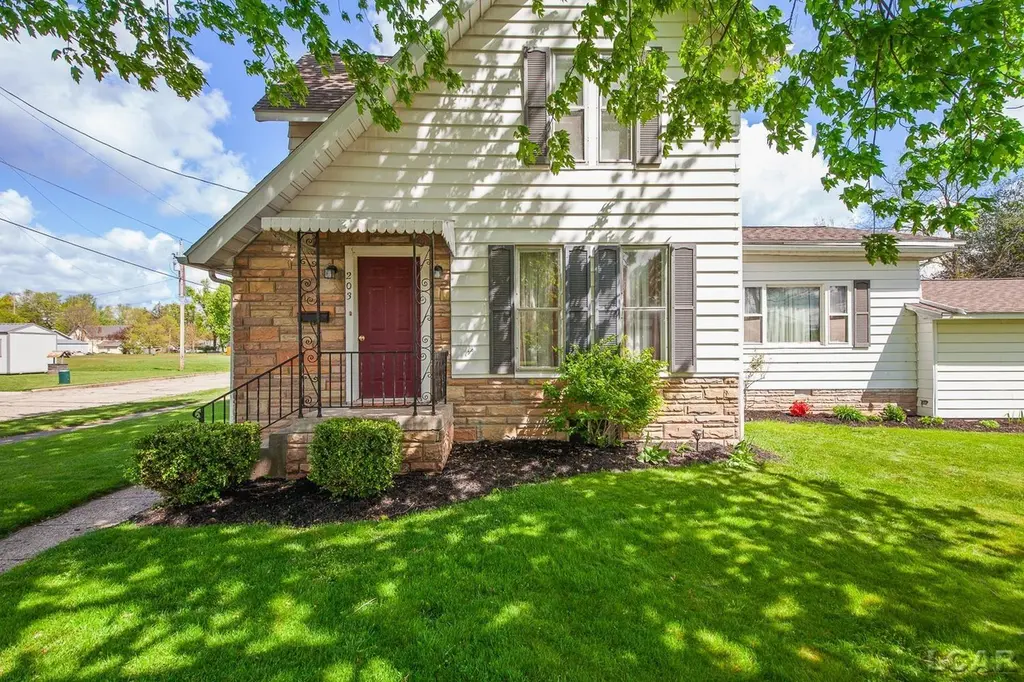
Discover your dream home in the charming City of Morenci, featuring three spacious bedrooms and one and a half bathrooms, with two family rooms, perfect for families or those seeking extra space. This nearly 2000 square foot residence is situated on a desirable corner lot in a tranquil neighborhood, offering both privacy and a sense of community. Enjoy the convenience of main floor laundry and an oversized garage, ideal for storage or hobbies. With affordable pricing and lower taxes, this property presents an exceptional opportunity for homeownership in a serene setting. Don't miss out on this remarkable value!
Key facts
- 8,712 sq ft lot
- 2 garage spots
- Built 1920
Property features AI
Finance
- Other: Residential zoning
- HOA & community: Homeowners association present
Exterior
- Parking: Attached garage with garage door opener; 2 garage spaces
- Utilities: Public water; Public sewer
- Home design: Single family residence; Two levels
- Construction: Aluminum siding
- Exterior features: Corner lot; Lot dimensions approximately 132 x 66; Approximately 0.2 acre
Interior
- Kitchen: Dishwasher; Disposal; Oven; Range; Refrigerator
- Bathrooms: 1 full bathroom; 1 half bathroom
- Heating & cooling: Central air conditioning; Forced air heating; Natural gas heat
- Interior features: Gas fireplace; Basement
- Laundry & utility: Washer; Dryer; Gas water heater
Neighborhood map
What this means for you Summary
Snapshot
- This is a 3-bed/1.0-bath single-family listed at $180k.
Deal economics
- At list price, monthly cash flow is $-102 ($-1k/yr) — negative.
- To cash-flow at today's rent, offer at most $162k (10.0% below list).
- To meet the 1% rule (rent ≥ 1% of price), the offer needs to be $130k (27.5% below list).
- Recommended offer: $130k (27.5% below list) — sets the bar for 1% rule.
Location & tenants
- Location reads 74/100 on livability (#167 in MI, #4,401 nationally) — a middle-class / working-renter tenant base. Strengths: crime A+, cost of living A+, health & safety A+; Watch: amenities F, commute F, employment F.
- Morenci Area Schools (rural): math 28% / reading 43% proficiency, ranked #283 of 540 in MI (top 52%) — families likely to look elsewhere, expect single-tenant / working-renter base with shorter leases.
- Zoned schools: Morenci Elementary School (math 32% / reading 37%, grade F, #744 of 1,397 statewide, top 57%, 243 students, 58% FRL); Morenci Middle And High School (math 27% / reading 47%, grade F, #334 of 713 statewide, top 51%, 289 students, 52% FRL).
- Market conditions: 19 active listings in the ZIP; 137 units permitted in Lenawee County in 2024 (0 in 5+ unit buildings).
Forward outlook
- In year one you build about $19k of equity ($1k loan paydown + $18k appreciation (10.0% local appreciation)).
- Lenawee County population projected at -18% by 2050 — secular population decline; favor cash flow + early exit over multi-decade hold.
- By year 2, paydown + projected appreciation supports a ~$31k cash-out refi (75% LTV) — recoverable capital for the next deal without selling this one.
Negotiation context
- Only 11 days on market — expect competitive offers; lowballing is unlikely to land.
- 2 sale attempts with the ask held roughly flat each time — persistent listings suggest the price (not the market) is what's stuck; bring a comps-based counter.
Risks & watch-outs
- Watch-outs: built in 1920 — expect roof / HVAC / electrical / plumbing capex.
Questions for the listing agent
- What do current leases actually rent for vs. the listed asking? Can we see a recent rent roll and the last 12 months of T-12 income?
- Built in 1920 — when were the roof, HVAC, electrical panel, plumbing, and water heater last replaced?
- Is there a deadline driving the sale (1031 exchange, divorce, estate, relocation)? That informs how much negotiation room exists.
- Schools are D-rated, which usually means shorter tenancies and higher turnover. Who's the typical renter profile here, and what's been the actual vacancy rate?
- The area grade is low — what's the realistic commute time and amenity access for the typical tenant pool here? Any planned neighborhood developments (good or bad) we should know about?
- What's the average days-on-market for RENTAL listings here right now (not sales)? A rising rental-DOM trend means longer vacancies and softer asking-rent achievability than the comps imply.
- What's the recent tenant-quality profile in this submarket — average credit score on applications, eviction rate, late-payment / NSF rate, and stable-employment percentage? A property-management company in the area should have these aggregated.
- How much new for-sale + rental construction is in the pipeline within 1–3 miles? Heavy new supply typically softens prices + rents 12–24 months out; constrained supply supports both.
Investment metrics
- 1% rule
- 0.73% ✗
- Cap rate
- 5.61%
- Cash-on-cash
- -2.44%
- DSCR
- 0.89
- GRM
- 11.5
CMA / ARV
- ARV (on-the-fly)
- $181,450
- Comps found
- 12
Show comp detail 12 sales within ~0.75 mi
| Address | Dist | Beds/Ba | Sqft | Sold | Price | $/sf | Match |
|---|---|---|---|---|---|---|---|
| 120 Cawley Rd | 0.14mi | 3/1.5 | 1,854 (-3%) | 6mo | $175,400 | $95 | 81 |
| 217 N East St | 0.13mi | 3/2.0 | 1,732 (-9%) | 2mo | $219,000 | $126 | 73 |
| 205 E Chestnut St | 0.12mi | 3/1.0 | 1,661 (-13%) | 8mo | $106,000 | $64 | 66 |
| 403 N Summit St | 0.10mi | 4/2.0 (+1) | 2,098 (+10%) | 5mo | $70,500 | $34 | 65 |
| 511 E Main St | 0.31mi | 4/1.0 (+1) | 1,747 (-8%) | 1mo | $175,000 | $100 | 65 |
| 135 N Washington St | 0.36mi | 2/1.0 (-1) | 2,005 (+5%) | 6mo | $137,500 | $69 | 65 |
| 102 E Main St | 0.22mi | 3/2.0 | 2,052 (+7%) | 14mo | $156,000 | $76 | 62 |
| 128 E Main St | 0.22mi | 4/2.0 (+1) | 2,176 (+14%) | 0mo | $209,900 | $96 | 57 |
| 405 E Coomer St | 0.25mi | 3/2.0 | 2,108 (+10%) | 14mo | $222,500 | $106 | 56 |
| 428 Buffalo St | 0.49mi | 4/1.0 (+1) | 2,034 (+6%) | 10mo | $139,900 | $69 | 53 |
| 128 E Lagrange St | 0.30mi | 4/1.5 (+1) | 2,182 (+14%) | 6mo | $100,000 | $46 | 50 |
| 413 Lincoln St | 0.70mi | 3/1.5 | 1,690 (-12%) | 10mo | $175,000 | $104 | 38 |
Match score weights: distance 35% · size 25% · config 20% · recency 20%. Top-matched comps best support the ARV.
Projected returns pro-forma
10.0% appreciation · 3.0% rent growth · sell at horizon
- IRR
- 22.5%
- Equity multiple
- 2.81×
- Total profit
- $91,417
- Equity at exit
- $162,068
- IRR
- 20.2%
- Equity multiple
- 6.44×
- Total profit
- $274,234
- Equity at exit
- $349,506
Cash invested: $50,372 (down + closing). Projections, not guarantees.
Landlord ↔ Tenant lean methodology
- Overall (STATE)
- 62 Landlord-Friendly
- State Michigan
- 62 Landlord-Friendly · EVEN
- County
- — inherits STATE
- City
- — inherits STATE
ZIP-level market 49256
- Home prices YoY
- 8.7%
- Active inventory
- 19
- Price-to-rent
- 11.5×
Monthly cashflow live
- Estimated rent
- $1,305 medium interval (Pro) →
- Mortgage (P&I)
- −$943
- Tax from tax record
- −$115 /mo · $1,378/yr
- Insurance
- −$75
- HOA
- −$0
- Vacancy / Maint / Mgmt
- −$274
- Net cashflow
- $-102
Break-even live
Sensitivity live
| Price | -10% $0 | -5% $-51 | +0% $-102 | +5% $-153 | +10% $-204 |
|---|---|---|---|---|---|
| Rent | -10% $-205 | -5% $-154 | +0% $-102 | +5% $-51 | +10% $1 |
| Rate | -1.0pp $-12 | -0.5pp $-57 | base $-102 | +0.5pp $-149 | +1.0pp $-196 |
UW: 25.0% down · 7.5% · 30yr · 1.5% tax · 5.0% vac · 8.0% maint · 8.0% mgmt
Financing live
Cash to close
- Down payment
- $44,975
- Closing costs
- $5,397
- Reserves months
- —
- Total cash needed
- —
Loan-product check · same deal, 3 products live
Conventional
25% down · 7.5% · 30yr
- Down + closing
- —
- Monthly P&I
- —
- Monthly cashflow
- —
- DSCR
- —
- Eligible?
- —
Personal DTI + credit; lowest rate.
DSCR
20% down · 8.5% · 30yr
- Down + closing
- —
- Monthly P&I
- —
- Monthly cashflow
- —
- DSCR
- —
- Eligible?
- —
No personal income docs; deal must DSCR.
Hard money
10% down · 12.0% · 12mo
- Down + closing
- —
- Monthly P&I
- —
- Monthly cashflow
- —
- DSCR
- —
- Eligible?
- —
Short-term bridge; refi at stabilization.
Listing history 10 events
-
2026-06-22days on market $179,900 Active 11 DOM
-
2026-06-21days on market $179,900 Active 10 DOM
-
2026-06-21days on market $179,900 Active 9 DOM
-
2026-06-18days on market $179,900 Active 7 DOM
-
2026-06-17days on market $179,900 Active 6 DOM
-
2026-06-16days on market $179,900 Active 5 DOM
-
2026-06-15days on market $179,900 Active 4 DOM
-
2026-06-13days on market $179,900 Active 2 DOM
-
2026-06-12remarks 618-char remark
Show marketing remark (618 chars)
Discover your dream home in the charming City of Morenci, featuring three spacious bedrooms and one and a half bathrooms, with two family rooms, perfect for families or those seeking extra space. This nearly 2000 square foot residence is situated on a desirable corner lot in a tranquil neighborhood, offering both privacy and a sense of community. Enjoy the convenience of main floor laundry and an oversized garage, ideal for storage or hobbies. With affordable pricing and lower taxes, this property presents an exceptional opportunity for homeownership in a serene setting. Don't miss out on this remarkable value!
-
2026-06-12$179,900 Active 1 DOM
Show marketing remark (618 chars)
Discover your dream home in the charming City of Morenci, featuring three spacious bedrooms and one and a half bathrooms, with two family rooms, perfect for families or those seeking extra space. This nearly 2000 square foot residence is situated on a desirable corner lot in a tranquil neighborhood, offering both privacy and a sense of community. Enjoy the convenience of main floor laundry and an oversized garage, ideal for storage or hobbies. With affordable pricing and lower taxes, this property presents an exceptional opportunity for homeownership in a serene setting. Don't miss out on this remarkable value!
ⓘ Source: listings_history table (triggers on properties + properties_extension) + one-shot
backfill from property_details.listing_events for pre-trigger history.
Tax reassessment forecast MI · Partial reset (capped growth)
- Current annual tax
- $1,378 · $115/mo
- Projected year-2 tax
- $2,074 · $173/mo
- Expected delta
- +$696/yr (+$58/mo · 50.5%)
ⓘ Screening estimate from a state-policy table — verify with the county assessor before closing.
Climate risk First Street
- Flood 1/10 Low FEMA zone X (unshaded) · 0% chance over 30 yrs
- Wildfire 1/10 Low
- Heat 3/10 Moderate 7 d/yr ≥100°F today · 16 d/yr by 30 yrs out
- Wind 2/10 Low
- Air quality 2/10 Low 1 unhealthy d/yr today · 1 by 30 yrs out
Nearby sold comps map
Loading sold comps map…
Walkable amenities ~0.75 mi
Loading nearby amenities…
Taxation est. · year 1
- Rental income
- $15,660
- − Mortgage interest
- −$10,077
- − Property taxes
- −$1,378
- − Insurance
- −$900
- − Repairs & maintenance
- −$1,253
- − Management
- −$1,253
- − Depreciation
- −$5,233
- Taxable loss
- −$4,434
- Est. tax savings @ 24.0%
- +$1,064
- After-tax cash flow
- $-163/yr
For passive investors: Depreciation is non-cash, so a rental often shows a tax loss while cash-flowing — sheltering income. Rental losses are passive: they offset passive income freely, and up to $25,000/yr can offset ordinary (W-2) income if you actively participate and your MAGI is under $100k (phasing out to $0 by $150k); unused losses carry forward. On sale, claimed depreciation is recaptured at up to 25%, and gains may owe capital-gains tax (a 1031 exchange can defer both). Figures are a year-1 estimate at your 24.0% rate — not tax advice; consult a CPA.
Schools (NCES district)
- District
- Morenci Area Schools
- NCES district ID
- 2624570
- Math proficiency
- 28% ▼ -5.00%
- Reading proficiency
- 43% ▲ 1.00%
- Median HH income
- $43,503
- Composite
- 30.09/100
- National rank
- #6340
- State rank
- #283 of 540 in MI
Livability — Morenci
- Score
- 74/100
- State rank
- #167
- US rank
- #4401
Category grades
Schools grade is shown separately in the Schools card above.
Census & demographics
- Census place
- Morenci, MI
- County
- Lenawee · 10,162 people
- Population (ZIP)
- 3,830
- Household income
- $60,982
- Rent vs Own
Population outlook (Lenawee County) Hauer SSP2
- Today (2025)
- 95,497 people
- By 2030
- 92,722 · -2.9%
- By 2040
- 85,641 · -10.3%
- By 2050
- 77,971 · -18.4%
- By 2075
- 60,043 · -37.1%
- By 2100
- 41,468 · -56.6%
Race, ethnicity, and origin ACS 2023
- Neighborhood character
- Predominantly White (90%)
- Race & ethnicity
- White 90% Hispanic / Latino 6% Two or more races 5%
- Hispanic origin (detail)
- Mexican 6%
- Common ancestry
- Romanian 2% Lithuanian 2% Italian 2%
- Foreign-born
- 1% · Canada
- Languages at home
- 97% English-only · Spanish 2%
Political lean MEDSL · Lenawee
- 2024 margin
- Strong R (+23.0) · D 37.8% · R 60.8% · Other 1.4%
- 2008→2024 swing
- -28.1pp toward R · 2008: 5.1pp · 2024: -23.0pp
- All cycles
- 2024: R+23.0 2020: R+19.9 2016: R+21.1 2012: R+1.3 2008: D+5.1
Not yet ingested
- Civics
- —
Market trends
- HPI YoY
- ▲ 24.27%
- Current HPI
- 304.604
- Rent YoY
- —
- Metro
- —
- State GDP YoY
- ▲ 1.37%
- F500 in state
- 28
Industry mix (Fortune 500 HQ in MI)
| Industry | F500 HQs | Revenue |
|---|---|---|
| Automotive Parts | 3 | $48B |
|
||
| Automotive | 2 | $372B |
|
||
| Chemicals | 1 | $45B |
|
||
| Automotive Retail | 1 | $29B |
|
||
| Healthcare / Medical Devices | 1 | $23B |
|
||
| Automotive Technology | 1 | $20B |
|
||
Price history
+0.0% since first listed2 events — show timeline
- 2026-06-12 Listed $179,900 REALCOMP
- 2026-06-12 Listed $179,900 MiRealSource-MiMLS
Property tax history
-1.6%/yrLatest (2025): $1,378 · +3.9% YoY. Source: county tax records.
Cash-flow waterfall
monthlySold comps — $/sqft
last 12 mo · ≤1 miLoading sold comps…