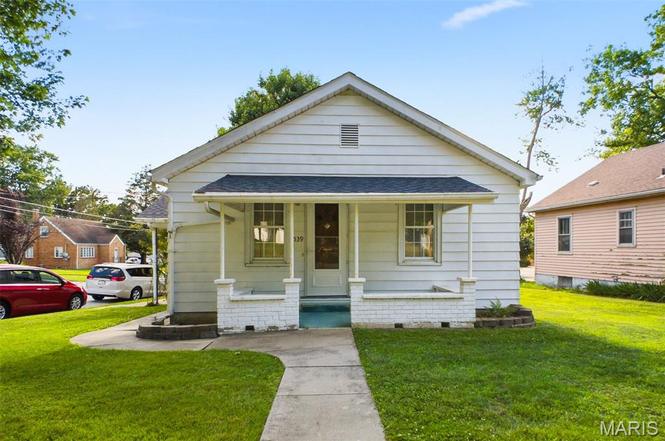
539 S Main St · Waterloo, IL
Flood risk 1/10 · Minimal
- FEMA flood zone
- X
- Chance of flooding over 30 yrs
- 0.0%
- Est. flood insurance / yr
- $473 – $860
Fire risk 1/10 · Minimal
- Est. fire insurance / yr
- $804 – $1,492
Heat risk 5/10 · Moderate
- Hot days now (above 106°F)
- 7 days/yr
- Hot days in 30 yrs
- 20 days/yr
Wind risk 2/10 · Minimal
- Chance of severe wind over 30 yrs
- 1.0%
Air-quality risk 1/10 · Minimal
- Unhealthy air days now
- 0 days/yr
- Unhealthy air days in 30 yrs
- 0 days/yr
Risk factors via First Street. Map © Google.
Why this score? — see what drove the C grade
The composite is a weighted blend of 9 inputs, each scored 0–100. Each bar is that input's sub-score; the figure is the points it added to the 100-point composite (weight × sub-score).
- Cash flow +19.0/30.0
- ARV discount +15.0/15.0
- DSCR +6.0/10.0
- 1% rule +4.9/10.0
- Livability +4.0/5.0
- Schools +3.8/10.0
- Rent growth +2.5/5.0
- Condition / age +2.5/5.0
- Appreciation +0.0/10.0
$150,000
🖨 Deal sheet 📄 Offer letter ✓ Due diligence
Listing remarks
Nestled in the heart of Waterloo and just a short distance to the charming downtown square, which is home to local restaurants, community events, and parades, this 2-bedroom, 2-bathroom home is full of character and waiting for its next chapter. With good bones and a layout that works, it's the perfect opportunity for a buyer ready to put their personal touch on a solid investment. The main floor features an eat-in kitchen with sliding doors that open to a sweet backyard retreat, complete with a gas grill hookup, ideal for summer evenings outdoors. Built-in hallway shelving adds a touch of character while keeping everyday life organized. Some major ticket items are already handled: enjoy pe
Key facts
- Newer roof
- Water heater
- Eat-in kitchen
Tags
Property features AI
Finance
- Other: Living area 1,410 (968 above grade, 492 below grade)
Exterior
- Parking: 2-car garage; Off-street parking
- Utilities: Public water; Public sewer; Electric: Other; Sewer connected; Water connected
- Home design: Single family residence; Private ownership; One level
- Construction: Vinyl siding; Shingle roof
- Exterior features: Patio; Back yard; Few trees
Interior
- Kitchen: Dishwasher; Free-standing gas range; Refrigerator; Eat-in kitchen with breakfast bar
- Bedrooms: 2 bedrooms on the main level
- Flooring: Carpet; Vinyl
- Bathrooms: 2 full bathrooms (one main level, one lower level)
- Heating & cooling: Radiant heat; Central air conditioning
- Interior features: Breakfast bar; Eat-in kitchen; Partially finished full basement
- Laundry & utility: Laundry room in basement
Neighborhood map
What this means for you Summary
Snapshot
- This is a 2-bed/3.0-bath single-family listed at $150k.
Deal economics
- At list price, monthly cash flow is $158 ($2k/yr) — positive.
- The deal already cash-flows at list — no discount required.
- To meet the 1% rule (rent ≥ 1% of price), the offer needs to be $148k (1.1% below list).
- Recommended offer: $148k (1.1% below list) — sets the bar for 1% rule.
- Cap rate 7.6% vs local median 2.9% in Waterloo — top-decile yield for the area; either an underpriced asset or a hidden risk that comps aren't pricing in. Stress-test before assuming the spread holds.
Location & tenants
- Location reads 81/100 on livability (#87 in IL, #1,409 nationally) — a professional / high-income tenant draw. Strengths: cost of living A+, housing A+, commute A-; Watch: amenities D, health & safety F.
- Waterloo CUSD 5 (town): math 38% / reading 46% proficiency, ranked #109 of 620 in IL (top 18%) — families likely to look elsewhere, expect single-tenant / working-renter base with shorter leases; only 16% free/reduced lunch — higher-income household profile.
- Zoned schools: Waterloo High School (math 37% / reading 37%, grade F, #107 of 693 statewide, top 17%, 895 students, 0% FRL) — zoned schools average 0% FRL vs 16% district-wide (16 pts lower); this property's tenant base skews higher-income than the district average.
- Market conditions: 72 active listings in the ZIP; 62 units permitted in Monroe County in 2024 (0 in 5+ unit buildings).
Forward outlook
- Local home prices are declining (-3.0%/yr); year-one equity from $1k of loan paydown is wiped out by about $4k of value loss. Plan a longer hold.
Negotiation context
- Only 2 days on market — expect competitive offers; lowballing is unlikely to land.
Risks & watch-outs
- Watch-outs: built in 1938 — expect roof / HVAC / electrical / plumbing capex.
- Climate carrying-cost: extreme-heat days projected 7→20/yr by 2055 (HVAC capex compounding) — expect insurance premiums to compound above CPI over the hold.
Questions for the listing agent
- Built in 1938 — when were the roof, HVAC, electrical panel, plumbing, and water heater last replaced?
- Is there a deadline driving the sale (1031 exchange, divorce, estate, relocation)? That informs how much negotiation room exists.
- Schools are A-rated — typically a magnet for longer-tenancy family renters. What's the average tenant stay here, and is there a school-zone premium baked into asking?
- What's the average days-on-market for RENTAL listings here right now (not sales)? A rising rental-DOM trend means longer vacancies and softer asking-rent achievability than the comps imply.
- What's the recent tenant-quality profile in this submarket — average credit score on applications, eviction rate, late-payment / NSF rate, and stable-employment percentage? A property-management company in the area should have these aggregated.
- How much new for-sale + rental construction is in the pipeline within 1–3 miles? Heavy new supply typically softens prices + rents 12–24 months out; constrained supply supports both.
Investment metrics
- 1% rule
- 0.99% ✗
- Cap rate
- 7.55%
- Cash-on-cash
- 4.50%
- DSCR
- 1.20
- GRM
- 8.4
CMA / ARV
- ARV (on-the-fly)
- $182,952
- Comps found
- 12
Show comp detail 12 sales within ~0.75 mi
| Address | Dist | Beds/Ba | Sqft | Sold | Price | $/sf | Match |
|---|---|---|---|---|---|---|---|
| 207 Hoener Ave | 0.14mi | 2/1.0 | 980 (+1%) | 2mo | $185,000 | $189 | 82 |
| 317 Walnut St | 0.30mi | 2/1.0 | 959 (-1%) | 9mo | $187,500 | $196 | 69 |
| 212 Hoener Ave | 0.16mi | 2/2.0 | 870 (-10%) | 8mo | $185,000 | $213 | 66 |
| 611 S Market St | 0.09mi | 2/2.0 | 1,086 (+12%) | 9mo | $140,000 | $129 | 64 |
| 320 W 3rd St | 0.46mi | 2/3.0 | 1,008 (+4%) | 13mo | $159,000 | $158 | 61 |
| 209 Oak St | 0.18mi | 2/1.0 | 832 (-14%) | 0mo | $198,000 | $238 | 60 |
| 601 Stiening St | 0.29mi | 2/1.0 | 1,040 (+7%) | 9mo | $189,900 | $183 | 59 |
| 508 Stiening St | 0.28mi | 2/1.0 | 840 (-13%) | 1mo | $199,900 | $238 | 56 |
| 335 W 4th St | 0.46mi | 2/1.0 | 1,062 (+10%) | 1mo | $142,500 | $134 | 53 |
| 606 Laurel Dr | 0.21mi | 3/1.5 (+1) | 1,092 (+13%) | 6mo | $170,000 | $156 | 53 |
| 421 S Church St | 0.18mi | 3/1.5 (+1) | 1,110 (+15%) | 6mo | $245,000 | $221 | 51 |
| 213 S Library St | 0.38mi | 3/2.0 (+1) | 1,070 (+10%) | 12mo | $175,000 | $164 | 46 |
Match score weights: distance 35% · size 25% · config 20% · recency 20%. Top-matched comps best support the ARV.
Projected returns pro-forma
-3.0% appreciation · 3.0% rent growth · sell at horizon
- IRR
- -9.3%
- Equity multiple
- 0.66×
- Total profit
- $-14,257
- Equity at exit
- $22,365
- IRR
- 0.2%
- Equity multiple
- 1.01×
- Total profit
- $549
- Equity at exit
- $12,969
Cash invested: $42,000 (down + closing). Projections, not guarantees.
Landlord ↔ Tenant lean methodology
- Overall (STATE)
- 43 Moderately Tenant-Leaning
- State Illinois
- 43 Moderately Tenant-Leaning · D+7
- County
- — inherits STATE
- City
- — inherits STATE
ZIP-level market 62298
- Active inventory
- 72
- Price-to-rent
- 8.4×
Monthly cashflow live
- Estimated rent
- $1,484 medium interval (Pro) →
- Mortgage (P&I)
- −$787
- Tax from tax record
- −$166 /mo · $1,988/yr
- Insurance
- −$62
- HOA
- −$0
- Vacancy / Maint / Mgmt
- −$312
- Net cashflow
- $158
Break-even live
UW: 25.0% down · 7.5% · 30yr · 1.5% tax · 5.0% vac · 8.0% maint · 8.0% mgmt
Financing live
Cash to close
- Down payment
- $37,500
- Closing costs
- $4,500
- Reserves months
- —
- Total cash needed
- —
Loan-product check · same deal, 3 products live
Conventional
25% down · 7.5% · 30yr
- Down + closing
- —
- Monthly P&I
- —
- Monthly cashflow
- —
- DSCR
- —
- Eligible?
- —
Personal DTI + credit; lowest rate.
DSCR
20% down · 8.5% · 30yr
- Down + closing
- —
- Monthly P&I
- —
- Monthly cashflow
- —
- DSCR
- —
- Eligible?
- —
No personal income docs; deal must DSCR.
Hard money
10% down · 12.0% · 12mo
- Down + closing
- —
- Monthly P&I
- —
- Monthly cashflow
- —
- DSCR
- —
- Eligible?
- —
Short-term bridge; refi at stabilization.
Listing history 3 events
-
2026-06-18days on market $150,000 Coming Soon 2 DOM
-
2026-06-17remarks 699-char remark
-
2026-06-17$150,000 Coming Soon 1 DOM
ⓘ Source: listings_history table (triggers on properties + properties_extension) + one-shot
backfill from property_details.listing_events for pre-trigger history.
Tax reassessment forecast IL · Partial reset (capped growth)
- Current annual tax
- $1,988 · $166/mo
- Projected year-2 tax
- $2,696 · $225/mo
- Expected delta
- +$709/yr (+$59/mo · 35.7%)
ⓘ Screening estimate from a state-policy table — verify with the county assessor before closing.
Climate risk First Street
- Flood 1/10 Low FEMA zone X · 0% chance over 30 yrs
- Wildfire 1/10 Low
- Heat 5/10 Major 7 d/yr ≥106°F today · 20 d/yr by 30 yrs out
- Wind 2/10 Low 100% chance of damaging wind over 30 yrs
- Air quality 1/10 Low 0 unhealthy d/yr today · 0 by 30 yrs out
Nearby sold comps map
Loading sold comps map…
Walkable amenities ~0.75 mi
Loading nearby amenities…
Taxation est. · year 1
- Rental income
- $17,808
- − Mortgage interest
- −$8,402
- − Property taxes
- −$1,988
- − Insurance
- −$750
- − Repairs & maintenance
- −$1,425
- − Management
- −$1,425
- − Depreciation
- −$4,364
- Taxable loss
- −$545
- Est. tax savings @ 24.0%
- +$131
- After-tax cash flow
- $2,022/yr
For passive investors: Depreciation is non-cash, so a rental often shows a tax loss while cash-flowing — sheltering income. Rental losses are passive: they offset passive income freely, and up to $25,000/yr can offset ordinary (W-2) income if you actively participate and your MAGI is under $100k (phasing out to $0 by $150k); unused losses carry forward. On sale, claimed depreciation is recaptured at up to 25%, and gains may owe capital-gains tax (a 1031 exchange can defer both). Figures are a year-1 estimate at your 24.0% rate — not tax advice; consult a CPA.
Schools (NCES district)
- District
- Waterloo CUSD 5
- NCES district ID
- 1741070
- Math proficiency
- 38% ▼ -18.00%
- Reading proficiency
- 46% ▼ -15.00%
- Median HH income
- $68,468
- Composite
- 37.89/100
- National rank
- #4317
- State rank
- #109 of 620 in IL
Livability — Waterloo
- Score
- 81/100
- State rank
- #87
- US rank
- #1409
Category grades
Schools grade is shown separately in the Schools card above.
Census & demographics
- Census place
- Waterloo, IL
- Population (ZIP)
- 17,907
Population outlook (Monroe County) Hauer SSP2
- Today (2025)
- 35,776 people
- By 2030
- 36,437 · +1.8%
- By 2040
- 36,967 · +3.3%
- By 2050
- 36,310 · +1.5%
- By 2075
- 34,133 · -4.6%
- By 2100
- 28,857 · -19.3%
Race, ethnicity, and origin ACS 2023
- Neighborhood character
- Predominantly White (97%)
- Race & ethnicity
- White 97% Two or more races 1% Hispanic / Latino 1%
- Common ancestry
- Romanian 4% Lithuanian 3% Slovak 1%
- Foreign-born
- 1% · South Korea, Canada
- Languages at home
- 99% English-only · Spanish 1%
Political lean MEDSL · Monroe
- 2024 margin
- Solid R (+36.3) · D 31.0% · R 67.3% · Other 1.7%
- 2008→2024 swing
- -25.6pp toward R · 2008: -10.7pp · 2024: -36.3pp
- All cycles
- 2024: R+36.3 2020: R+35.7 2016: R+37.2 2012: R+26.9 2008: R+10.7
Not yet ingested
- Civics
- —
Market trends
- HPI YoY
- ▼ -97.48%
- Current HPI
- 163.6536
- Rent YoY
- —
- Metro
- —
- State GDP YoY
- ▲ 1.59%
- F500 in state
- 60
Industry mix (Fortune 500 HQ in IL)
| Industry | F500 HQs | Revenue |
|---|---|---|
| Insurance | 4 | $201B |
|
||
| Consumer Goods | 4 | $87B |
|
||
| Industrial Machinery | 3 | $64B |
|
||
| Healthcare | 2 | $55B |
|
||
| Retail / Pharmacy | 1 | $148B |
|
||
| Agriculture / Food | 1 | $86B |
|
||
Price history
1 event — show timeline
- 2026-06-16 Coming Soon $150,000 MARIS as Distributed by MLS Grid
Property tax history
+2.2%/yrLatest (2024): $1,988 · +1.3% YoY. Source: county tax records.
Cash-flow waterfall
monthlySold comps — $/sqft
last 12 mo · ≤1 miLoading sold comps…