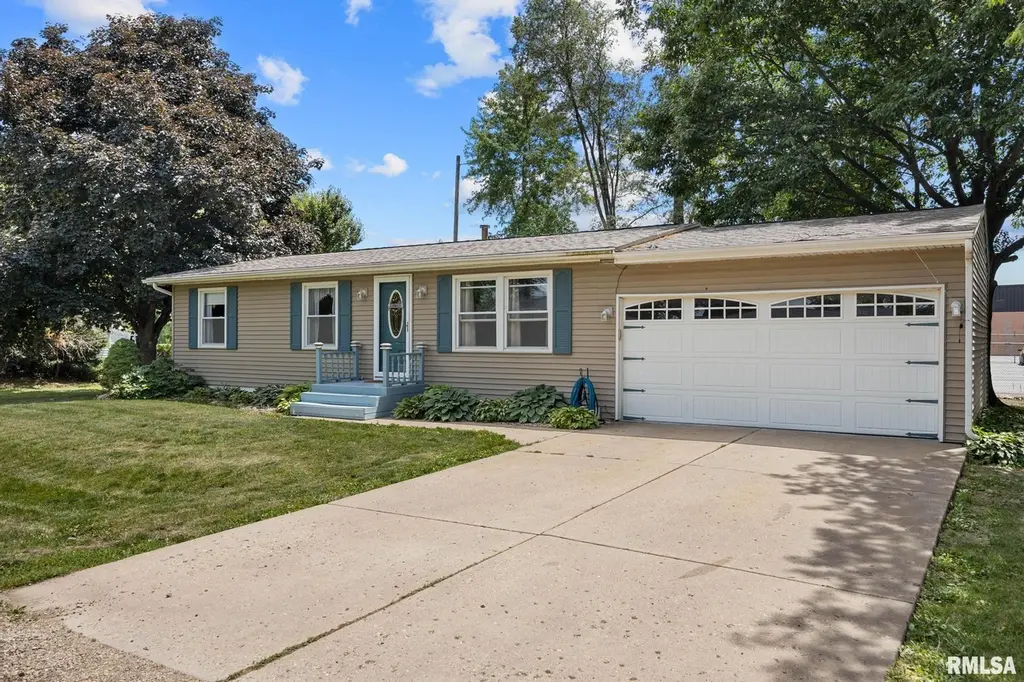
300 Miller Ct · Brimfield, IL
Flood risk 1/10 · Minimal
- FEMA flood zone
- —
- Chance of flooding over 30 yrs
- 0.0%
- Est. flood insurance / yr
- —
Fire risk 1/10 · Minimal
- Est. fire insurance / yr
- $804 – $1,492
Heat risk 3/10 · Minor
- Hot days now (above 104°F)
- 7 days/yr
- Hot days in 30 yrs
- 18 days/yr
Wind risk 2/10 · Minimal
- Chance of severe wind over 30 yrs
- 1.0%
Air-quality risk 3/10 · Minor
- Unhealthy air days now
- 1 days/yr
- Unhealthy air days in 30 yrs
- 3 days/yr
Risk factors via First Street. Map © Google.
Why this score? — see what drove the D+ grade
The composite is a weighted blend of 9 inputs, each scored 0–100. Each bar is that input's sub-score; the figure is the points it added to the 100-point composite (weight × sub-score).
- Cash flow +21.7/30.0
- DSCR +6.9/10.0
- 1% rule +5.9/10.0
- Schools +4.2/10.0
- Livability +3.2/5.0
- Rent growth +2.5/5.0
- Condition / age +2.5/5.0
- ARV discount +0.0/15.0
- Appreciation +0.0/10.0
$159,900
🖨 Deal sheet 📄 Offer letter ✓ Due diligence
Listing remarks MLS
Completely updated & beautifully maintained one owner 3BR/1BA ranch home on a cul de sac in Brimfield School district. Great kitchen with lots of cabinets & appliances, main floor laundry space. Tons of updates including newer flooring, fresh paint throughout, new roof 2017, new backyard shed 2019 with built-in shelving, landscaping, insulated garage with painted floor & gas heater, currently has a ramp that can be removed to convert back to 2 stalls, new steel door from garage into house, crawl space sump pump with alarm and the list goes on! Nice deck and partial privacy fence including back fence that could be finished off to fully enclose the backyard area. Everything is pristine and ready to go!
Key facts
- Gazebo
- Eat-in kitchen
- Backyard retreat
Tags
Property features AI
Exterior
- Parking: Attached 2-car garage
- Utilities: Public water; Public sewer
- Home design: Single-family residence; 920 building area; Not new construction; Shingle roof
- Construction: Built in 1981; Shingle roof; Crawl space foundation
- Exterior features: Shed(s); Hot tub; Level lot; Paved road access
Interior
- Kitchen: Refrigerator included
- Bedrooms: Three bedrooms (main level: Bedroom 1 — 12' x 11'; Bedroom 2 — 11.2' x 11.2'; Bedroom 3 — 9.4' x 8.5'); Egress windows in two bedrooms
- Flooring: Carpet in bedrooms and living areas; Vinyl in kitchen; Hardwood on deck area
- Bathrooms: One full bathroom
- Heating & cooling: Central air conditioning; Gas water heater
- Interior features: Cable available; Ceiling fan(s); High-speed internet
Neighborhood map
What this means for you Summary
Snapshot
- This is a 3-bed/1.0-bath single-family listed at $160k.
Deal economics
- At list price, monthly cash flow is $247 ($3k/yr) — positive.
- The deal already cash-flows at list — no discount required.
- Meets the 1% rule at list price ($2k rent vs $160k).
Location & tenants
- Location reads 63/100 on livability (#765 in IL) — a middle-class / working-renter tenant base. Strengths: cost of living A+, housing A; Watch: crime D+, amenities F, commute F.
- Brimfield CUSD 309 (rural): math 47% / reading 47% proficiency, ranked #67 of 620 in IL (top 11%) — families likely to look elsewhere, expect single-tenant / working-renter base with shorter leases; only 12% free/reduced lunch — higher-income household profile.
- Zoned schools: Brimfield High School (math 34% / reading 44%, grade F, #88 of 693 statewide, top 14%, 209 students, 0% FRL).
- Market conditions: 9 active listings in the ZIP; 73 units permitted in Peoria County in 2024 (0 in 5+ unit buildings).
Forward outlook
- Local home prices are declining (-3.0%/yr); year-one equity from $1k of loan paydown is wiped out by about $5k of value loss. Plan a longer hold.
- Peoria County population projected at -11% by 2050 — secular population decline; favor cash flow + early exit over multi-decade hold.
Negotiation context
- Only 3 days on market — expect competitive offers; lowballing is unlikely to land.
- 2 sale attempts since 4y ago with the ask held roughly flat each time — persistent listings suggest the price (not the market) is what's stuck; bring a comps-based counter.
- Current owner paid $125k; 28% above their basis — modest negotiation headroom, anchor on the comps not their cost.
Questions for the listing agent
- Is there a deadline driving the sale (1031 exchange, divorce, estate, relocation)? That informs how much negotiation room exists.
- Crime grade is D in this area — have there been break-ins, vandalism, or insurance claims at this property in the last 3 years? What carrier currently insures it and at what premium?
- The area grade is low — what's the realistic commute time and amenity access for the typical tenant pool here? Any planned neighborhood developments (good or bad) we should know about?
- What's the average days-on-market for RENTAL listings here right now (not sales)? A rising rental-DOM trend means longer vacancies and softer asking-rent achievability than the comps imply.
- What's the recent tenant-quality profile in this submarket — average credit score on applications, eviction rate, late-payment / NSF rate, and stable-employment percentage? A property-management company in the area should have these aggregated.
- How much new for-sale + rental construction is in the pipeline within 1–3 miles? Heavy new supply typically softens prices + rents 12–24 months out; constrained supply supports both.
Investment metrics
- 1% rule
- 1.09% ✓
- Cap rate
- 8.14%
- Cash-on-cash
- 6.61%
- DSCR
- 1.29
- GRM
- 7.7
CMA / ARV
- ARV (on-the-fly)
- $134,320
- Comps found
- 3
Show comp detail 3 sales within ~0.75 mi
| Address | Dist | Beds/Ba | Sqft | Sold | Price | $/sf | Match |
|---|---|---|---|---|---|---|---|
| 513 N Galena Rd | 0.17mi | 3/2.0 | 928 (+1%) | 9mo | $143,000 | $154 | 79 |
| 321 Miller Ct | 0.04mi | 2/1.0 (-1) | 960 (+4%) | 10mo | $139,900 | $146 | 78 |
| 319 Brim St | 0.40mi | 3/1.5 | 1,044 (+14%) | 15mo | $120,000 | $115 | 44 |
Match score weights: distance 35% · size 25% · config 20% · recency 20%. Top-matched comps best support the ARV.
Projected returns pro-forma
-3.0% appreciation · 3.0% rent growth · sell at horizon
- IRR
- -6.1%
- Equity multiple
- 0.77×
- Total profit
- $-10,166
- Equity at exit
- $23,842
- IRR
- 3.5%
- Equity multiple
- 1.26×
- Total profit
- $11,527
- Equity at exit
- $13,825
Cash invested: $44,772 (down + closing). Projections, not guarantees.
Landlord ↔ Tenant lean methodology
- Overall (STATE)
- 43 Moderately Tenant-Leaning
- State Illinois
- 43 Moderately Tenant-Leaning · D+7
- County
- — inherits STATE
- City
- — inherits STATE
ZIP-level market 61517
- Home prices YoY
- -11.9%
- Active inventory
- 9
- Price-to-rent
- 7.7×
Monthly cashflow live
- Estimated rent
- $1,735 medium interval (Pro) →
- Mortgage (P&I)
- −$839
- Tax from tax record
- −$219 /mo · $2,626/yr
- Insurance
- −$67
- HOA
- −$0
- Vacancy / Maint / Mgmt
- −$364
- Net cashflow
- $247
Break-even live
UW: 25.0% down · 7.5% · 30yr · 1.5% tax · 5.0% vac · 8.0% maint · 8.0% mgmt
Financing live
Cash to close
- Down payment
- $39,975
- Closing costs
- $4,797
- Reserves months
- —
- Total cash needed
- —
Loan-product check · same deal, 3 products live
Conventional
25% down · 7.5% · 30yr
- Down + closing
- —
- Monthly P&I
- —
- Monthly cashflow
- —
- DSCR
- —
- Eligible?
- —
Personal DTI + credit; lowest rate.
DSCR
20% down · 8.5% · 30yr
- Down + closing
- —
- Monthly P&I
- —
- Monthly cashflow
- —
- DSCR
- —
- Eligible?
- —
No personal income docs; deal must DSCR.
Hard money
10% down · 12.0% · 12mo
- Down + closing
- —
- Monthly P&I
- —
- Monthly cashflow
- —
- DSCR
- —
- Eligible?
- —
Short-term bridge; refi at stabilization.
Listing history 5 events
-
2026-06-03status $159,900 Pending 3 DOM
-
2026-06-02days on market $159,900 Active 3 DOM
-
2026-06-01days on market $159,900 Active 2 DOM
-
2026-05-31remarks 693-char remark
-
2026-05-31$159,900 Active 1 DOM
ⓘ Source: listings_history table (triggers on properties + properties_extension) + one-shot
backfill from property_details.listing_events for pre-trigger history.
Tax reassessment forecast IL · Partial reset (capped growth)
- Current annual tax
- $2,626 · $219/mo
- Projected year-2 tax
- $3,128 · $261/mo
- Expected delta
- +$502/yr (+$42/mo · 19.1%)
ⓘ Screening estimate from a state-policy table — verify with the county assessor before closing.
Climate risk First Street
- Flood 1/10 Low 0% chance over 30 yrs
- Wildfire 1/10 Low
- Heat 3/10 Moderate 7 d/yr ≥104°F today · 18 d/yr by 30 yrs out
- Wind 2/10 Low 100% chance of damaging wind over 30 yrs
- Air quality 3/10 Moderate 1 unhealthy d/yr today · 3 by 30 yrs out
Nearby sold comps map
Loading sold comps map…
Walkable amenities ~0.75 mi
Loading nearby amenities…
Taxation est. · year 1
- Rental income
- $20,819
- − Mortgage interest
- −$8,957
- − Property taxes
- −$2,626
- − Insurance
- −$800
- − Repairs & maintenance
- −$1,666
- − Management
- −$1,666
- − Depreciation
- −$4,652
- Taxable income
- $454
- Est. tax owed @ 24.0%
- −$109
- After-tax cash flow
- $2,850/yr
For passive investors: Depreciation is non-cash, so a rental often shows a tax loss while cash-flowing — sheltering income. Rental losses are passive: they offset passive income freely, and up to $25,000/yr can offset ordinary (W-2) income if you actively participate and your MAGI is under $100k (phasing out to $0 by $150k); unused losses carry forward. On sale, claimed depreciation is recaptured at up to 25%, and gains may owe capital-gains tax (a 1031 exchange can defer both). Figures are a year-1 estimate at your 24.0% rate — not tax advice; consult a CPA.
Schools (NCES district)
- District
- Brimfield CUSD 309
- NCES district ID
- 1707200
- Math proficiency
- 47% ▼ -6.00%
- Reading proficiency
- 47% ▼ -1.00%
- Median HH income
- $71,774
- Composite
- 42.39/100
- National rank
- #3237
- State rank
- #67 of 620 in IL
Livability — Brimfield
- Score
- 63/100
- State rank
- #765
- US rank
- #15379
Category grades
Schools grade is shown separately in the Schools card above.
Census & demographics
- Census place
- Brimfield, IL
- Population (ZIP)
- 3,154
Population outlook (Peoria County) Hauer SSP2
- Today (2025)
- 183,007 people
- By 2030
- 179,643 · -1.8%
- By 2040
- 171,782 · -6.1%
- By 2050
- 163,508 · -10.7%
- By 2075
- 140,178 · -23.4%
- By 2100
- 114,493 · -37.4%
Race, ethnicity, and origin ACS 2023
- Neighborhood character
- Predominantly White (97%)
- Race & ethnicity
- White 97% Two or more races 2% Hispanic / Latino 1%
- Common ancestry
- Slovak 4% Italian 3% Iranian 3%
- Foreign-born
- 1%
Political lean MEDSL · Peoria
- 2024 margin
- Toss-up / Even · D 51.5% · R 46.9% · Other 1.6%
- 2008→2024 swing
- -9.2pp toward R · 2008: 13.9pp · 2024: 4.7pp
- All cycles
- 2024: D+4.7 2020: D+6.3 2016: D+2.8 2012: D+4.4 2008: D+13.9
Not yet ingested
- Civics
- —
Market trends
- HPI YoY
- ▼ -29.88%
- Current HPI
- 221.1927
- Rent YoY
- —
- Metro
- —
- State GDP YoY
- ▲ 1.59%
- F500 in state
- 60
Industry mix (Fortune 500 HQ in IL)
| Industry | F500 HQs | Revenue |
|---|---|---|
| Insurance | 4 | $201B |
|
||
| Consumer Goods | 4 | $87B |
|
||
| Industrial Machinery | 3 | $64B |
|
||
| Healthcare | 2 | $55B |
|
||
| Retail / Pharmacy | 1 | $148B |
|
||
| Agriculture / Food | 1 | $86B |
|
||
Price history
+27.9% since first listed5 events — show timeline
- 2026-05-30 Listed $159,900 RMLSA as Distributed by MLS Grid
- 2022-06-23 Sold (Public Records) $125,000 Public Records
- 2022-06-22 Sold (MLS) $125,000 RMLSA as Distributed by MLS Grid
- 2022-05-14 Pending — RMLSA as Distributed by MLS Grid
- 2022-05-09 Listed $125,000 RMLSA as Distributed by MLS Grid
Property tax history
+4.6%/yrLatest (2024): $2,626 · +8.2% YoY. Source: county tax records.
Cash-flow waterfall
monthlySold comps — $/sqft
last 12 mo · ≤1 miLoading sold comps…