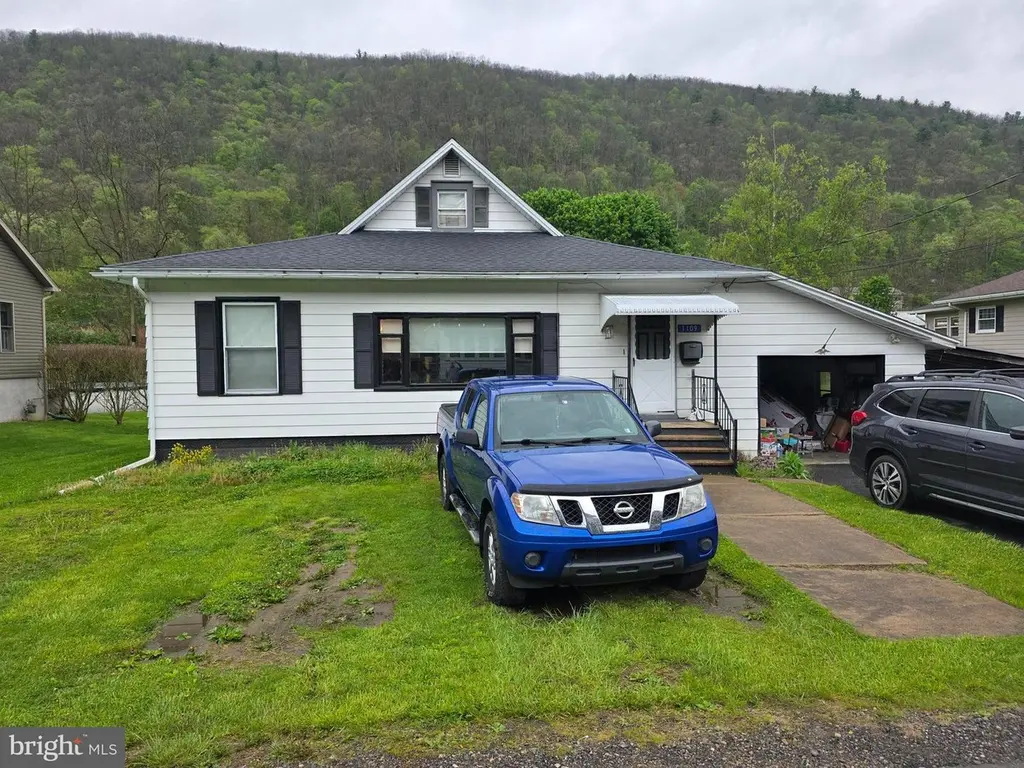
1109 Central Ave · Chapman, PA
Flood risk No data
- FEMA flood zone
- —
- Chance of flooding over 30 yrs
- —
- Est. flood insurance / yr
- —
Fire risk No data
- Est. fire insurance / yr
- —
Heat risk No data
- Hot days now (above threshold)
- —
- Hot days in 30 yrs
- —
Wind risk No data
- Chance of severe wind over 30 yrs
- —
Air-quality risk No data
- Unhealthy air days now
- —
- Unhealthy air days in 30 yrs
- —
Risk factors via First Street. Map © Google.
Why this score? — see what drove the C grade
The composite is a weighted blend of 9 inputs, each scored 0–100. Each bar is that input's sub-score; the figure is the points it added to the 100-point composite (weight × sub-score).
- Cash flow +26.3/30.0
- DSCR +8.9/10.0
- 1% rule +6.8/10.0
- Livability +3.3/5.0
- Schools +3.2/10.0
- Rent growth +2.5/5.0
- Condition / age +2.5/5.0
- ARV discount +2.0/15.0
- Appreciation +1.4/10.0
$99,995
🖨 Deal sheet 📄 Offer letter ✓ Due diligence
Listing remarks
Charming and efficient 1.5-story living awaits at 1109 Central Ave in Renovo, PA! This delightful 3-bedroom, 1-bath detached ranch style home spans 1,371 square feet and sits on a manageable . 21-acre lot. Enjoy complete peace of mind with central A/C, natural gas heat, and public water/sewer connections. The exterior features a 1-car garage and framed views of the stunning local mountains. Situated close to the Susquehanna River for outdoor enthusiasts and within easy reach of Lock Haven University, this property is perfect as a primary residence, student rental, or weekend getaway. Schedule your tour today!
Key facts
- Natural gas heat
- Framed views
- Central a/c
Tags
Property features AI
Exterior
- Parking: Attached front-entry garage with additional storage (1 garage space); Driveway with space for 4 cars; Total of 5 parking spaces
- Utilities: Public water; Private sewer; Electric cooling fuel; Natural gas heating fuel
- Home design: Detached property; Vinyl siding construction; Fee simple ownership
- Construction: Vinyl siding exterior; Permanent foundation; Above-grade structures
- Exterior features: Located in FEMA zone X500 (minimal flood risk); No tidal water
Interior
- Bedrooms: Two bedrooms on the main level; One bedroom on the upper level
- Bathrooms: One full bathroom on the main level; One full bathroom total
- Heating & cooling: Wall unit heating; Central air conditioning; Electric hot water
- Interior features: Estimated living area; Full basement; Two or more access exits
- Laundry & utility: Washer/dryer hookup
Neighborhood map
What this means for you Summary
Snapshot
- This is a 3-bed/1.0-bath single-family listed at $100k.
Deal economics
- At list price, monthly cash flow is $257 ($3k/yr) — positive.
- The deal already cash-flows at list — no discount required.
- Meets the 1% rule at list price ($1k rent vs $100k).
- Recommended offer: $98k (1.5% below list) — sets the bar for market timing.
- Cap rate 9.4% vs local median 1.7% in Chapman — top-decile yield for the area; either an underpriced asset or a hidden risk that comps aren't pricing in. Stress-test before assuming the spread holds.
Location & tenants
- Location reads 66/100 on livability (#1,053 in PA) — a middle-class / working-renter tenant base. Strengths: cost of living A+, housing A+, crime B; Watch: employment C-, schools D-, amenities F.
- Keystone Central SD (town): math 32% / reading 44% proficiency, ranked #384 of 539 in PA (top 71%) — families likely to look elsewhere, expect single-tenant / working-renter base with shorter leases.
- Market conditions: 18 active listings in the ZIP; 44 units permitted in Clinton County in 2024 (0 in 5+ unit buildings).
Forward outlook
- Local home prices are declining (-3.0%/yr); year-one equity from $691 of loan paydown is wiped out by about $3k of value loss. Plan a longer hold.
- Clinton County population projected to shrink 5% by 2050 — rents likely to lag national; underwrite the cash flow, not the appreciation.
- At projected returns (-3.0% appreciation + 3.0% rent growth), your $28k cash investment doubles in ~10 years — after that, you're playing with house money.
Negotiation context
- It's been on market 25 days — a 2% lower offer ($98k) is reasonable based on typical stale-listing flexibility.
- Current owner paid $70k; 43% above their basis — modest negotiation headroom, anchor on the comps not their cost.
Risks & watch-outs
- Watch-outs: built in 1937 — expect roof / HVAC / electrical / plumbing capex.
Questions for the listing agent
- Built in 1937 — when were the roof, HVAC, electrical panel, plumbing, and water heater last replaced?
- Is there a deadline driving the sale (1031 exchange, divorce, estate, relocation)? That informs how much negotiation room exists.
- Schools are D-rated, which usually means shorter tenancies and higher turnover. Who's the typical renter profile here, and what's been the actual vacancy rate?
- What's the average days-on-market for RENTAL listings here right now (not sales)? A rising rental-DOM trend means longer vacancies and softer asking-rent achievability than the comps imply.
- What's the recent tenant-quality profile in this submarket — average credit score on applications, eviction rate, late-payment / NSF rate, and stable-employment percentage? A property-management company in the area should have these aggregated.
- How much new for-sale + rental construction is in the pipeline within 1–3 miles? Heavy new supply typically softens prices + rents 12–24 months out; constrained supply supports both.
Investment metrics
- 1% rule
- 1.18% ✓
- Cap rate
- 9.38%
- Cash-on-cash
- 11.02%
- DSCR
- 1.49
- GRM
- 7.1
CMA / ARV
- ARV (on-the-fly)
- $89,115
- Comps found
- 2
Show comp detail 2 sales within ~0.75 mi
| Address | Dist | Beds/Ba | Sqft | Sold | Price | $/sf | Match |
|---|---|---|---|---|---|---|---|
| 1130 Market St | 0.12mi | 3/1.0 | 1,314 (-4%) | 15mo | $20,000 | $15 | 75 |
| 1011 Central Ave | 0.13mi | 3/1.0 | 1,216 (-11%) | 18mo | $79,000 | $65 | 60 |
Match score weights: distance 35% · size 25% · config 20% · recency 20%. Top-matched comps best support the ARV.
Projected returns pro-forma
-3.0% appreciation · 3.0% rent growth · sell at horizon
- IRR
- 0.2%
- Equity multiple
- 1.01×
- Total profit
- $182
- Equity at exit
- $14,910
- IRR
- 9.8%
- Equity multiple
- 1.76×
- Total profit
- $21,274
- Equity at exit
- $8,646
Cash invested: $27,999 (down + closing). Projections, not guarantees.
Landlord ↔ Tenant lean methodology
- Overall (STATE)
- 62 Landlord-Friendly
- State Pennsylvania
- 62 Landlord-Friendly · EVEN
- County
- — inherits STATE
- City
- — inherits STATE
ZIP-level market 17764
- Home prices YoY
- -6.0%
- Active inventory
- 18
- Price-to-rent
- 7.1×
Monthly cashflow live
- Estimated rent
- $1,176 medium interval (Pro) →
- Mortgage (P&I)
- −$524
- Tax from tax record
- −$106 /mo · $1,272/yr
- Insurance
- −$42
- HOA
- −$0
- Vacancy / Maint / Mgmt
- −$247
- Net cashflow
- $257
Break-even live
UW: 25.0% down · 7.5% · 30yr · 1.5% tax · 5.0% vac · 8.0% maint · 8.0% mgmt
Financing live
Cash to close
- Down payment
- $24,999
- Closing costs
- $3,000
- Reserves months
- —
- Total cash needed
- —
Loan-product check · same deal, 3 products live
Conventional
25% down · 7.5% · 30yr
- Down + closing
- —
- Monthly P&I
- —
- Monthly cashflow
- —
- DSCR
- —
- Eligible?
- —
Personal DTI + credit; lowest rate.
DSCR
20% down · 8.5% · 30yr
- Down + closing
- —
- Monthly P&I
- —
- Monthly cashflow
- —
- DSCR
- —
- Eligible?
- —
No personal income docs; deal must DSCR.
Hard money
10% down · 12.0% · 12mo
- Down + closing
- —
- Monthly P&I
- —
- Monthly cashflow
- —
- DSCR
- —
- Eligible?
- —
Short-term bridge; refi at stabilization.
Listing history 18 events
-
2026-06-18days on market $99,995 Active 25 DOM
-
2026-06-17days on market $99,995 Active 24 DOM
-
2026-06-16days on market $99,995 Active 23 DOM
-
2026-06-15days on market $99,995 Active 22 DOM
-
2026-06-14days on market $99,995 Active 20 DOM
-
2026-06-13price $99,995 Active 19 DOM
-
2026-06-12days on market $109,995 Active 19 DOM
-
2026-06-09days on market $109,995 Active 16 DOM
-
2026-06-08days on market $109,995 Active 15 DOM
-
2026-06-07days on market $109,995 Active 14 DOM
-
2026-06-04days on market $109,995 Active 10 DOM
-
2026-06-03price $109,995 Active 9 DOM
-
2026-06-02days on market $119,995 Active 9 DOM
-
2026-06-01days on market $119,995 Active 8 DOM
-
2026-05-31days on market $119,995 Active 7 DOM
-
2026-05-31days on market $119,995 Active 6 DOM
-
2026-05-24$119,995 Active
-
2020-08-14soldstatus $70,000
ⓘ Source: listings_history table (triggers on properties + properties_extension) + one-shot
backfill from property_details.listing_events for pre-trigger history.
Tax reassessment forecast PA · Partial reset (capped growth)
- Current annual tax
- $1,272 · $106/mo
- Projected year-2 tax
- $1,426 · $119/mo
- Expected delta
- +$154/yr (+$13/mo · 12.1%)
ⓘ Screening estimate from a state-policy table — verify with the county assessor before closing.
Nearby sold comps map
Loading sold comps map…
Walkable amenities ~0.75 mi
Loading nearby amenities…
Taxation est. · year 1
- Rental income
- $14,115
- − Mortgage interest
- −$5,601
- − Property taxes
- −$1,272
- − Insurance
- −$500
- − Repairs & maintenance
- −$1,129
- − Management
- −$1,129
- − Depreciation
- −$2,909
- Taxable income
- $1,574
- Est. tax owed @ 24.0%
- −$378
- After-tax cash flow
- $2,708/yr
For passive investors: Depreciation is non-cash, so a rental often shows a tax loss while cash-flowing — sheltering income. Rental losses are passive: they offset passive income freely, and up to $25,000/yr can offset ordinary (W-2) income if you actively participate and your MAGI is under $100k (phasing out to $0 by $150k); unused losses carry forward. On sale, claimed depreciation is recaptured at up to 25%, and gains may owe capital-gains tax (a 1031 exchange can defer both). Figures are a year-1 estimate at your 24.0% rate — not tax advice; consult a CPA.
Schools (NCES district)
- District
- Keystone Central SD
- NCES district ID
- 4212725
- Math proficiency
- 32% ▼ -6.00%
- Reading proficiency
- 44% ▼ -10.00%
- Median HH income
- $42,713
- Composite
- 32.09/100
- National rank
- #5810
- State rank
- #384 of 539 in PA
Livability — Chapman
- Score
- 66/100
- State rank
- #1053
- US rank
- #11836
Category grades
Schools grade is shown separately in the Schools card above.
Census & demographics
- Census place
- Farwell, PA
- Population (ZIP)
- 2,460
Population outlook (Clinton County) Hauer SSP2
- Today (2025)
- 39,048 people
- By 2030
- 38,812 · -0.6%
- By 2040
- 38,011 · -2.7%
- By 2050
- 36,931 · -5.4%
- By 2075
- 34,077 · -12.7%
- By 2100
- 29,683 · -24.0%
Race, ethnicity, and origin ACS 2023
- Neighborhood character
- Predominantly White (92%)
- Race & ethnicity
- White 92% Two or more races 7% Hispanic / Latino 2%
- Common ancestry
- Romanian 3% Italian 2% Russian 1%
- Foreign-born
- 1% · Canada
- Languages at home
- 99% English-only · Spanish 1%
Political lean MEDSL · Clinton
- 2024 margin
- Solid R (+40.9) · D 29.1% · R 70.0%
- 2008→2024 swing
- -38.1pp toward R · 2008: -2.8pp · 2024: -40.9pp
- All cycles
- 2024: R+40.9 2020: R+36.3 2016: R+34.8 2012: R+11.3 2008: R+2.8
Not yet ingested
- Civics
- —
Market trends
- HPI YoY
- ▼ -7.16%
- Current HPI
- 111.66
- Rent YoY
- —
- Metro
- —
- State GDP YoY
- ▲ 1.68%
- F500 in state
- 34
Industry mix (Fortune 500 HQ in PA)
| Industry | F500 HQs | Revenue |
|---|---|---|
| Healthcare | 2 | $309B |
|
||
| Insurance | 2 | $27B |
|
||
| Telecommunications / Media | 1 | $124B |
|
||
| Industrial Distribution | 1 | $22B |
|
||
| Financial Services | 1 | $20B |
|
||
| Chemicals / Materials | 1 | $18B |
|
||
Price history
+71.4% since first listed2 events — show timeline
- 2026-05-24 Listed $119,995 BRIGHT MLS
- 2020-08-14 Sold (Public Records) $70,000 Public Records
Property tax history
+11.1%/yrLatest (2026): $1,272 · +1.1% YoY. Source: county tax records.
Cash-flow waterfall
monthlySold comps — $/sqft
last 12 mo · ≤1 miLoading sold comps…