 🌊 Lakefront
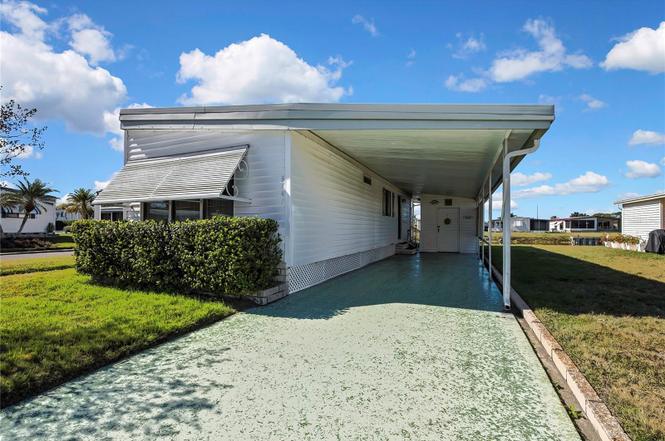
3141 Nantucket Dr · Elfers, FL
Flood risk 5/10 · Moderate
- FEMA flood zone
- X (shaded)
- Chance of flooding over 30 yrs
- 0.26%
- Est. flood insurance / yr
- $507 – $1,088
Fire risk 3/10 · Minor
- Est. fire insurance / yr
- $947 – $1,759
Heat risk 10/10 · Severe
- Hot days now (above 109°F)
- 6 days/yr
- Hot days in 30 yrs
- 23 days/yr
Wind risk 10/10 · Severe
- Chance of severe wind over 30 yrs
- 99.0%
Air-quality risk 2/10 · Minimal
- Unhealthy air days now
- 1 days/yr
- Unhealthy air days in 30 yrs
- 1 days/yr
Risk factors via First Street. Map © Google.
Why this score? — see what drove the C- grade
The composite is a weighted blend of 9 inputs, each scored 0–100. Each bar is that input's sub-score; the figure is the points it added to the 100-point composite (weight × sub-score).
- Cash flow +23.5/30.0
- DSCR +7.6/10.0
- 1% rule +6.1/10.0
- Schools +4.3/10.0
- Livability +3.9/5.0
- ARV discount +2.7/15.0
- Condition / age +2.5/5.0
- Rent growth +1.9/5.0
- Appreciation +0.0/10.0
$149,900
🖨 Deal sheet 📄 Offer letter ✓ Due diligence
Listing remarks
Here is your opportunity to watch the wildlife and beautiful sunsets from the finished enclosed porch or the outside concrete patio overlooking the lake for your enjoyment. Home feature laminate flooring, dining area, split bedrooms, 2 full baths, new front door, new washer, range/oven. Home comes completely furnished and features loads of storage and linen space. You OWN YOUR OWN LAND in this 55+ community with low monthly maintenance fee of $143.00 per month which includes, lawn maintenance, trash removal, heated year-round pool, Clubhouse, maintenance of private roads, and much more. Sold As Is. Buyer to verify all information that is deemed to be accurate. Easy to show. Measurements are
Key facts
- Laminate flooring
- Dining area
- New front door
Tags
Property features AI
Finance
- Other: Furnished; Directions: US 19 to East on Moog Rd. to Tanglewood Mobile Vlg.; right onto Chatford Dr.; left onto Nantucket
- Financial info: Total monthly fees $143; Total annual fees $1,716
- HOA & community: Association managed by Qualified Property Management; Monthly HOA $143 (includes common area taxes, pool, escrow reserves, grounds maintenance, management, trash); Association amenities: clubhouse, pool, recreation facilities, shuffleboard court, deed restrictions, fence restrictions, vehicle restrictions, sidewalks, street lights, wheelchair access; Buyer approval required; No truck/RV/motorcycle parking; Senior community; Pets allowed with restrictions (cats and dogs OK, breed restrictions, number limit, max pet weight 25 lbs)
Exterior
- Parking: Deeded parking; Driveway; Ground level parking pad; Tandem parking; Carport with 2 spaces
- Security: Wheelchair access (community); Lobby key required (community)
- Utilities: Public water; Public sewer; Electricity connected; Sewer connected; Water connected; Underground utilities
- Home design: Manufactured home (double wide); One story; Facing west; Completed condition; On lakefront with 50' of lake frontage and lake view/access
- Construction: Vinyl siding; Other construction materials; Other roof type; Crawlspace foundation; Built as double wide manufactured home
- Exterior features: Enclosed porch; Porch; Exterior lighting; Private mailbox; Sidewalk; Shed(s); Mature landscaping; Landscaped, level lot; Near public transit; Paved surfaces
Interior
- Kitchen: Microwave; Range; Refrigerator; Electric water heater
- Bedrooms: 2 bedrooms
- Flooring: Carpet; Laminate
- Bathrooms: 2 full bathrooms
- Heating & cooling: Central heating (electric); Central air conditioning
- Interior features: Eat-in kitchen; Thermostat; Walk-in closet(s); Window treatments; Great Room
- Laundry & utility: Washer; Dryer; Laundry located outside
Neighborhood map
What this means for you Summary
Snapshot
- This is a 2-bed/2.0-bath manufactured listed at $150k.
Deal economics
- At list price, monthly cash flow is $280 ($3k/yr) — positive.
- The deal already cash-flows at list — no discount required.
- Meets the 1% rule at list price ($2k rent vs $150k).
- Recommended offer: $132k (12.0% below list) — sets the bar for market timing.
- Cap rate 8.5% vs local median 4.7% in Elfers — top-decile yield for the area; either an underpriced asset or a hidden risk that comps aren't pricing in. Stress-test before assuming the spread holds.
Location & tenants
- Location reads 78/100 on livability (#167 in FL, #2,486 nationally) — a middle-class / working-renter tenant base. Strengths: cost of living A+, housing A+, health & safety A+; Watch: crime C-, employment D+, amenities D-.
- Pasco (suburban): math 50% / reading 52% proficiency, ranked #32 of 73 in FL (top 44%) — acceptable for families but not a draw, mixed tenant base, ~2y average lease.
- Market conditions: Rents soft (-2.5%/yr); 131 active listings in the ZIP; 40 comparable units currently listed for rent nearby; rentals at typical pace (median 15d on market — plan ~3-4 weeks tenant-placement turnaround); 6,765 units permitted in Pasco County in 2024 (1,250 in 5+ unit buildings).
- This rent runs 41% of the median local income ($49k/yr) — at the standard rent-burdened threshold; future hikes will face affordability resistance.
Forward outlook
- Local home prices are declining (-3.0%/yr); year-one equity from $1k of loan paydown is wiped out by about $4k of value loss. Plan a longer hold.
- Pasco County population projected at +29% by 2050 — long-run rental-demand tailwind backs the buy-and-hold thesis.
Negotiation context
- It's been on market 148 days — a 12% lower offer ($132k) is reasonable based on typical stale-listing flexibility.
Risks & watch-outs
- Climate carrying-cost: moderate flood risk; severe wind risk, 99% chance of damaging wind over 30y; extreme-heat days projected 6→23/yr by 2055 (HVAC capex compounding) — expect insurance premiums to compound above CPI over the hold.
Questions for the listing agent
- It's been on market 148 days. Have you received any prior offers? Is the seller open to a 12% concession, seller financing, or rate buy-down credit?
- Built in 1978 — when were the roof, HVAC, electrical panel, plumbing, and water heater last replaced?
- What does the HOA fee cover, when was the last increase, and are there any pending special assessments or reserve-fund shortfalls?
- Why hasn't it sold? Are there any deal-killer items the seller is aware of (foundation, flood, title, zoning, code violations)?
- Is there a deadline driving the sale (1031 exchange, divorce, estate, relocation)? That informs how much negotiation room exists.
- This sits on a lake — are riparian / water-frontage rights deeded with the parcel? Any dock permits, shoreline easements, or HOA water-use restrictions?
- What's the documented flood / surge / shoreline-erosion history here (FEMA AND non-FEMA — e.g., storm surge, creek backup, septic-field saturation)?
- Any water-quality or seasonal algae-bloom issues that affect tenant satisfaction or short-term-rental demand?
- What's the average days-on-market for RENTAL listings here right now (not sales)? A rising rental-DOM trend means longer vacancies and softer asking-rent achievability than the comps imply.
- What's the recent tenant-quality profile in this submarket — average credit score on applications, eviction rate, late-payment / NSF rate, and stable-employment percentage? A property-management company in the area should have these aggregated.
- How much new for-sale + rental construction is in the pipeline within 1–3 miles? Heavy new supply typically softens prices + rents 12–24 months out; constrained supply supports both.
Investment metrics
- 1% rule
- 1.11% ✓
- Cap rate
- 8.53%
- Cash-on-cash
- 8.00%
- DSCR
- 1.36
- GRM
- 7.5
CMA / ARV
- ARV (on-the-fly)
- $135,520
- Comps found
- 9
Show comp detail 9 sales within ~0.75 mi
| Address | Dist | Beds/Ba | Sqft | Sold | Price | $/sf | Match |
|---|---|---|---|---|---|---|---|
| 3217 Brewster Dr | 0.09mi | 2/2.0 | 1,152 (+3%) | 2mo | $96,500 | $84 | 90 |
| 3131 Bixler Ct | 0.06mi | 2/2.0 | 1,180 (+5%) | 3mo | $143,000 | $121 | 86 |
| 4720 Burney Dr | 0.14mi | 3/2.0 (+1) | 1,065 (-5%) | 1mo | $135,000 | $127 | 80 |
| 3230 Brewster Dr | 0.10mi | 2/2.0 | 1,260 (+12%) | 3mo | $118,000 | $94 | 72 |
| 3115 Bixler Ct | 0.07mi | 2/2.0 | 960 (-14%) | 2mo | $87,000 | $91 | 71 |
| 3035 Buckner Ct | 0.11mi | 2/2.0 | 1,056 (-6%) | 18mo | $193,000 | $183 | 70 |
| 3414 Chatford Dr | 0.26mi | 2/2.0 | 1,056 (-6%) | 12mo | $85,000 | $80 | 68 |
| 3301 Chatford Dr | 0.13mi | 2/2.0 | 960 (-14%) | 2mo | $145,000 | $151 | 68 |
| 3200 Birkdale Dr | 0.18mi | 2/2.0 | 960 (-14%) | 17mo | $140,000 | $146 | 54 |
Match score weights: distance 35% · size 25% · config 20% · recency 20%. Top-matched comps best support the ARV.
Projected returns pro-forma
-3.0% appreciation · 0.0% rent growth · sell at horizon
- IRR
- -7.5%
- Equity multiple
- 0.73×
- Total profit
- $-11,324
- Equity at exit
- $22,351
- IRR
- -2.3%
- Equity multiple
- 0.86×
- Total profit
- $-5,695
- Equity at exit
- $12,961
Cash invested: $41,972 (down + closing). Projections, not guarantees.
Landlord ↔ Tenant lean methodology
- Overall (STATE)
- 87 Strongly Landlord-Friendly
- State Florida
- 87 Strongly Landlord-Friendly · R+3
- County
- — inherits STATE
- City
- — inherits STATE
ZIP-level market 34690
- Home prices YoY
- -22.4%
- Rents YoY
- -2.5%
- Active inventory
- 131
- Price-to-rent
- 7.5×
Monthly cashflow live
- Estimated rent
- $1,669 high interval (Pro) →
- Mortgage (P&I)
- −$786
- Tax from tax record
- −$47 /mo · $563/yr
- Insurance
- −$62
- HOA
- −$143
- Vacancy / Maint / Mgmt
- −$350
- Net cashflow
- $280
Break-even live
UW: 25.0% down · 7.5% · 30yr · 1.5% tax · 5.0% vac · 8.0% maint · 8.0% mgmt
Financing live
Cash to close
- Down payment
- $37,475
- Closing costs
- $4,497
- Reserves months
- —
- Total cash needed
- —
Loan-product check · same deal, 3 products live
Conventional
25% down · 7.5% · 30yr
- Down + closing
- —
- Monthly P&I
- —
- Monthly cashflow
- —
- DSCR
- —
- Eligible?
- —
Personal DTI + credit; lowest rate.
DSCR
20% down · 8.5% · 30yr
- Down + closing
- —
- Monthly P&I
- —
- Monthly cashflow
- —
- DSCR
- —
- Eligible?
- —
No personal income docs; deal must DSCR.
Hard money
10% down · 12.0% · 12mo
- Down + closing
- —
- Monthly P&I
- —
- Monthly cashflow
- —
- DSCR
- —
- Eligible?
- —
Short-term bridge; refi at stabilization.
Rent comps 40 comps
| Address | Beds | Baths | Sqft | Rent | $/sqft | DOM | Units | Dist |
|---|---|---|---|---|---|---|---|---|
| 3433 Monticello St Holiday, FL | 3.0 | 1.5 | 960 | $1,650 | $1.72 | 24d | 1 | 0.30mi |
| 3252 Peterborough St Holiday, FL | 3.0 | 2.0 | 1290 | $1,631 | $1.26 | 5d | 1 | 0.32mi |
| 3511 Cambridge St New Port Richey, FL | 2.0 | 2.0 | 936 | $2,100 | $2.24 | 5d | 1 | 0.36mi |
| 5232 Sparrow Dr Holiday, FL | 2.0 | 1.0 | 976 | $1,975 | $2.02 | 24d | 1 | 0.41mi |
| 4723 Aegean Ave Holiday, FL | 2.0 | 1.0 | 1000 | $1,636 | $1.64 | 5d | 1 | 0.51mi |
| 2610 Templewood Dr Holiday, FL | 3.0 | 1.0 | 1056 | $1,800 | $1.70 | 5d | 1 | 0.56mi |
| 2552 Chancery Dr Holiday, FL | 2.0 | 1.0 | 816 | $1,595 | $1.95 | 24d | 1 | 0.57mi |
| 4620 Tropical Ln Holiday, FL | 2.0 | 1.0 | 1276 | $1,650 | $1.29 | 1d | 1 | 0.60mi |
| 4348 Plaza Dr Holiday, FL | 1.0–2.0 | 1.0–2.0 | 860 | $1,499 | $1.74 | 2d | 9 | 0.62mi |
| 2509 Sweetwood Dr Holiday, FL | 2.0 | 1.0 | 988 | $1,650 | $1.67 | 17d | 1 | 0.66mi |
| 3301 Rosefield Dr Holiday, FL | 3.0 | 2.0 | 1340 | $2,100 | $1.57 | 17d | 1 | 0.66mi |
| 3029 Corona Dr Holiday, FL | 3.0 | 2.0 | 894 | $1,950 | $2.18 | 5d | 1 | 0.70mi |
| 4205 Jordana Way Holiday, FL | 1.0–3.0 | 1.0–2.0 | 1027 | $1,404 | $1.37 | 2d | 13 | 0.70mi |
| 4835 Blossom Dr Holiday, FL | 2.0 | 2.0 | 1174 | $1,700 | $1.45 | 24d | 1 | 0.70mi |
| 2412 Arcadia Rd Holiday, FL | 3.0 | 1.0 | 1360 | $1,603 | $1.18 | 24d | 1 | 0.76mi |
| 5606 Mirada Dr Holiday, FL | 2.0 | 1.0 | 864 | $1,550 | $1.79 | 14d | 1 | 0.76mi |
| 3439 Clydesdale Dr Holiday, FL | 2.0 | 1.0 | 968 | $1,395 | $1.44 | 5d | 1 | 0.79mi |
| 4823 Longwood Ave Holiday, FL | 3.0 | 1.0 | 1122 | $1,800 | $1.60 | 5d | 1 | 0.84mi |
| 3847 Lighthouse Way New Port Richey, FL | 2.0 | 2.0 | 1144 | $1,595 | $1.39 | 21d | 1 | 0.86mi |
| 4356 Tahitian Gardens Cir Unit C Holiday, FL | 2.0 | 1.0 | 825 | $1,350 | $1.64 | 24d | 1 | 0.90mi |
| 4365 Tahitian Gardens Cir Unit C Holiday, FL | 2.0 | 1.0 | 825 | $1,400 | $1.70 | 24d | 1 | 0.91mi |
| 4354 Tahitian Gardens Cir Unit F Holiday, FL | 2.0 | 1.0 | 825 | $1,500 | $1.82 | 24d | 1 | 0.93mi |
| 4022 Davit Dr New Port Richey, FL | 2.0 | 2.0 | 1144 | $1,600 | $1.40 | 17d | 1 | 0.96mi |
| 4301 Straits Ln New Port Richey, FL | 3.0 | 1.5 | 1284 | $1,790 | $1.39 | 24d | 1 | 0.96mi |
| 4313 Tahitian Gardens Cir Unit C Holiday, FL | 2.0 | 1.5 | 825 | $1,300 | $1.58 | 14d | 1 | 0.97mi |
| 4031 Davit Dr New Port Richey, FL | 2.0 | 2.0 | 1144 | $1,600 | $1.40 | 17d | 1 | 0.97mi |
| 4124 Flamingo Dr New Port Richey, FL | 3.0 | 1.0 | 744 | $1,500 | $2.02 | 14d | 1 | 0.98mi |
| 4124 Flamingo Dr New Port Richey, FL | 3.0 | 1.0 | 744 | $1,500 | $2.02 | 3d | 1 | 0.98mi |
| 4351 Tahitian Gardens Cir Holiday, FL | 2.0 | 1.0 | 825 | $1,150 | $1.39 | 24d | 1 | 0.99mi |
| 5020 Vickers Dr New Port Richey, FL | 2.0 | 1.0 | 863 | $1,550 | $1.80 | 5d | 1 | 1.02mi |
| 4133 Grayton Dr New Port Richey, FL | 2.0 | 1.5 | 1068 | $1,727 | $1.62 | 5d | 1 | 1.02mi |
| 4117 Highland Loop New Port Richey, FL | 3.0 | 2.0 | 1384 | $1,599 | $1.16 | 12d | 1 | 1.05mi |
| 4326 Tahitian Gardens Cir Unit 14E Holiday, FL | 2.0 | 1.5 | 768 | $2,000 | $2.60 | 24d | 1 | 1.05mi |
| 2117 Calusa Trl Unit B Holiday, FL | 1.0 | 1.0 | 708 | $1,200 | $1.69 | 5d | 1 | 1.08mi |
| 2117 Calusa Trl Holiday, FL | 2.0 | 1.0 | 1205 | $1,600 | $1.33 | 5d | 1 | 1.08mi |
| 5906 Elkhorn Blvd Holiday, FL | 2.0 | 2.0 | 1128 | $1,395 | $1.24 | 14d | 1 | 1.08mi |
| 4337 Tahitian Gardens Cir Unit F Holiday, FL | 2.0 | 1.0 | 768 | $1,500 | $1.95 | 24d | 1 | 1.09mi |
| 3516 Sheryl Hill Dr Holiday, FL | 2.0 | 2.0 | 848 | $1,595 | $1.88 | 24d | 1 | 1.14mi |
| 4334 Tahitian Gardens Cir Unit C Holiday, FL | 2.0 | 1.0 | 768 | $1,450 | $1.89 | 24d | 1 | 1.14mi |
| 5319 Drift Tide Dr New Port Richey, FL | 2.0 | 1.5 | 1142 | $1,500 | $1.31 | 10d | 1 | 1.17mi |
HOA detail
- Monthly dues
- $143 · $1,716/yr
- Likely covers
- trashpool
Listing history 15 events
-
2026-06-18days on market $149,900 Active 148 DOM
-
2026-06-17days on market $149,900 Active 147 DOM
-
2026-06-16days on market $149,900 Active 146 DOM
-
2026-06-15days on market $149,900 Active 145 DOM
-
2026-06-13days on market $149,900 Active 143 DOM
-
2026-06-09days on market $149,900 Active 139 DOM
-
2026-06-08days on market $149,900 Active 138 DOM
-
2026-06-07days on market $149,900 Active 137 DOM
-
2026-06-04days on market $149,900 Active 134 DOM
-
2026-06-03days on market $149,900 Active 133 DOM
-
2026-06-02days on market $149,900 Active 132 DOM
-
2026-06-01days on market $149,900 Active 131 DOM
-
2026-05-31days on market $149,900 Active 130 DOM
-
2026-04-24price $149,900
-
2026-01-21$154,900 Active
ⓘ Source: listings_history table (triggers on properties + properties_extension) + one-shot
backfill from property_details.listing_events for pre-trigger history.
Tax reassessment forecast FL · Resets to sale price
- Current annual tax
- $563 · $47/mo
- Projected year-2 tax
- $1,244 · $104/mo
- Expected delta
- +$681/yr (+$57/mo · 120.8%)
ⓘ Screening estimate from a state-policy table — verify with the county assessor before closing.
Climate risk First Street
- Flood 5/10 Major FEMA zone X (shaded) · 26% chance over 30 yrs
- Wildfire 3/10 Moderate
- Heat 10/10 Extreme 6 d/yr ≥109°F today · 23 d/yr by 30 yrs out
- Wind 10/10 Extreme 99% chance of damaging wind over 30 yrs
- Air quality 2/10 Low 1 unhealthy d/yr today · 1 by 30 yrs out
Nearby sold comps map
Loading sold comps map…
Walkable amenities ~0.75 mi
Loading nearby amenities…
Taxation est. · year 1
- Rental income
- $20,027
- − Mortgage interest
- −$8,397
- − Property taxes
- −$563
- − Insurance
- −$750
- − Repairs & maintenance
- −$1,602
- − Management
- −$1,602
- − HOA
- −$1,716
- − Depreciation
- −$4,361
- Taxable income
- $1,036
- Est. tax owed @ 24.0%
- −$249
- After-tax cash flow
- $3,111/yr
For passive investors: Depreciation is non-cash, so a rental often shows a tax loss while cash-flowing — sheltering income. Rental losses are passive: they offset passive income freely, and up to $25,000/yr can offset ordinary (W-2) income if you actively participate and your MAGI is under $100k (phasing out to $0 by $150k); unused losses carry forward. On sale, claimed depreciation is recaptured at up to 25%, and gains may owe capital-gains tax (a 1031 exchange can defer both). Figures are a year-1 estimate at your 24.0% rate — not tax advice; consult a CPA.
Schools (NCES district)
- District
- Pasco
- NCES district ID
- 1201530
- Math proficiency
- 50% ▼ -10.00%
- Reading proficiency
- 52% ▼ -5.00%
- Median HH income
- $45,039
- Composite
- 43.14/100
- National rank
- #3074
- State rank
- #32 of 73 in FL
Livability — Elfers
- Score
- 78/100
- State rank
- #167
- US rank
- #2486
Category grades
Schools grade is shown separately in the Schools card above.
Census & demographics
- Census place
- Elfers, FL
- County
- Pasco County · 524,098 people
- Metro
- Tampa-St. Petersburg-Clearwater, FL
- Population (ZIP)
- 12,498
- Household income
- $49,401
- Rent vs Own
- Severe rent burden
- 625.0
Population outlook (Pasco County) Hauer SSP2
- Today (2025)
- 570,045 people
- By 2030
- 605,844 · +6.3%
- By 2040
- 674,806 · +18.4%
- By 2050
- 736,022 · +29.1%
- By 2075
- 862,900 · +51.4%
- By 2100
- 906,364 · +59.0%
Race, ethnicity, and origin ACS 2023
- Neighborhood character
- Predominantly White (70%)
- Race & ethnicity
- White 70% Hispanic / Latino 21% Two or more races 11% Black 5% Native American 2% Asian 1%
- Hispanic origin (detail)
- Mexican 4% Puerto Rican 7% Cuban 3% Dominican 2%
- Common ancestry
- Lithuanian 3% Romanian 2% Slovak 1%
- Foreign-born
- 12% · Canada, Jamaica, Vietnam
- Languages at home
- 78% English-only · Spanish 16% Arabic 2% Other Indo-European 2%
Political lean MEDSL · Pasco
- 2024 margin
- Strong R (+25.2) · D 36.9% · R 62.1% · Other 1.0%
- 2008→2024 swing
- -21.6pp toward R · 2008: -3.6pp · 2024: -25.2pp
- All cycles
- 2024: R+25.2 2020: R+20.1 2016: R+21.6 2012: R+6.7 2008: R+3.6
Not yet ingested
- Civics
- —
Market trends
- HPI YoY
- ▼ -91.40%
- Current HPI
- 316.5846
- Rent YoY
- ▼ -2.49%
- Metro
- Tampa-St. Petersburg-Clearwater, FL
- State GDP YoY
- ▲ 3.28%
- F500 in state
- 36
Industry mix (Fortune 500 HQ in FL)
| Industry | F500 HQs | Revenue |
|---|---|---|
| Industrial Technology | 2 | $29B |
|
||
| Insurance | 2 | $17B |
|
||
| Retail | 1 | $60B |
|
||
| Technology Distribution | 1 | $58B |
|
||
| Homebuilding | 1 | $35B |
|
||
| Technology Manufacturing | 1 | $35B |
|
||
Price history
-3.2% since first listed2 events — show timeline
- 2026-04-24 Price Changed $149,900 Stellar MLS as Distributed by MLS Grid
- 2026-01-21 Listed $154,900 Stellar MLS as Distributed by MLS Grid
Property tax history
+3.6%/yrLatest (2025): $563 · +2.5% YoY. Source: county tax records.
Cash-flow waterfall
monthlySold comps — $/sqft
last 12 mo · ≤1 miLoading sold comps…