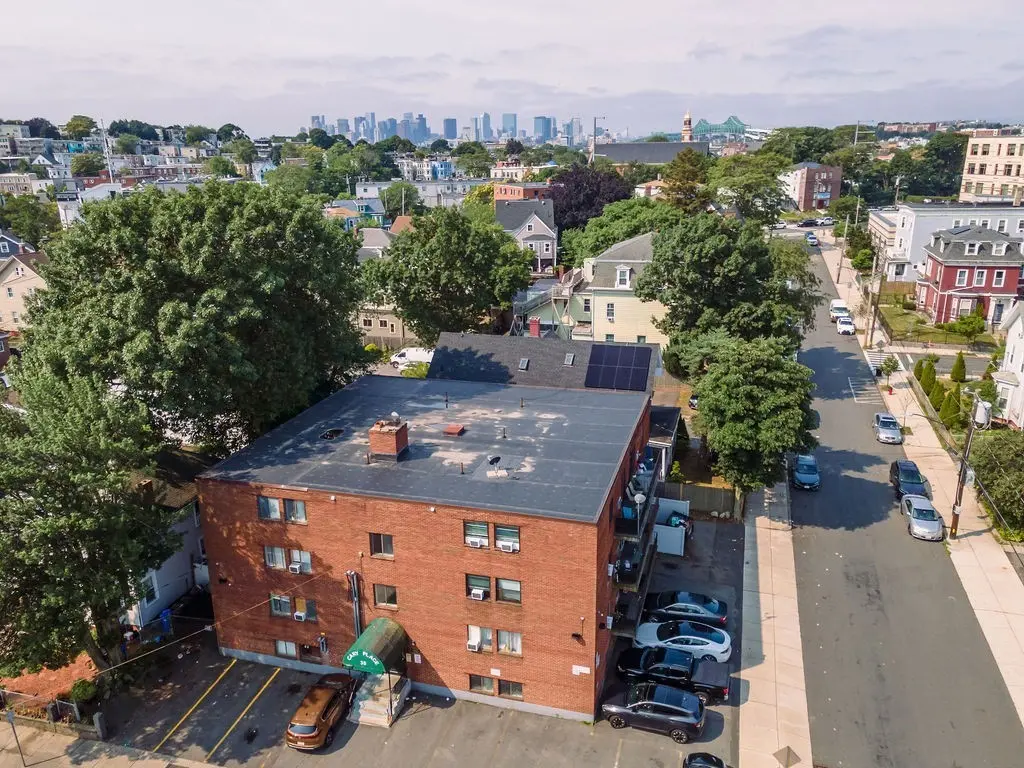
39 Cary Ave Unit 0-14 · Chelsea, MA
Flood risk 1/10 · Minimal
- FEMA flood zone
- X (unshaded)
- Chance of flooding over 30 yrs
- 0.0%
- Est. flood insurance / yr
- $507 – $1,088
Fire risk 1/10 · Minimal
- Est. fire insurance / yr
- $915 – $1,699
Heat risk 6/10 · Moderate
- Hot days now (above 95°F)
- 7 days/yr
- Hot days in 30 yrs
- 15 days/yr
Wind risk 6/10 · Moderate
- Chance of severe wind over 30 yrs
- 67.0%
Air-quality risk 3/10 · Minor
- Unhealthy air days now
- 3 days/yr
- Unhealthy air days in 30 yrs
- 3 days/yr
Risk factors via First Street. Map © Google.
Why this score? — see what drove the D grade
The composite is a weighted blend of 9 inputs, each scored 0–100. Each bar is that input's sub-score; the figure is the points it added to the 100-point composite (weight × sub-score).
- ARV discount +14.1/15.0
- Cash flow +9.1/30.0
- 1% rule +4.2/10.0
- Livability +3.7/5.0
- Rent growth +3.3/5.0
- DSCR +2.5/10.0
- Condition / age +2.5/5.0
- Schools +1.6/10.0
- Appreciation +0.0/10.0
$299,000
🖨 Deal sheet 📄 Offer letter ✓ Due diligence
Listing remarks MLS
GREAT INVESTMENT! Cash or portfolio loan required. Welcome to this inviting 2-bedroom condo located in the heart of Chelsea! Ideally positioned near a variety of popular restaurants and local shops, this home offers exceptional convenience with close proximity to both the Silver Line and the Commuter Rail—allowing for a quick commute to Haymarket in under 15 minutes or North Station. Inside, you’ll find a spacious layout with comfortable living areas and a kitchen featuring brand-new stainless steel appliances. Step outside to your private porch—perfect for morning coffee or unwinding in the evening. The unit also includes one dedicated parking space, a rare and highly desirable city amenity. Whether you’re a first-time buyer, downsizing, or seeking an investment opportunity, this condo offers flexible potential. Join us at one of our upcoming open houses!
Key facts
- Private porch
- $450 HOA
- Garage
Tags
Neighborhood map
What this means for you Summary
Snapshot
- This is a 2-bed/1.0-bath condo listed at $299k.
Deal economics
- At list price, monthly cash flow is $-232 ($-3k/yr) — negative.
- To cash-flow at today's rent, offer at most $258k (13.7% below list).
- To meet the 1% rule (rent ≥ 1% of price), the offer needs to be $276k (7.7% below list).
- Recommended offer: $258k (13.7% below list) — sets the bar for cash-flow.
- Cap rate 5.4% vs local median 3.6% in Chelsea — top-decile yield for the area; either an underpriced asset or a hidden risk that comps aren't pricing in. Stress-test before assuming the spread holds.
Location & tenants
- Location reads 73/100 on livability (#103 in MA) — a middle-class / working-renter tenant base. Strengths: amenities A+, commute A+, health & safety A+; Watch: schools D+, crime F, cost of living F.
- Chelsea (suburban): math 12% / reading 24% proficiency, ranked #294 of 302 in MA (top 97%) — low school quality limits family demand, transient renter base, plan for 1-2y turnover; 80% free/reduced lunch — lower-income household profile, screen leases tightly.
- Market conditions: Rents rising (+3.0%/yr); 48 active listings in the ZIP; 40 comparable units currently listed for rent nearby; rentals at typical pace (median 20d on market — plan ~3-4 weeks tenant-placement turnaround); 2,207 units permitted in Suffolk County in 2024 (1,961 in 5+ unit buildings).
- At $2,760/mo this rent would consume 46% of the median local household income ($72k/yr) (locally 3332% of renters already pay >50% of income on rent) — very limited rent-growth headroom before tenants either downsize or default.
Forward outlook
- Local home prices are declining (-3.0%/yr); year-one equity from $2k of loan paydown is wiped out by about $9k of value loss. Plan a longer hold.
- Suffolk County population projected at +37% by 2050 — long-run rental-demand tailwind backs the buy-and-hold thesis.
Negotiation context
- It's been on market 76 days — a 6% lower offer ($281k) is reasonable based on typical stale-listing flexibility.
- 4 sale attempts since 17y ago; this cycle's ask has dropped $16k (5%) from the opening price — seller is motivated, your offer sets the floor, not the list.
- Current owner paid $200k; 50% above their basis — modest negotiation headroom, anchor on the comps not their cost.
Risks & watch-outs
- Climate carrying-cost: major wind risk, 67% chance of damaging wind over 30y; extreme-heat days projected 7→15/yr by 2055 (HVAC capex compounding) — expect insurance premiums to compound above CPI over the hold.
Questions for the listing agent
- What do current leases actually rent for vs. the listed asking? Can we see a recent rent roll and the last 12 months of T-12 income?
- It's been on market 76 days. Have you received any prior offers? Is the seller open to a 14% concession, seller financing, or rate buy-down credit?
- Built in 1970 — when were the roof, HVAC, electrical panel, plumbing, and water heater last replaced?
- What does the HOA fee cover, when was the last increase, and are there any pending special assessments or reserve-fund shortfalls?
- Any open or pending special assessments — roof, HVAC, plumbing, elevator, façade? What's the per-unit balance and payoff schedule, and is the seller paying it off at close or rolling it to the buyer?
- Why hasn't it sold? Are there any deal-killer items the seller is aware of (foundation, flood, title, zoning, code violations)?
- Is there a deadline driving the sale (1031 exchange, divorce, estate, relocation)? That informs how much negotiation room exists.
- Schools are D-rated, which usually means shorter tenancies and higher turnover. Who's the typical renter profile here, and what's been the actual vacancy rate?
- Crime grade is F in this area — have there been break-ins, vandalism, or insurance claims at this property in the last 3 years? What carrier currently insures it and at what premium?
- The area grade is low — what's the realistic commute time and amenity access for the typical tenant pool here? Any planned neighborhood developments (good or bad) we should know about?
- What's the average days-on-market for RENTAL listings here right now (not sales)? A rising rental-DOM trend means longer vacancies and softer asking-rent achievability than the comps imply.
- What's the recent tenant-quality profile in this submarket — average credit score on applications, eviction rate, late-payment / NSF rate, and stable-employment percentage? A property-management company in the area should have these aggregated.
- How much new apartment / multifamily construction is in the pipeline within 1–3 miles? Heavy new supply (>2% of stock underway) typically softens rents 12–24 months out; light construction supports rent growth.
Investment metrics
- 1% rule
- 0.92% ✗
- Cap rate
- 5.36%
- Cash-on-cash
- -3.32%
- DSCR
- 0.85
- GRM
- 9.0
CMA / ARV
- ARV (median comp)
- $350,722
- List price
- $299,000
- Delta
- -14.75%
- Verdict
- UNDERPRICED
- Comps
- 20 within 1.0 mi
Projected returns pro-forma
-3.0% appreciation · 3.05% rent growth · sell at horizon
- IRR
- -21.7%
- Equity multiple
- 0.25×
- Total profit
- $-62,805
- Equity at exit
- $44,582
- IRR
- -15.0%
- Equity multiple
- 0.14×
- Total profit
- $-72,077
- Equity at exit
- $25,852
Cash invested: $83,720 (down + closing). Projections, not guarantees.
Landlord ↔ Tenant lean methodology
- Overall (STATE)
- 20 Strongly Tenant-Friendly
- State Massachusetts
- 20 Strongly Tenant-Friendly · D+15
- County
- — inherits STATE
- City
- — inherits STATE
ZIP-level market 02150
- Home prices YoY
- -20.3%
- Rents YoY
- 3.0%
- Active inventory
- 48
- Price-to-rent
- 9.0×
Monthly cashflow live
- Estimated rent
- $2,760 high interval (Pro) →
- Mortgage (P&I)
- −$1,568
- Tax from tax record
- −$269 /mo · $3,230/yr
- Insurance
- −$125
- HOA
- −$450
- Vacancy / Maint / Mgmt
- −$580
- Net cashflow
- $-232
Break-even live
UW: 25.0% down · 7.5% · 30yr · 1.5% tax · 5.0% vac · 8.0% maint · 8.0% mgmt
Financing live
Cash to close
- Down payment
- $74,750
- Closing costs
- $8,970
- Reserves months
- —
- Total cash needed
- —
Loan-product check · same deal, 3 products live
Conventional
25% down · 7.5% · 30yr
- Down + closing
- —
- Monthly P&I
- —
- Monthly cashflow
- —
- DSCR
- —
- Eligible?
- —
Personal DTI + credit; lowest rate.
DSCR
20% down · 8.5% · 30yr
- Down + closing
- —
- Monthly P&I
- —
- Monthly cashflow
- —
- DSCR
- —
- Eligible?
- —
No personal income docs; deal must DSCR.
Hard money
10% down · 12.0% · 12mo
- Down + closing
- —
- Monthly P&I
- —
- Monthly cashflow
- —
- DSCR
- —
- Eligible?
- —
Short-term bridge; refi at stabilization.
Rent comps 40 comps
| Address | Beds | Baths | Sqft | Rent | $/sqft | DOM | Units | Dist |
|---|---|---|---|---|---|---|---|---|
| 18 Tudor St Unit 4 Chelsea, MA | 1.0 | 1.0 | 800 | $1,850 | $2.31 | 43d | 1 | 0.13mi |
| 600 Broadway Everett, MA | 1.0–2.0 | 1.0–2.0 | 722 | $3,200 | $4.43 | 5d | 17 | 0.16mi |
| 178 Washington Ave Unit 205 Chelsea, MA | 1.0 | 1.0 | 650 | $2,300 | $3.54 | 43d | 1 | 0.21mi |
| 10 Forsyth St Chelsea, MA | 1.0–4.0 | 1.0–2.0 | 1176 | $2,200 | $1.87 | 5d | 3 | 0.22mi |
| 76 Eleanor St Unit 2 Chelsea, MA | 3.0 | 1.0 | 950 | $3,750 | $3.95 | 43d | 1 | 0.25mi |
| 221 Shurtleff St #6 Chelsea, MA | 2.0 | 1.0 | 915 | $2,295 | $2.51 | 10d | 1 | 0.26mi |
| 48 Washington Ave #203 Chelsea, MA | 1.0 | 1.0 | 595 | $1,900 | $3.19 | 21d | 1 | 0.27mi |
| 241 Walnut St Unit 3 Chelsea, MA | 2.0 | 1.0 | 750 | $2,500 | $3.33 | 24d | 1 | 0.28mi |
| 319 Spruce St Apt 2 Chelsea, MA | 1.0 | 1.0 | 700 | $1,985 | $2.84 | 1d | 1 | 0.28mi |
| 56 Franklin Ave Chelsea, MA | 2.0 | 1.0 | 687 | $2,650 | $3.85 | 18d | 2 | 0.31mi |
| 75 Bellingham St Chelsea, MA | 3.0 | 1.0 | 1100 | $3,100 | $2.82 | 43d | 1 | 0.32mi |
| 33 Bellingham St #2 Chelsea, MA | 3.0 | 1.0 | 1000 | $2,600 | $2.60 | 43d | 1 | 0.33mi |
| 466 Broadway Chelsea, MA | 1.0 | 1.0 | 600 | $1,880 | $3.13 | 17d | 1 | 0.36mi |
| 208 Cherry St Unit 12 Chelsea, MA | 1.0 | 1.0 | 560 | $2,100 | $3.75 | 24d | 1 | 0.37mi |
| 100 Heard St Chelsea, MA | 3.0 | 1.0–2.0 | 914 | $3,617 | $3.96 | 2d | 46 | 0.43mi |
| 165 Cottage St Chelsea, MA | 1.0–2.0 | 1.0–1.5 | 841 | $2,900 | $3.45 | 3d | 2 | 0.47mi |
| 150 Heard St Chelsea, MA | 2.0 | 2.0 | 1114 | $3,560 | $3.20 | 5d | 1 | 0.48mi |
| 150 Heard St Chelsea, MA | 2.0 | 2.0 | 1114 | $3,565 | $3.20 | 43d | 1 | 0.48mi |
| 83 Central Ave Unit 3 Chelsea, MA | 3.0 | 1.0 | 1001 | $2,900 | $2.90 | 18d | 1 | 0.49mi |
| 83 Central Ave Unit 3 Chelsea, MA | 3.0 | 1.0 | 1001 | $2,900 | $2.90 | 43d | 1 | 0.49mi |
| 1 Webster Ave Chelsea, MA | 1.0–2.0 | 1.0–2.0 | 804 | $2,675 | $3.33 | 2d | 4 | 0.49mi |
| 125 Central Ave Unit 3 Chelsea, MA | 3.0 | 1.0 | 990 | $3,100 | $3.13 | 24d | 1 | 0.49mi |
| 180 Central Ave Chelsea, MA | 2.0 | 1.0–2.0 | 756 | $3,307 | $4.37 | 3d | 13 | 0.50mi |
| 220 Spencer Ave #206 Chelsea, MA | 1.0 | 1.0 | 1086 | $2,100 | $1.93 | 43d | 1 | 0.51mi |
| 68 Maverick St Apt 2 Chelsea, MA | 3.0 | 1.0 | 900 | $2,900 | $3.22 | 43d | 1 | 0.51mi |
| 300 Washington Ave Unit 7 Chelsea, MA | 2.0 | 1.0 | 1000 | $2,495 | $2.50 | 43d | 1 | 0.51mi |
| 148 Pearl St Unit 1470143P Chelsea, MA | 2.0 | 1.0 | 882 | $4,326 | $4.90 | 15d | 1 | 0.54mi |
| 140 Pearl St Unit 1470142P Chelsea, MA | 2.0 | 1.0 | 871 | $5,496 | $6.31 | 15d | 1 | 0.55mi |
| 140 Pearl St Unit 1470150P Chelsea, MA | 1.0 | 1.0 | 678 | $3,840 | $5.66 | 16d | 1 | 0.55mi |
| 140 Pearl St Unit 1470146P Chelsea, MA | 1.0 | 1.0 | 775 | $4,944 | $6.38 | 23d | 1 | 0.55mi |
| 140 Pearl St Unit 1470152P Chelsea, MA | 1.0 | 1.0 | 570 | $3,995 | $7.01 | 21d | 1 | 0.55mi |
| 100 Stockton St Chelsea, MA | 2.0 | 1.0–2.0 | 787 | $3,184 | $4.04 | 3d | 11 | 0.57mi |
| 48 Shawmut St #1 Chelsea, MA | 3.0 | 1.0 | 1100 | $3,100 | $2.82 | 5d | 1 | 0.58mi |
| 179 Winnisimmet St Unit 5 Chelsea, MA | 1.0 | 1.0 | 600 | $1,800 | $3.00 | 5d | 1 | 0.64mi |
| 250 Vale St Chelsea, MA | 2.0 | 1.0–2.0 | 886 | $3,509 | $3.96 | 1d | 19 | 0.68mi |
| 255 Vale St Chelsea, MA | 2.0 | 1.0–2.0 | 903 | $3,478 | $3.85 | 1d | 19 | 0.70mi |
| 90 Chestnut St #1 Chelsea, MA | 2.0 | 1.0 | 1100 | $2,800 | $2.55 | 43d | 1 | 0.72mi |
| 25 Division St Chelsea, MA | 1.0 | 1.0 | 600 | $2,295 | $3.83 | 24d | 1 | 0.75mi |
| 25 Division St Chelsea, MA | 2.0 | 1.0 | 550 | $2,295 | $4.17 | 43d | 1 | 0.75mi |
| 118 Garfield Ave Unit 1 Chelsea, MA | 2.0 | 1.0 | 850 | $2,500 | $2.94 | 20d | 1 | 0.79mi |
HOA detail condo
- Monthly dues
- $450 · $5,400/yr
- Assessments
- None detected in remarks — confirm with the listing agent.
Listing history 26 events
-
2026-06-18days on market $299,000 Active 76 DOM
-
2026-06-17days on market $299,000 Active 75 DOM
-
2026-06-16days on market $299,000 Active 74 DOM
-
2026-06-15days on market $299,000 Active 73 DOM
-
2026-06-13days on market $299,000 Active 71 DOM
-
2026-06-09days on market $299,000 Active 67 DOM
-
2026-06-08days on market $299,000 Active 66 DOM
-
2026-06-07days on market $299,000 Active 65 DOM
-
2026-06-04days on market $299,000 Active 62 DOM
-
2026-06-03days on market $299,000 Active 61 DOM
-
2026-06-02days on market $299,000 Active 60 DOM
-
2026-06-01days on market $299,000 Active 59 DOM
-
2026-05-31days on market $299,000 Active 58 DOM
-
2026-05-17price $299,000 892-char remark
Show marketing remark (892 chars)
GREAT INVESTMENT! Cash or portfolio loan required. Welcome to this inviting 2-bedroom condo located in the heart of Chelsea! Ideally positioned near a variety of popular restaurants and local shops, this home offers exceptional convenience with close proximity to both the Silver Line and the Commuter Rail—allowing for a quick commute to Haymarket in under 15 minutes or North Station. Inside, you’ll find a spacious layout with comfortable living areas and a kitchen featuring brand-new stainless steel appliances. Step outside to your private porch—perfect for morning coffee or unwinding in the evening. The unit also includes one dedicated parking space, a rare and highly desirable city amenity. Whether you’re a first-time buyer, downsizing, or seeking an investment opportunity, this condo offers flexible potential. Join us at one of our upcoming open houses!
-
2026-04-02$315,000 New 892-char remark
Show marketing remark (892 chars)
GREAT INVESTMENT! Cash or portfolio loan required. Welcome to this inviting 2-bedroom condo located in the heart of Chelsea! Ideally positioned near a variety of popular restaurants and local shops, this home offers exceptional convenience with close proximity to both the Silver Line and the Commuter Rail—allowing for a quick commute to Haymarket in under 15 minutes or North Station. Inside, you’ll find a spacious layout with comfortable living areas and a kitchen featuring brand-new stainless steel appliances. Step outside to your private porch—perfect for morning coffee or unwinding in the evening. The unit also includes one dedicated parking space, a rare and highly desirable city amenity. Whether you’re a first-time buyer, downsizing, or seeking an investment opportunity, this condo offers flexible potential. Join us at one of our upcoming open houses!
-
2016-11-30soldstatus $200,000 Sold 275-char remark
Show marketing remark (275 chars)
Welcome To This Top Floor W/ Private Porch Off The Living Room. Unit Has Been Recently Renovated Along W/ Building. Hardwood Floors Throughout The Unit Including The 2 Bedrooms. Also This Unit Is Available W/ 1 Off-Street Parking Spot. This Unit Is Vacant And Priced To SELL!
-
2016-10-07status Under Agreement 275-char remark
Show marketing remark (275 chars)
Welcome To This Top Floor W/ Private Porch Off The Living Room. Unit Has Been Recently Renovated Along W/ Building. Hardwood Floors Throughout The Unit Including The 2 Bedrooms. Also This Unit Is Available W/ 1 Off-Street Parking Spot. This Unit Is Vacant And Priced To SELL!
-
2016-10-05$179,000 New 275-char remark
Show marketing remark (275 chars)
Welcome To This Top Floor W/ Private Porch Off The Living Room. Unit Has Been Recently Renovated Along W/ Building. Hardwood Floors Throughout The Unit Including The 2 Bedrooms. Also This Unit Is Available W/ 1 Off-Street Parking Spot. This Unit Is Vacant And Priced To SELL!
-
2010-01-07soldstatus $52,000 Sold
-
2009-12-02historical Under Agreement
-
2009-11-24status Back On Market
-
2009-11-23price $44,900
-
2009-11-04historical Under Agreement
-
2009-10-20$47,900 New
-
1992-12-09soldstatus $31,000
-
1987-07-14soldstatus $90,000
ⓘ Source: listings_history table (triggers on properties + properties_extension) + one-shot
backfill from property_details.listing_events for pre-trigger history.
Tax reassessment forecast MA · Partial reset (capped growth)
- Current annual tax
- $3,230 · $269/mo
- Projected year-2 tax
- $3,454 · $288/mo
- Expected delta
- +$224/yr (+$19/mo · 6.9%)
ⓘ Screening estimate from a state-policy table — verify with the county assessor before closing.
Climate risk First Street
- Flood 1/10 Low FEMA zone X (unshaded) · 0% chance over 30 yrs
- Wildfire 1/10 Low
- Heat 6/10 Major 7 d/yr ≥95°F today · 15 d/yr by 30 yrs out
- Wind 6/10 Major 67% chance of damaging wind over 30 yrs
- Air quality 3/10 Moderate 3 unhealthy d/yr today · 3 by 30 yrs out
Nearby sold comps map
Loading sold comps map…
Walkable amenities ~0.75 mi
Loading nearby amenities…
Taxation est. · year 1
- Rental income
- $33,117
- − Mortgage interest
- −$16,749
- − Property taxes
- −$3,230
- − Insurance
- −$1,495
- − Repairs & maintenance
- −$2,649
- − Management
- −$2,649
- − HOA
- −$5,400
- − Depreciation
- −$8,698
- Taxable loss
- −$7,754
- Est. tax savings @ 24.0%
- +$1,861
- After-tax cash flow
- $-918/yr
For passive investors: Depreciation is non-cash, so a rental often shows a tax loss while cash-flowing — sheltering income. Rental losses are passive: they offset passive income freely, and up to $25,000/yr can offset ordinary (W-2) income if you actively participate and your MAGI is under $100k (phasing out to $0 by $150k); unused losses carry forward. On sale, claimed depreciation is recaptured at up to 25%, and gains may owe capital-gains tax (a 1031 exchange can defer both). Figures are a year-1 estimate at your 24.0% rate — not tax advice; consult a CPA.
Schools (NCES district)
- District
- Chelsea
- NCES district ID
- 2503540
- Math proficiency
- 12% ▼ -15.00%
- Reading proficiency
- 24% ▼ -8.00%
- Median HH income
- $46,339
- Composite
- 15.86/100
- National rank
- #9259
- State rank
- #294 of 302 in MA
Livability — Chelsea
- Score
- 73/100
- State rank
- #103
- US rank
- #5375
Category grades
Schools grade is shown separately in the Schools card above.
Census & demographics
- Census place
- Chelsea, MA
- County
- Suffolk County · 777,335 people
- City population
- 39,908
- Metro
- Boston-Cambridge-Newton, MA-NH
- Population (ZIP)
- 39,908
- Household income
- $72,179
- Rent vs Own
- Severe rent burden
- 3332.0
Population outlook (Suffolk County) Hauer SSP2
- Today (2025)
- 915,464 people
- By 2030
- 983,798 · +7.5%
- By 2040
- 1,119,602 · +22.3%
- By 2050
- 1,255,187 · +37.1%
- By 2075
- 1,534,434 · +67.6%
- By 2100
- 1,748,505 · +91.0%
Race, ethnicity, and origin ACS 2023
- Neighborhood character
- Predominantly Hispanic (65%)
- Race & ethnicity
- Hispanic / Latino 65% Two or more races 51% White 20% Black 6% Asian 3%
- Hispanic origin (detail)
- Puerto Rican 9% Dominican 4%
- Common ancestry
- Estonian 2% Romanian 1% Lithuanian 1%
- Foreign-born
- 45% · Canada, Jamaica, China
- Languages at home
- 30% English-only · Spanish 59% Other Indo-European 3% Arabic 2%
Political lean MEDSL · Suffolk
- 2024 margin
- Solid D (+52.5) · D 74.8% · R 22.4% · Other 2.8%
- 2008→2024 swing
- -3.2pp toward R · 2008: 55.7pp · 2024: 52.5pp
- All cycles
- 2024: D+52.5 2020: D+63.2 2016: D+63.0 2012: D+56.7 2008: D+55.7
Not yet ingested
- Civics
- —
Market trends
- HPI YoY
- ▼ -101.21%
- Current HPI
- 397.5973
- Rent YoY
- ▲ 3.05%
- Metro
- Boston-Cambridge-Newton, MA-NH
- State GDP YoY
- ▲ 2.28%
- F500 in state
- 38
Industry mix (Fortune 500 HQ in MA)
| Industry | F500 HQs | Revenue |
|---|---|---|
| Technology | 3 | $17B |
|
||
| Insurance | 2 | $84B |
|
||
| Retail | 2 | $76B |
|
||
| Life Sciences | 1 | $43B |
|
||
| Energy Technology | 1 | $31B |
|
||
| Aerospace / Defense | 1 | $18B |
|
||
Price history
+232.2% since first listed13 events — show timeline
- 2026-05-17 Price Changed $299,000 MLS PIN
- 2026-04-02 Listed $315,000 MLS PIN
- 2016-11-30 Sold (MLS) $200,000 MLS PIN
- 2016-10-07 Pending — MLS PIN
- 2016-10-05 Listed $179,000 MLS PIN
- 2010-01-07 Sold (MLS) $52,000 MLS PIN
- 2009-12-02 Contingent — MLS PIN
- 2009-11-24 Relisted — MLS PIN
- 2009-11-23 Price Changed $44,900 MLS PIN
- 2009-11-04 Contingent — MLS PIN
- 2009-10-20 Listed $47,900 MLS PIN
- 1992-12-09 Sold (Public Records) $31,000 Public Records
- 1987-07-14 Sold (Public Records) $90,000 Public Records
Property tax history
+5.8%/yrLatest (2023): $3,230 · -4.1% YoY. Source: county tax records.
Cash-flow waterfall
monthlySold comps — $/sqft
last 12 mo · ≤1 miLoading sold comps…