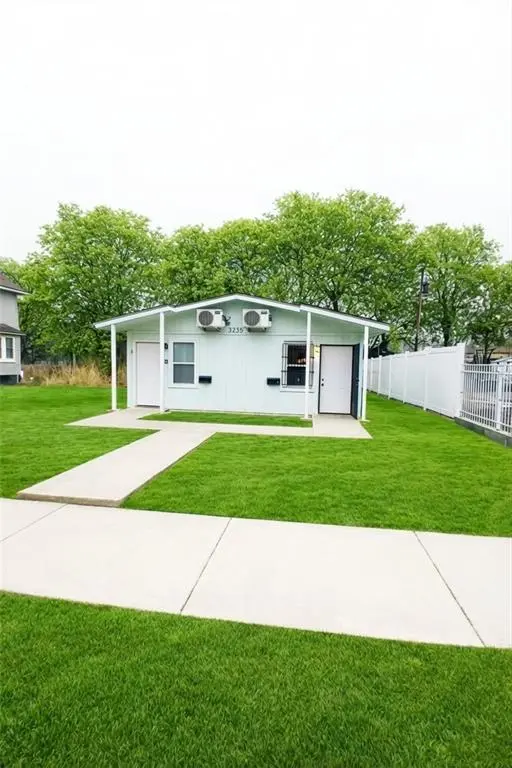
3235 College Ave · Kansas City, MO
Flood risk 1/10 · Minimal
- FEMA flood zone
- X (unshaded)
- Chance of flooding over 30 yrs
- 0.0%
- Est. flood insurance / yr
- $507 – $1,088
Fire risk 1/10 · Minimal
- Est. fire insurance / yr
- $1,054 – $1,958
Heat risk 4/10 · Minor
- Hot days now (above 107°F)
- 7 days/yr
- Hot days in 30 yrs
- 17 days/yr
Wind risk 2/10 · Minimal
- Chance of severe wind over 30 yrs
- —
Air-quality risk 3/10 · Minor
- Unhealthy air days now
- 2 days/yr
- Unhealthy air days in 30 yrs
- 3 days/yr
Risk factors via First Street. Map © Google.
Why this score? — see what drove the D grade
The composite is a weighted blend of 9 inputs, each scored 0–100. Each bar is that input's sub-score; the figure is the points it added to the 100-point composite (weight × sub-score).
- ARV discount +15.0/15.0
- Appreciation +10.0/10.0
- Cash flow +6.3/30.0
- Livability +3.9/5.0
- Rent growth +3.7/5.0
- Condition / age +2.5/5.0
- 1% rule +1.5/10.0
- Schools +1.5/10.0
- DSCR +0.6/10.0
$184,950
🖨 Deal sheet (PDF) 📄 Offer letter ✓ Due diligence
Listing remarks MLS
Brand new construction duplex (2024) offering two modern units with separate entrances and systems. Designed for low-maintenance ownership and long-term rental income. Unit mix: 1 bed / 1 bath each. Projected market rent: $1,080 per unit. Estimated total monthly income: $2,160. New roof, HVAC, electrical, plumbing, and modern interior finishes throughout. Separate meters Ideal turnkey investment opportunity with no capital expenditure required. Suitable for investor or house-hack buyer seeking new construction with strong rental appeal. Property is currently occupied with rental income from day 1. Seller is offering a portfolio of 7 properties for sale. The portfolio offers a 9.6% cap rate and 18% COCR, producing approximately $37,000 in annual income after debt service. A T12 for the portfolio is attached to this listing. No owner financing. No creative financing. No wholesalers or assignable contracts. End buyers only
Key facts
- 5,096 sq ft lot
- Built 2024
- Listed 164 days
Neighborhood map
What this means for you Summary
Snapshot
- This is a 2-bed/2.0-bath land listed at $185k.
Deal economics
- At list price, monthly cash flow is $-332 ($-4k/yr) — negative.
- To cash-flow at today's rent, offer at most $137k (26.0% below list).
- To meet the 1% rule (rent ≥ 1% of price), the offer needs to be $120k (35.3% below list).
- Recommended offer: $120k (35.3% below list) — sets the bar for 1% rule.
Location & tenants
- Location reads 78/100 on livability (#28 in MO, #2,671 nationally) — a middle-class / working-renter tenant base. Strengths: amenities A+, commute A+, cost of living A+; Watch: crime F.
- Kansas City 33 (urban): math 12% / reading 24% proficiency, ranked #308 of 324 in MO (top 95%) — low school quality limits family demand, transient renter base, plan for 1-2y turnover; 75% free/reduced lunch — lower-income household profile, screen leases tightly.
- Zoned schools: M. L. King Elementary (math 2% / reading 8%, grade F, #1,072 of 1,115 statewide, top 98%, 665 students, 100% FRL); Central Middle School (math 0% / reading 9%, grade F, #388 of 391 statewide, top 99%, 428 students, 99% FRL); Central High School (math 2% / reading 17%, grade F, #507 of 521 statewide, top 98%, 535 students, 99% FRL) — zoned schools average 99% FRL vs 75% district-wide (24 pts higher); higher-poverty schools than district average — tighter screening recommended.
- Market conditions: Rents rising fast (+4.7%/yr); 87 active listings in the ZIP; 40 comparable units currently listed for rent nearby; rentals at typical pace (median 26d on market — plan ~3-4 weeks tenant-placement turnaround); lower-income renter base — watch delinquency; 4,002 units permitted in Jackson County in 2024 (2,271 in 5+ unit buildings).
- This rent runs 40% of the median local income ($36k/yr) — at the standard rent-burdened threshold; future hikes will face affordability resistance.
Forward outlook
- In year one you build about $20k of equity ($1k loan paydown + $18k appreciation (10.0% local appreciation)).
- Jackson County population projected at +4% by 2050 — modest demand growth; plan on rents tracking national, not racing it.
- By year 2, paydown + projected appreciation supports a ~$32k cash-out refi (75% LTV) — recoverable capital for the next deal without selling this one.
Negotiation context
- It's been on market 164 days — a 12% lower offer ($163k) is reasonable based on typical stale-listing flexibility.
- 2 sale attempts; this cycle's ask has dropped $15k (8%) from the opening price — seller is motivated, your offer sets the floor, not the list.
- Current owner paid $356; list at $185k implies a 51852% gain — meaningful room to come down on a strong offer.
Questions for the listing agent
- What do current leases actually rent for vs. the listed asking? Can we see a recent rent roll and the last 12 months of T-12 income?
- It's been on market 164 days. Have you received any prior offers? Is the seller open to a 35% concession, seller financing, or rate buy-down credit?
- Why hasn't it sold? Are there any deal-killer items the seller is aware of (foundation, flood, title, zoning, code violations)?
- Is there a deadline driving the sale (1031 exchange, divorce, estate, relocation)? That informs how much negotiation room exists.
- Crime grade is F in this area — have there been break-ins, vandalism, or insurance claims at this property in the last 3 years? What carrier currently insures it and at what premium?
- The area grade is low — what's the realistic commute time and amenity access for the typical tenant pool here? Any planned neighborhood developments (good or bad) we should know about?
- What's the average days-on-market for RENTAL listings here right now (not sales)? A rising rental-DOM trend means longer vacancies and softer asking-rent achievability than the comps imply.
- What's the recent tenant-quality profile in this submarket — average credit score on applications, eviction rate, late-payment / NSF rate, and stable-employment percentage? A property-management company in the area should have these aggregated.
- How much new for-sale + rental construction is in the pipeline within 1–3 miles? Heavy new supply typically softens prices + rents 12–24 months out; constrained supply supports both.
Investment metrics
- 1% rule
- 0.65% ✗
- Cap rate
- 4.14%
- Cash-on-cash
- -7.70%
- DSCR
- 0.66
- GRM
- 12.9
CMA / ARV
- ARV (median comp)
- $291,230
- List price
- $184,950
- Delta
- -36.49%
- Verdict
- UNDERPRICED
- Comps
- 8 within 1.0 mi
Projected returns pro-forma
10.0% appreciation · 4.65% rent growth · sell at horizon
- IRR
- 19.3%
- Equity multiple
- 2.58×
- Total profit
- $81,615
- Equity at exit
- $166,618
- IRR
- 18.1%
- Equity multiple
- 6.05×
- Total profit
- $261,399
- Equity at exit
- $359,317
Cash invested: $51,786 (down + closing). Projections, not guarantees.
Landlord ↔ Tenant lean methodology
- Overall (STATE)
- 81 Strongly Landlord-Friendly
- State Missouri
- 81 Strongly Landlord-Friendly · R+10
- County
- — inherits STATE
- City
- — inherits STATE
ZIP-level market 64128
- Home prices YoY
- 21.6%
- Rents YoY
- 4.7%
- Active inventory
- 87
- Price-to-rent
- 12.9×
Monthly cashflow live
- Estimated rent
- $1,198 high interval (Pro) →
- Mortgage (P&I)
- −$970
- Tax est. 1.5%
- −$231 /mo · $2,774/yr
- Insurance
- −$77
- HOA
- −$0
- Vacancy / Maint / Mgmt
- −$251
- Net cashflow
- $-332
Break-even live
Sensitivity live
| Price | -10% $-204 | -5% $-268 | +0% $-332 | +5% $-396 | +10% $-460 |
|---|---|---|---|---|---|
| Rent | -10% $-427 | -5% $-379 | +0% $-332 | +5% $-285 | +10% $-238 |
| Rate | -1.0pp $-239 | -0.5pp $-285 | base $-332 | +0.5pp $-380 | +1.0pp $-429 |
UW: 25.0% down · 7.5% · 30yr · 1.5% tax · 5.0% vac · 8.0% maint · 8.0% mgmt
Financing live
Cash to close
- Down payment
- $46,238
- Closing costs
- $5,548
- Reserves months
- —
- Total cash needed
- —
Loan-product check · same deal, 3 products live
Conventional
25% down · 7.5% · 30yr
- Down + closing
- —
- Monthly P&I
- —
- Monthly cashflow
- —
- DSCR
- —
- Eligible?
- —
Personal DTI + credit; lowest rate.
DSCR
20% down · 8.5% · 30yr
- Down + closing
- —
- Monthly P&I
- —
- Monthly cashflow
- —
- DSCR
- —
- Eligible?
- —
No personal income docs; deal must DSCR.
Hard money
10% down · 12.0% · 12mo
- Down + closing
- —
- Monthly P&I
- —
- Monthly cashflow
- —
- DSCR
- —
- Eligible?
- —
Short-term bridge; refi at stabilization.
Rent comps 40 comps
| Address | Beds | Baths | Sqft | Rent | $/sqft | DOM | Units | Dist |
|---|---|---|---|---|---|---|---|---|
| 3310 College Ave Kansas City, MO | 3.0 | 1.0 | 874 | $995 | $1.14 | 45d | 1 | 0.04mi |
| 3335 Indiana Ave Unit B Kansas City, MO | 3.0 | 1.0 | — | $1,025 | — | 25d | 1 | 0.11mi |
| 3409 Indiana Ave Unit 3 Kansas City, MO | 2.0 | 1.0 | — | $1,099 | — | 25d | 1 | 0.17mi |
| 3310 Askew Ave Kansas City, MO | 3.0 | 2.0 | 1484 | $1,500 | $1.01 | 0d | 1 | 0.17mi |
| 3304 Agnes Ave Unit Downstairs Kansas City, MO | 3.0 | 1.0 | 1150 | $1,095 | $0.95 | 45d | 1 | 0.20mi |
| 3305 Askew Ave Kansas City, MO | 3.0 | 1.5 | 1428 | $1,450 | $1.02 | 25d | 1 | 0.20mi |
| 3330 Agnes Ave Kansas City, MO | 3.0 | 1.0 | 1000 | $1,410 | $1.41 | 45d | 1 | 0.22mi |
| 3346 Agnes Ave Kansas City, MO | 3.0 | 1.0 | 1400 | $1,200 | $0.86 | 9d | 1 | 0.23mi |
| 3514 Bellefontaine Ave Kansas City, MO | 3.0 | 1.0 | — | $1,350 | — | 25d | 1 | 0.32mi |
| 3012 College Ave Kansas City, MO | 1.0 | 1.0 | — | $750 | — | 25d | 1 | 0.33mi |
| 3524 Bellefontaine Ave Kansas City, MO | 3.0 | 1.0 | 1228 | $1,350 | $1.10 | 45d | 1 | 0.35mi |
| 3434 Chestnut Ave Kansas City, MO | 2.0 | 1.0 | 1512 | $1,100 | $0.73 | 12d | 1 | 0.39mi |
| 3220 E 30th St Unit 1A Kansas City, MO | 2.0 | 1.0 | 1214 | $950 | $0.78 | 45d | 1 | 0.39mi |
| 3525 Monroe Ave Kansas City, MO | 3.0 | 2.0 | 1569 | $1,500 | $0.96 | 45d | 1 | 0.41mi |
| 3015 Montgall Ave Unit 1 Kansas City, MO | 1.0 | 1.0 | — | $695 | — | 25d | 1 | 0.48mi |
| 3332 Norton Ave Kansas City, MO | 3.0 | 1.0 | 1272 | $1,350 | $1.06 | 45d | 1 | 0.49mi |
| 3630 Agnes Ave Kansas City, MO | 3.0 | 2.0 | 1448 | $1,500 | $1.04 | 12d | 1 | 0.51mi |
| 2908 E 29th St Kansas City, MO | 2.0 | 1.5 | — | $1,000 | — | 25d | 1 | 0.51mi |
| 3811 E 36th St Kansas City, MO | 3.0 | 1.0 | 2590 | $1,350 | $0.52 | 45d | 1 | 0.52mi |
| 2637 E 29th St Unit 3 Kansas City, MO | 2.0 | 1.0 | 954 | $1,050 | $1.10 | 45d | 1 | 0.55mi |
| 2929 Mersington Ave Kansas City, MO | 3.0 | 1.5 | — | $1,195 | — | 14d | 1 | 0.55mi |
| 3816 E 37th St Kansas City, MO | 3.0 | 1.0 | — | $1,402 | — | 14d | 1 | 0.60mi |
| 3233 Park Ave Unit 1 Kansas City, MO | 2.0 | 1.0 | 950 | $1,075 | $1.13 | 45d | 1 | 0.60mi |
| 3233 Park Ave Unit 2 Kansas City, MO | 2.0 | 1.0 | 950 | $1,000 | $1.05 | 25d | 1 | 0.60mi |
| 3320 Spruce Ave Kansas City, MO | 2.0 | 1.0 | — | $1,095 | — | 45d | 1 | 0.60mi |
| 3434 Olive St Kansas City, MO | 3.0 | 2.0 | 2020 | $1,445 | $0.72 | 45d | 1 | 0.61mi |
| 3437 Jackson Ave Kansas City, MO | 2.0 | 1.0 | 700 | $1,150 | $1.64 | 18d | 1 | 0.61mi |
| 3739 Bales Ave Kansas City, MO | 3.0 | 2.0 | 1400 | $1,575 | $1.12 | 25d | 1 | 0.62mi |
| 2846 Myrtle Ave Kansas City, MO | 3.0 | 2.0 | 1705 | $1,350 | $0.79 | 18d | 1 | 0.65mi |
| 3818 Indiana Ave Kansas City, MO | 3.0 | 1.5 | 1223 | $1,147 | $0.94 | 45d | 1 | 0.68mi |
| 3547 Jackson Ave Kansas City, MO | 3.0 | 1.0 | 1104 | $1,255 | $1.14 | 0d | 1 | 0.68mi |
| 3820 Indiana Ave Kansas City, MO | 3.0 | 1.0 | — | $1,000 | — | 0d | 1 | 0.68mi |
| 3417 Brooklyn Ave Kansas City, MO | 3.0 | 1.5 | 945 | $1,595 | $1.69 | 0d | 1 | 0.69mi |
| 3710 Wabash Ave Unit 2S Kansas City, MO | 2.0 | 1.0 | 875 | $850 | $0.97 | 25d | 1 | 0.70mi |
| 2120 Linwood Blvd Kansas City, MO | 3.0 | 1.0 | 1326 | $1,400 | $1.06 | 45d | 1 | 0.72mi |
| 3604 Park Ave Kansas City, MO | 3.0 | 1.5 | 1320 | $1,550 | $1.17 | 0d | 1 | 0.74mi |
| 3840 Bellefontaine Ave Kansas City, MO | 3.0 | 1.0 | 1500 | $1,500 | $1.00 | 18d | 1 | 0.74mi |
| 2404 E 29th St Apt 2W Kansas City, MO | 2.0 | 1.0 | 850 | $900 | $1.06 | 0d | 1 | 0.74mi |
| 2701 Benton Blvd Unit 2703-2 Kansas City, MO | 2.0 | 1.0 | 800 | $1,200 | $1.50 | 4d | 1 | 0.77mi |
| 2701 Benton Blvd Unit 2705-3 Kansas City, MO | 2.0 | 1.0 | 800 | $1,200 | $1.50 | 9d | 1 | 0.77mi |
Listing history 21 events
-
2026-06-21days on market $184,950 Active 164 DOM
-
2026-06-18days on market $184,950 Active 161 DOM
-
2026-06-17days on market $184,950 Active 160 DOM
-
2026-06-16days on market $184,950 Active 159 DOM
-
2026-06-15days on market $184,950 Active 158 DOM
-
2026-06-13days on market $184,950 Active 156 DOM
-
2026-06-09days on market $184,950 Active 152 DOM
-
2026-06-08days on market $184,950 Active 151 DOM
-
2026-06-07days on market $184,950 Active 150 DOM
-
2026-06-05days on market $184,950 Active 147 DOM
-
2026-06-03days on market $184,950 Active 146 DOM
-
2026-06-02days on market $184,950 Active 145 DOM
-
2026-06-01days on market $184,950 Active 144 DOM
-
2026-05-31days on market $184,950 Active 143 DOM
-
2026-05-12status Active 938-char remark
Show marketing remark (938 chars)
Brand new construction duplex (2024) offering two modern units with separate entrances and systems. Designed for low-maintenance ownership and long-term rental income. Unit mix: 1 bed / 1 bath each. Projected market rent: $1,080 per unit. Estimated total monthly income: $2,160. New roof, HVAC, electrical, plumbing, and modern interior finishes throughout. Separate meters Ideal turnkey investment opportunity with no capital expenditure required. Suitable for investor or house-hack buyer seeking new construction with strong rental appeal. Property is currently occupied with rental income from day 1. Seller is offering a portfolio of 7 properties for sale. The portfolio offers a 9.6% cap rate and 18% COCR, producing approximately $37,000 in annual income after debt service. A T12 for the portfolio is attached to this listing. No owner financing. No creative financing. No wholesalers or assignable contracts. End buyers only
-
2026-04-15historical Active Under Contract 938-char remark
Show marketing remark (938 chars)
Brand new construction duplex (2024) offering two modern units with separate entrances and systems. Designed for low-maintenance ownership and long-term rental income. Unit mix: 1 bed / 1 bath each. Projected market rent: $1,080 per unit. Estimated total monthly income: $2,160. New roof, HVAC, electrical, plumbing, and modern interior finishes throughout. Separate meters Ideal turnkey investment opportunity with no capital expenditure required. Suitable for investor or house-hack buyer seeking new construction with strong rental appeal. Property is currently occupied with rental income from day 1. Seller is offering a portfolio of 7 properties for sale. The portfolio offers a 9.6% cap rate and 18% COCR, producing approximately $37,000 in annual income after debt service. A T12 for the portfolio is attached to this listing. No owner financing. No creative financing. No wholesalers or assignable contracts. End buyers only
-
2026-02-26price $184,950 938-char remark
Show marketing remark (938 chars)
Brand new construction duplex (2024) offering two modern units with separate entrances and systems. Designed for low-maintenance ownership and long-term rental income. Unit mix: 1 bed / 1 bath each. Projected market rent: $1,080 per unit. Estimated total monthly income: $2,160. New roof, HVAC, electrical, plumbing, and modern interior finishes throughout. Separate meters Ideal turnkey investment opportunity with no capital expenditure required. Suitable for investor or house-hack buyer seeking new construction with strong rental appeal. Property is currently occupied with rental income from day 1. Seller is offering a portfolio of 7 properties for sale. The portfolio offers a 9.6% cap rate and 18% COCR, producing approximately $37,000 in annual income after debt service. A T12 for the portfolio is attached to this listing. No owner financing. No creative financing. No wholesalers or assignable contracts. End buyers only
-
2026-02-23price $198,950 938-char remark
Show marketing remark (938 chars)
Brand new construction duplex (2024) offering two modern units with separate entrances and systems. Designed for low-maintenance ownership and long-term rental income. Unit mix: 1 bed / 1 bath each. Projected market rent: $1,080 per unit. Estimated total monthly income: $2,160. New roof, HVAC, electrical, plumbing, and modern interior finishes throughout. Separate meters Ideal turnkey investment opportunity with no capital expenditure required. Suitable for investor or house-hack buyer seeking new construction with strong rental appeal. Property is currently occupied with rental income from day 1. Seller is offering a portfolio of 7 properties for sale. The portfolio offers a 9.6% cap rate and 18% COCR, producing approximately $37,000 in annual income after debt service. A T12 for the portfolio is attached to this listing. No owner financing. No creative financing. No wholesalers or assignable contracts. End buyers only
-
2026-01-08$199,950 Active 938-char remark
Show marketing remark (938 chars)
Brand new construction duplex (2024) offering two modern units with separate entrances and systems. Designed for low-maintenance ownership and long-term rental income. Unit mix: 1 bed / 1 bath each. Projected market rent: $1,080 per unit. Estimated total monthly income: $2,160. New roof, HVAC, electrical, plumbing, and modern interior finishes throughout. Separate meters Ideal turnkey investment opportunity with no capital expenditure required. Suitable for investor or house-hack buyer seeking new construction with strong rental appeal. Property is currently occupied with rental income from day 1. Seller is offering a portfolio of 7 properties for sale. The portfolio offers a 9.6% cap rate and 18% COCR, producing approximately $37,000 in annual income after debt service. A T12 for the portfolio is attached to this listing. No owner financing. No creative financing. No wholesalers or assignable contracts. End buyers only
-
2011-01-26soldstatus $356
-
1983-09-01soldstatus
ⓘ Source: listings_history table (triggers on properties + properties_extension) + one-shot
backfill from property_details.listing_events for pre-trigger history.
Climate risk First Street
- Flood 1/10 Low FEMA zone X (unshaded) · 0% chance over 30 yrs
- Wildfire 1/10 Low
- Heat 4/10 Moderate 7 d/yr ≥107°F today · 17 d/yr by 30 yrs out
- Wind 2/10 Low
- Air quality 3/10 Moderate 2 unhealthy d/yr today · 3 by 30 yrs out
Nearby sold comps map
Loading sold comps map…
Walkable amenities ~0.75 mi
Loading nearby amenities…
Taxation est. · year 1
- Rental income
- $14,370
- − Mortgage interest
- −$10,360
- − Property taxes
- −$2,774
- − Insurance
- −$925
- − Repairs & maintenance
- −$1,150
- − Management
- −$1,150
- − Depreciation
- −$5,380
- Taxable loss
- −$7,368
- Est. tax savings @ 24.0%
- +$1,768
- After-tax cash flow
- $-2,217/yr
For passive investors: Depreciation is non-cash, so a rental often shows a tax loss while cash-flowing — sheltering income. Rental losses are passive: they offset passive income freely, and up to $25,000/yr can offset ordinary (W-2) income if you actively participate and your MAGI is under $100k (phasing out to $0 by $150k); unused losses carry forward. On sale, claimed depreciation is recaptured at up to 25%, and gains may owe capital-gains tax (a 1031 exchange can defer both). Figures are a year-1 estimate at your 24.0% rate — not tax advice; consult a CPA.
Schools (NCES district)
- District
- Kansas City 33
- NCES district ID
- 2916400
- Math proficiency
- 12% ▼ -8.00%
- Reading proficiency
- 24% ▬ 0.00%
- Median HH income
- $35,227
- Composite
- 14.8/100
- National rank
- #9387
- State rank
- #308 of 324 in MO
Livability — Kansas City
- Score
- 78/100
- State rank
- #28
- US rank
- #2671
Category grades
Schools grade is shown separately in the Schools card above.
Census & demographics
- Census place
- Kansas City, MO
- County
- Jackson County · 687,798 people
- City population
- 439,467
- Metro
- Kansas City, MO-KS
- Population (ZIP)
- 11,912
- Household income
- $36,088
- Rent vs Own
- Severe rent burden
- 946.0
Population outlook (Jackson County) Hauer SSP2
- Today (2025)
- 719,589 people
- By 2030
- 731,456 · +1.6%
- By 2040
- 746,689 · +3.8%
- By 2050
- 749,289 · +4.1%
- By 2075
- 736,227 · +2.3%
- By 2100
- 668,210 · -7.1%
Race, ethnicity, and origin ACS 2023
- Neighborhood character
- Predominantly Black (79%)
- Race & ethnicity
- Black 79% Hispanic / Latino 9% White 8% Two or more races 7%
- Hispanic origin (detail)
- Mexican 6%
- Common ancestry
- Swedish 1% Hispanic 1%
- Foreign-born
- 7% · Canada
- Languages at home
- 88% English-only · Spanish 7% French/Haitian/Cajun 2%
Political lean MEDSL · Jackson
- 2024 margin
- D (+19.3) · D 58.9% · R 39.5% · Other 1.6%
- 2008→2024 swing
- -6.1pp toward R · 2008: 25.4pp · 2024: 19.3pp
- All cycles
- 2024: D+19.3 2020: D+22.0 2016: D+16.6 2012: D+19.0 2008: D+25.4
Not yet ingested
- Civics
- —
Market trends
- HPI YoY
- ▲ 73.41%
- Current HPI
- 412.6862
- Rent YoY
- ▲ 4.65%
- Metro
- Kansas City, MO-KS
- State GDP YoY
- ▲ 1.84%
- F500 in state
- 20
Industry mix (Fortune 500 HQ in MO)
| Industry | F500 HQs | Revenue |
|---|---|---|
| Healthcare | 1 | $163B |
|
||
| Insurance | 1 | $21B |
|
||
| Industrial Technology | 1 | $17B |
|
||
| Retail | 1 | $16B |
|
||
| Industrial Distribution | 1 | $10B |
|
||
| Utilities | 1 | $9B |
|
||
Price history
-7.5% since first listed7 events — show timeline
- 2026-05-12 Relisted — Heartland MLS as Distributed by MLS Grid
- 2026-04-15 Contingent — Heartland MLS as Distributed by MLS Grid
- 2026-02-26 Price Changed $184,950 Heartland MLS as Distributed by MLS Grid
- 2026-02-23 Price Changed $198,950 Heartland MLS as Distributed by MLS Grid
- 2026-01-08 Listed $199,950 Heartland MLS as Distributed by MLS Grid
- 2011-01-26 Sold (Public Records) $356 Public Records
- 1983-09-01 Sold (Public Records) — Public Records
Property tax history
+6.0%/yrLatest (2025): $63 · +6.0% YoY. Source: county tax records.
Cash-flow waterfall
monthlySold comps — $/sqft
last 12 mo · ≤1 miLoading sold comps…