2526 N 17th St · Waco, TX
Flood risk 1/10 · Minimal
- FEMA flood zone
- X (unshaded)
- Chance of flooding over 30 yrs
- 0.0%
- Est. flood insurance / yr
- $507 – $1,088
Fire risk 3/10 · Minor
- Est. fire insurance / yr
- $1,222 – $2,270
Heat risk 7/10 · Major
- Hot days now (above 109°F)
- 7 days/yr
- Hot days in 30 yrs
- 24 days/yr
Wind risk 6/10 · Moderate
- Chance of severe wind over 30 yrs
- 56.0%
Air-quality risk 2/10 · Minimal
- Unhealthy air days now
- 0 days/yr
- Unhealthy air days in 30 yrs
- 1 days/yr
Risk factors via First Street. Map © Google.
Why this score? — see what drove the B+ grade
The composite is a weighted blend of 9 inputs, each scored 0–100. Each bar is that input's sub-score; the figure is the points it added to the 100-point composite (weight × sub-score).
- Cash flow +30.0/30.0
- ARV discount +15.0/15.0
- 1% rule +10.0/10.0
- DSCR +10.0/10.0
- Livability +3.7/5.0
- Condition / age +2.5/5.0
- Rent growth +2.3/5.0
- Schools +1.8/10.0
- Appreciation +0.0/10.0
$75,000
🖨 Deal sheet 📄 Offer letter ✓ Due diligence
Listing remarks MLS
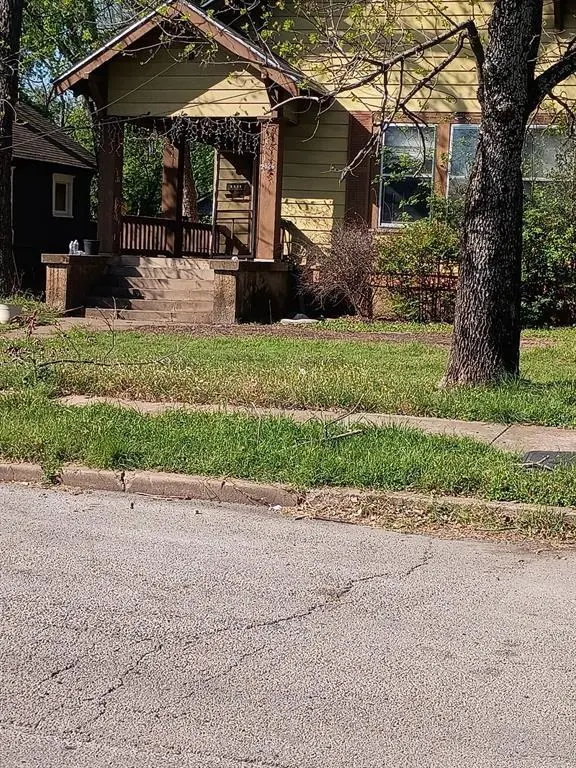
3 bd, 1 bath fixer upper in North Waco. Priced below tax appraisal. To enter house, pick up key from Charles Spivey Real Estate office, 4117 Roselawn (next to UHaul on Valley Mills Dr).
Key facts
- 9,075 sq ft lot
- Built 1920
- Listed 67 days
Neighborhood map
What this means for you Summary
Snapshot
- This is a 2-bed/1.0-bath single-family listed at $75k.
Deal economics
- At list price, monthly cash flow is $521 ($6k/yr) — positive.
- The deal already cash-flows at list — no discount required.
- Meets the 1% rule at list price ($1k rent vs $75k).
- Recommended offer: $70k (6.0% below list) — sets the bar for market timing.
- Cap rate 14.6% vs local median 3.9% in Waco — top-decile yield for the area; either an underpriced asset or a hidden risk that comps aren't pricing in. Stress-test before assuming the spread holds.
Location & tenants
- Location reads 74/100 on livability (#166 in TX, #4,378 nationally) — a middle-class / working-renter tenant base. Strengths: cost of living A+, housing A+, health & safety A+; Watch: schools D, crime D, commute F.
- Waco ISD (urban): math 20% / reading 24% proficiency, ranked #773 of 826 in TX (top 94%) — low school quality limits family demand, transient renter base, plan for 1-2y turnover; 81% free/reduced lunch — lower-income household profile, screen leases tightly.
- Market conditions: Rents soft (-0.8%/yr); 376 active listings in the ZIP; 40 comparable units currently listed for rent nearby; rentals at typical pace (median 21d on market — plan ~3-4 weeks tenant-placement turnaround); 1,014 units permitted in McLennan County in 2024 (200 in 5+ unit buildings).
Forward outlook
- Local home prices are declining (-3.0%/yr); year-one equity from $519 of loan paydown is wiped out by about $2k of value loss. Plan a longer hold.
- McLennan County population projected at +17% by 2050 — long-run rental-demand tailwind backs the buy-and-hold thesis.
- At projected returns (-3.0% appreciation + 0.0% rent growth), your $21k cash investment doubles in ~5 years — after that, you're playing with house money.
Negotiation context
- It's been on market 67 days — a 6% lower offer ($70k) is reasonable based on typical stale-listing flexibility.
- 2 sale attempts with the ask held roughly flat each time — persistent listings suggest the price (not the market) is what's stuck; bring a comps-based counter.
Risks & watch-outs
- Watch-outs: property tax is 2.9% of price; built in 1920 — expect roof / HVAC / electrical / plumbing capex.
- Climate carrying-cost: major wind risk, 56% chance of damaging wind over 30y; extreme-heat days projected 7→24/yr by 2055 (HVAC capex compounding) — expect insurance premiums to compound above CPI over the hold.
Questions for the listing agent
- It's been on market 67 days. Have you received any prior offers? Is the seller open to a 6% concession, seller financing, or rate buy-down credit?
- Built in 1920 — when were the roof, HVAC, electrical panel, plumbing, and water heater last replaced?
- Property tax is high relative to price — has the assessment been appealed recently, and will the sale trigger a re-assessment?
- Why hasn't it sold? Are there any deal-killer items the seller is aware of (foundation, flood, title, zoning, code violations)?
- Is there a deadline driving the sale (1031 exchange, divorce, estate, relocation)? That informs how much negotiation room exists.
- Schools are D-rated, which usually means shorter tenancies and higher turnover. Who's the typical renter profile here, and what's been the actual vacancy rate?
- Crime grade is D in this area — have there been break-ins, vandalism, or insurance claims at this property in the last 3 years? What carrier currently insures it and at what premium?
- What's the average days-on-market for RENTAL listings here right now (not sales)? A rising rental-DOM trend means longer vacancies and softer asking-rent achievability than the comps imply.
- What's the recent tenant-quality profile in this submarket — average credit score on applications, eviction rate, late-payment / NSF rate, and stable-employment percentage? A property-management company in the area should have these aggregated.
- How much new for-sale + rental construction is in the pipeline within 1–3 miles? Heavy new supply typically softens prices + rents 12–24 months out; constrained supply supports both.
Investment metrics
- 1% rule
- 1.90% ✓
- Cap rate
- 14.62%
- Cash-on-cash
- 29.75%
- DSCR
- 2.32
- GRM
- 4.4
CMA / ARV
- ARV (median comp)
- $136,746
- List price
- $75,000
- Delta
- -45.15%
- Verdict
- UNDERPRICED
- Comps
- 20 within 1.0 mi
Show comp detail 12 sales within ~0.75 mi
| Address | Dist | Beds/Ba | Sqft | Sold | Price | $/sf | Match |
|---|---|---|---|---|---|---|---|
| 1711 Reuter Ave | 0.26mi | 2/2.0 | 1,280 (-4%) | 6mo | $199,800 | $156 | 73 |
| 1630 Mckenzie Ave | 0.16mi | 2/1.0 | 1,180 (-11%) | 2mo | $119,000 | $101 | 73 |
| 1714 Reuter Ave | 0.24mi | 3/2.0 (+1) | 1,362 (+3%) | 4mo | $230,000 | $169 | 73 |
| 2111 Herring Ave | 0.36mi | 3/1.5 (+1) | 1,419 (+7%) | 10mo | $100,000 | $70 | 56 |
| 528 Sedwick Ave | 0.70mi | 2/2.0 | 1,352 (+2%) | 11mo | $219,900 | $163 | 51 |
| 1606 Bryan Ave | 0.48mi | 3/2.0 (+1) | 1,177 (-11%) | 6mo | $209,900 | $178 | 45 |
| 2005 Avondale St | 0.73mi | 3/1.5 (+1) | 1,280 (-4%) | 11mo | $144,900 | $113 | 44 |
| 1641 N 17th St | 0.73mi | 2/1.0 | 1,209 (-9%) | 11mo | $163,000 | $135 | 42 |
| 2416 Mcferrin Ave | 0.70mi | 3/2.0 (+1) | 1,420 (+7%) | 9mo | $210,000 | $148 | 39 |
| 1632 N 17th St | 0.74mi | 3/2.0 (+1) | 1,374 (+4%) | 13mo | $240,000 | $175 | 39 |
| 1541 Clark Ave | 0.69mi | 3/2.0 (+1) | 1,176 (-11%) | 8mo | $175,000 | $149 | 34 |
| 2509 Alexander Ave | 0.65mi | 3/2.0 (+1) | 1,505 (+14%) | 12mo | $269,000 | $179 | 28 |
Match score weights: distance 35% · size 25% · config 20% · recency 20%. Top-matched comps best support the ARV.
Projected returns pro-forma
-3.0% appreciation · 0.0% rent growth · sell at horizon
- IRR
- 20.6%
- Equity multiple
- 1.81×
- Total profit
- $16,909
- Equity at exit
- $11,183
- IRR
- 26.5%
- Equity multiple
- 2.98×
- Total profit
- $41,597
- Equity at exit
- $6,485
Cash invested: $21,000 (down + closing). Projections, not guarantees.
Landlord ↔ Tenant lean methodology
- Overall (STATE)
- 87 Strongly Landlord-Friendly
- State Texas
- 87 Strongly Landlord-Friendly · R+5
- County
- — inherits STATE
- City
- — inherits STATE
ZIP-level market 76708
- Home prices YoY
- -26.5%
- Rents YoY
- -0.8%
- Active inventory
- 376
- Price-to-rent
- 4.4×
Monthly cashflow live
- Estimated rent
- $1,424 high interval (Pro) →
- Mortgage (P&I)
- −$393
- Tax from tax record
- −$180 /mo · $2,158/yr
- Insurance
- −$31
- HOA
- −$0
- Vacancy / Maint / Mgmt
- −$299
- Net cashflow
- $521
Break-even live
UW: 25.0% down · 7.5% · 30yr · 1.5% tax · 5.0% vac · 8.0% maint · 8.0% mgmt
Financing live
Cash to close
- Down payment
- $18,750
- Closing costs
- $2,250
- Reserves months
- —
- Total cash needed
- —
Loan-product check · same deal, 3 products live
Conventional
25% down · 7.5% · 30yr
- Down + closing
- —
- Monthly P&I
- —
- Monthly cashflow
- —
- DSCR
- —
- Eligible?
- —
Personal DTI + credit; lowest rate.
DSCR
20% down · 8.5% · 30yr
- Down + closing
- —
- Monthly P&I
- —
- Monthly cashflow
- —
- DSCR
- —
- Eligible?
- —
No personal income docs; deal must DSCR.
Hard money
10% down · 12.0% · 12mo
- Down + closing
- —
- Monthly P&I
- —
- Monthly cashflow
- —
- DSCR
- —
- Eligible?
- —
Short-term bridge; refi at stabilization.
Rent comps 40 comps
| Address | Beds | Baths | Sqft | Rent | $/sqft | DOM | Units | Dist |
|---|---|---|---|---|---|---|---|---|
| 1621 Alexander Ave Unit A Waco, TX | 3.0 | 2.0 | 1400 | $1,695 | $1.21 | 21d | 1 | 0.12mi |
| 1920 Lyle Ave Waco, TX | 2.0 | 1.0 | 1519 | $1,200 | $0.79 | 21d | 1 | 0.21mi |
| 1920 Lyle Ave Waco, TX | 2.0 | 1.0 | 1519 | $1,200 | $0.79 | 43d | 1 | 0.21mi |
| 2121 Lyle Ave Waco, TX | 2.0 | 1.0 | 1080 | $1,000 | $0.93 | 13d | 1 | 0.36mi |
| 1920 Windsor Ave Waco, TX | 3.0 | 1.0 | 1216 | $1,200 | $0.99 | 43d | 1 | 0.51mi |
| 1825 Cumberland Ave Waco, TX | 3.0 | 1.0 | 1400 | $1,325 | $0.95 | 13d | 1 | 0.53mi |
| 2401 McKenzie Ave Waco, TX | 3.0 | 1.5 | 1288 | $1,300 | $1.01 | 21d | 1 | 0.57mi |
| 2402 Proctor Ave Waco, TX | 1.0 | 1.0 | 1000 | $950 | $0.95 | 13d | 1 | 0.59mi |
| 1511 Maple Ave Waco, TX | 3.0 | 2.0 | 1487 | $1,450 | $0.98 | 43d | 1 | 0.61mi |
| 2504 Lyle Ave Waco, TX | 3.0 | 2.0 | 1028 | $1,475 | $1.43 | 21d | 1 | 0.63mi |
| 2505 Proctor Ave Waco, TX | 3.0 | 2.0 | 1588 | $1,550 | $0.98 | 21d | 1 | 0.66mi |
| 2601 Herring Ave Unit 1 Waco, TX | 3.0 | 1.0 | 989 | $1,295 | $1.31 | 43d | 1 | 0.70mi |
| 2600 McKenzie Ave Waco, TX | 3.0 | 1.0 | 1096 | $1,395 | $1.27 | 21d | 1 | 0.71mi |
| 3400 Adeline Dr Waco, TX | 2.0 | 1.0 | 1232 | $1,150 | $0.93 | 43d | 1 | 0.73mi |
| 2704 Herring Ave Waco, TX | 2.0 | 2.0 | 1286 | $1,750 | $1.36 | 21d | 1 | 0.78mi |
| 2712 Mitchell Ave Waco, TX | 3.0 | 1.0 | 1120 | $1,300 | $1.16 | 21d | 1 | 0.78mi |
| 1815 Seneca Ave Waco, TX | 3.0 | 2.0 | 1471 | $1,650 | $1.12 | 21d | 1 | 0.79mi |
| 2712 Lyle Ave Waco, TX | 3.0 | 1.0 | 1100 | $1,500 | $1.36 | 43d | 1 | 0.79mi |
| 2712 Lyle Ave Waco, TX | 3.0 | 1.0 | 1100 | $1,500 | $1.36 | 21d | 1 | 0.79mi |
| 2717 Alexander Ave Waco, TX | 2.0 | 2.0 | 1200 | $2,000 | $1.67 | 21d | 1 | 0.80mi |
| 2621 Windsor Ave Waco, TX | 2.0 | 1.0 | 1108 | $1,175 | $1.06 | 21d | 1 | 0.83mi |
| 1821 Algonquin St Waco, TX | 2.0 | 1.0 | 930 | $1,150 | $1.24 | 43d | 1 | 0.86mi |
| 2805 Mitchell Ave Waco, TX | 2.0 | 1.0 | 1024 | $1,145 | $1.12 | 13d | 1 | 0.87mi |
| 2714 Windsor Ave Waco, TX | 2.0 | 1.0 | 979 | $1,300 | $1.33 | 43d | 1 | 0.92mi |
| 1600 N 11th St Unit A Waco, TX | 3.0 | 2.0 | 1217 | $1,750 | $1.44 | 43d | 1 | 0.93mi |
| 2511 Parrott Ave Waco, TX | 3.0 | 2.0 | 1463 | $1,695 | $1.16 | 43d | 1 | 1.04mi |
| 1901 N 28th St Waco, TX | 3.0 | 2.0 | 1794 | $1,950 | $1.09 | 21d | 1 | 1.06mi |
| 2612 Alice Ave Waco, TX | 2.0 | 1.0 | 964 | $1,250 | $1.30 | 21d | 1 | 1.15mi |
| 2001 Bosque Blvd Waco, TX | 3.0 | 1.0 | 1628 | $1,100 | $0.68 | 43d | 1 | 1.18mi |
| 1906 Bosque Blvd Unit 1 Waco, TX | 1.0 | 1.0 | 880 | $875 | $0.99 | 21d | 1 | 1.20mi |
| 1110 N 11th St Waco, TX | 3.0 | 2.0 | 1172 | $1,495 | $1.28 | 21d | 1 | 1.21mi |
| 1104 N 11th St Waco, TX | 3.0 | 2.0 | 1231 | $1,650 | $1.34 | 21d | 1 | 1.22mi |
| 1000 N 19th St Waco, TX | 3.0 | 1.5 | 1800 | $2,050 | $1.14 | 21d | 1 | 1.25mi |
| 930 N 11th St Waco, TX | 1.0 | 1.0 | 924 | $690 | $0.75 | 21d | 1 | 1.27mi |
| 3007 Parrott Ave Unit 1 Waco, TX | 3.0 | 2.0 | 1458 | $1,650 | $1.13 | 21d | 1 | 1.28mi |
| 2100 N 33rd St Waco, TX | 3.0 | 3.0 | 1858 | $2,200 | $1.18 | 43d | 1 | 1.31mi |
| 804 N 11th St Waco, TX | 1.0–2.0 | 1.0 | 838 | $1,200 | $1.43 | 21d | 1 | 1.37mi |
| 3310 MacArthur Dr Waco, TX | 3.0 | 2.0 | 1586 | $2,000 | $1.26 | 13d | 1 | 1.39mi |
| 2705 Bosque Blvd Waco, TX | 3.0 | 2.0 | 1028 | $1,599 | $1.56 | 43d | 1 | 1.39mi |
| 2724 Bosque Blvd Waco, TX | 2.0 | 1.0 | 1120 | $1,100 | $0.98 | 21d | 1 | 1.44mi |
Listing history 19 events
-
2026-06-18days on market $75,000 Active 67 DOM
-
2026-06-17days on market $75,000 Active 66 DOM
-
2026-06-16days on market $75,000 Active 65 DOM
-
2026-06-15days on market $75,000 Active 64 DOM
-
2026-06-14days on market $75,000 Active 62 DOM
-
2026-06-13days on market $75,000 Active 61 DOM
-
2026-06-10days on market $75,000 Active 59 DOM
-
2026-06-09days on market $75,000 Active 58 DOM
-
2026-06-08days on market $75,000 Active 57 DOM
-
2026-06-07days on market $75,000 Active 56 DOM
-
2026-06-05days on market $75,000 Active 53 DOM
-
2026-06-03days on market $75,000 Active 52 DOM
-
2026-06-02days on market $75,000 Active 51 DOM
-
2026-06-01days on market $75,000 Active 50 DOM
-
2026-05-31days on market $75,000 Active 49 DOM
-
2026-05-30days on market $75,000 Active 48 DOM
-
2026-04-14status Active 186-char remark
Show marketing remark (186 chars)
3 bd, 1 bath fixer upper in North Waco. Priced below tax appraisal. To enter house, pick up key from Charles Spivey Real Estate office, 4117 Roselawn (next to UHaul on Valley Mills Dr).
-
2026-04-08status Pending 186-char remark
Show marketing remark (186 chars)
3 bd, 1 bath fixer upper in North Waco. Priced below tax appraisal. To enter house, pick up key from Charles Spivey Real Estate office, 4117 Roselawn (next to UHaul on Valley Mills Dr).
-
2026-04-03$75,000 Active 186-char remark
Show marketing remark (186 chars)
3 bd, 1 bath fixer upper in North Waco. Priced below tax appraisal. To enter house, pick up key from Charles Spivey Real Estate office, 4117 Roselawn (next to UHaul on Valley Mills Dr).
ⓘ Source: listings_history table (triggers on properties + properties_extension) + one-shot
backfill from property_details.listing_events for pre-trigger history.
Tax reassessment forecast TX · Resets to sale price
- Current annual tax
- $2,158 · $180/mo
- Projected year-2 tax
- $2,158 · $180/mo
- Expected delta
- $0/yr ($0/mo · 0.0%)
ⓘ Screening estimate from a state-policy table — verify with the county assessor before closing.
Climate risk First Street
- Flood 1/10 Low FEMA zone X (unshaded) · 0% chance over 30 yrs
- Wildfire 3/10 Moderate
- Heat 7/10 Severe 7 d/yr ≥109°F today · 24 d/yr by 30 yrs out
- Wind 6/10 Major 56% chance of damaging wind over 30 yrs
- Air quality 2/10 Low 0 unhealthy d/yr today · 1 by 30 yrs out
Nearby sold comps map
Loading sold comps map…
Walkable amenities ~0.75 mi
Loading nearby amenities…
Taxation est. · year 1
- Rental income
- $17,090
- − Mortgage interest
- −$4,201
- − Property taxes
- −$2,158
- − Insurance
- −$375
- − Repairs & maintenance
- −$1,367
- − Management
- −$1,367
- − Depreciation
- −$2,182
- Taxable income
- $5,439
- Est. tax owed @ 24.0%
- −$1,305
- After-tax cash flow
- $4,943/yr
For passive investors: Depreciation is non-cash, so a rental often shows a tax loss while cash-flowing — sheltering income. Rental losses are passive: they offset passive income freely, and up to $25,000/yr can offset ordinary (W-2) income if you actively participate and your MAGI is under $100k (phasing out to $0 by $150k); unused losses carry forward. On sale, claimed depreciation is recaptured at up to 25%, and gains may owe capital-gains tax (a 1031 exchange can defer both). Figures are a year-1 estimate at your 24.0% rate — not tax advice; consult a CPA.
Schools (NCES district)
- District
- Waco ISD
- NCES district ID
- 4844280
- Math proficiency
- 20% ▼ -14.00%
- Reading proficiency
- 24% ▼ -6.00%
- Median HH income
- $29,208
- Composite
- 17.57/100
- National rank
- #9043
- State rank
- #773 of 826 in TX
Livability — Waco
- Score
- 74/100
- State rank
- #166
- US rank
- #4378
Category grades
Schools grade is shown separately in the Schools card above.
Census & demographics
- Census place
- Waco, TX
- County
- McLennan County · 213,088 people
- City population
- 125,319
- Metro
- Waco, TX
- Population (ZIP)
- 27,790
- Household income
- $68,856
- Rent vs Own
- Severe rent burden
- 583.0
Population outlook (McLennan County) Hauer SSP2
- Today (2025)
- 264,191 people
- By 2030
- 273,578 · +3.6%
- By 2040
- 291,506 · +10.3%
- By 2050
- 308,044 · +16.6%
- By 2075
- 349,648 · +32.3%
- By 2100
- 364,779 · +38.1%
Race, ethnicity, and origin ACS 2023
- Neighborhood character
- Diverse neighborhood (Simpson 0.63)
- Race & ethnicity
- White 50% Hispanic / Latino 31% Two or more races 20% Black 13% Asian 2%
- Hispanic origin (detail)
- Mexican 28%
- Common ancestry
- Slovak 2% Lithuanian 1% Italian 1%
- Foreign-born
- 11% · Canada, Vietnam
- Languages at home
- 76% English-only · Spanish 21% Other Asian/Pacific 1%
Political lean MEDSL · McLennan
- 2024 margin
- Solid R (+30.9) · D 34.0% · R 64.9% · Other 1.0%
- 2008→2024 swing
- -7.0pp toward R · 2008: -23.9pp · 2024: -30.9pp
- All cycles
- 2024: R+30.9 2020: R+23.4 2016: R+27.1 2012: R+29.8 2008: R+23.9
Not yet ingested
- Civics
- —
Market trends
- HPI YoY
- ▼ -78.80%
- Current HPI
- 218.9643
- Rent YoY
- ▼ -0.80%
- Metro
- Waco, TX
- State GDP YoY
- ▲ 3.95%
- F500 in state
- 110
Industry mix (Fortune 500 HQ in TX)
| Industry | F500 HQs | Revenue |
|---|---|---|
| Energy | 16 | $1,198B |
|
||
| Technology | 5 | $198B |
|
||
| Engineering / Construction | 4 | $72B |
|
||
| Energy Services | 3 | $60B |
|
||
| Utilities | 3 | $41B |
|
||
| Healthcare | 2 | $330B |
|
||
Price history
3 events — show timeline
- 2026-04-14 Relisted — NTREIS
- 2026-04-08 Pending — NTREIS
- 2026-04-03 Listed $75,000 NTREIS
Property tax history
+8.0%/yrLatest (2025): $2,158 · +0.7% YoY. Source: county tax records.
Cash-flow waterfall
monthlySold comps — $/sqft
last 12 mo · ≤1 miLoading sold comps…