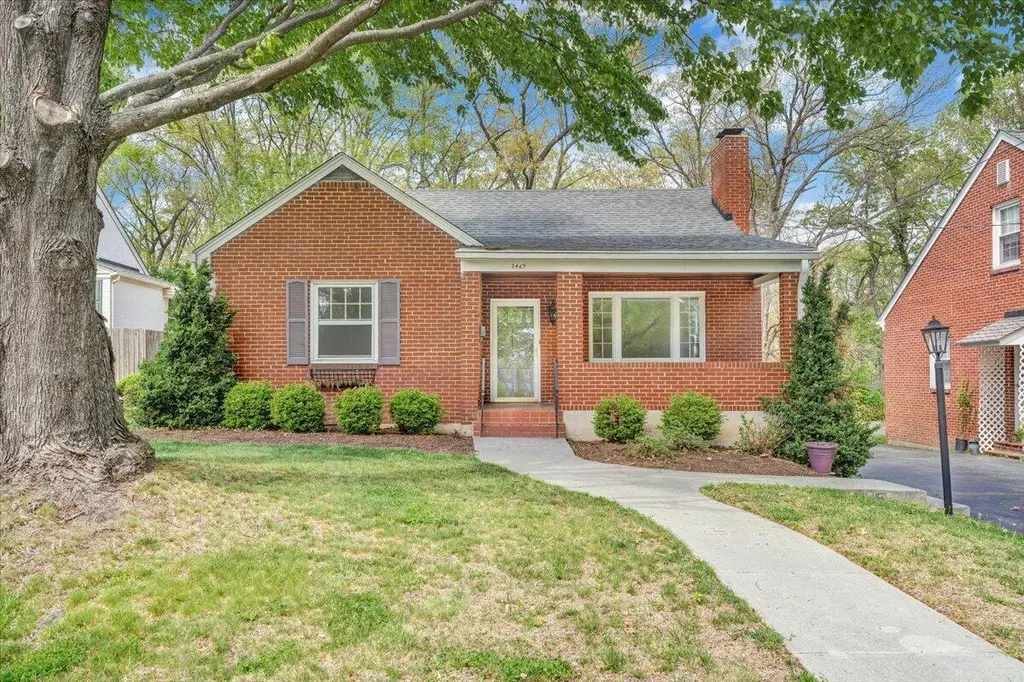
2469 Tillett Rd SW · Roanoke, VA
Flood risk 1/10 · Minimal
- FEMA flood zone
- X (unshaded)
- Chance of flooding over 30 yrs
- 0.0%
- Est. flood insurance / yr
- $473 – $860
Fire risk 1/10 · Minimal
- Est. fire insurance / yr
- $666 – $1,236
Heat risk 5/10 · Moderate
- Hot days now (above 100°F)
- 7 days/yr
- Hot days in 30 yrs
- 18 days/yr
Wind risk 2/10 · Minimal
- Chance of severe wind over 30 yrs
- 1.0%
Air-quality risk 1/10 · Minimal
- Unhealthy air days now
- 0 days/yr
- Unhealthy air days in 30 yrs
- 0 days/yr
Risk factors via First Street. Map © Google.
Why this score? — see what drove the F grade
The composite is a weighted blend of 9 inputs, each scored 0–100. Each bar is that input's sub-score; the figure is the points it added to the 100-point composite (weight × sub-score).
- ARV discount +6.5/15.0
- Cash flow +5.1/30.0
- Rent growth +4.1/5.0
- Schools +4.1/10.0
- Livability +3.7/5.0
- Condition / age +2.5/5.0
- 1% rule +0.5/10.0
- DSCR +0.0/10.0
- Appreciation +0.0/10.0
$262,500
🖨 Deal sheet 📄 Offer letter ✓ Due diligence
Listing remarks
She's the kind of lady who turns heads without trying--dignified and timeless, yet unpretentious. For over 30 years, she's been cherished by the same devoted caretaker. Her freshly painted walls and kitchen cabinets offer a tasteful facelift, while maintaining her classic mid-century charm. Off the newly constructed deck, she extends a large, flat yard perfect for romping pups, backyard football games or entertaining. Her rooms may be empty, but her heart is ready to embrace whoever chooses to call her home. Generous sidewalks for strolling, excellent schools and nearby beloved Grandin Village top her list of bragging rights. A full list of updates and features can be found on the documents
Key facts
- Generous sidewalks
- Excellent schools
- Large flat yard
Tags
Neighborhood map
What this means for you Summary
Snapshot
- This is a 3-bed/2.0-bath single-family listed at $262k.
Deal economics
- At list price, monthly cash flow is $-611 ($-7k/yr) — negative.
- To cash-flow at today's rent, offer at most $154k (41.1% below list).
- To meet the 1% rule (rent ≥ 1% of price), the offer needs to be $145k (44.8% below list).
- Recommended offer: $145k (44.8% below list) — sets the bar for 1% rule.
Location & tenants
- Location reads 73/100 on livability (#163 in VA) — a middle-class / working-renter tenant base. Strengths: cost of living A+, health & safety A+, housing A; Watch: amenities C-, employment D, crime F.
- Roanoke City Public School District (urban): math 40% / reading 58% proficiency, ranked #102 of 131 in VA (top 78%) — families likely to look elsewhere, expect single-tenant / working-renter base with shorter leases; 67% free/reduced lunch — lower-income household profile, screen leases tightly.
- Zoned schools: Grandin Court Elementary (math 87% / reading 87%, grade A+, #37 of 1,108 statewide, top 4%, 370 students, 100% FRL); Woodrow Wilson Middle (math 38% / reading 63%, grade C, #226 of 342 statewide, top 67%, 642 students, 99% FRL); Patrick Henry High (math 57% / reading 77%, grade B, #185 of 319 statewide, top 61%, 2,005 students, 95% FRL) — zoned schools average 98% FRL vs 67% district-wide (31 pts higher); higher-poverty schools than district average — tighter screening recommended.
- Zoned-school proficiency averages 68% at this address vs 49% district-wide (+19 pts) — the actual schools serving this property are materially stronger than the Roanoke City Public School District average implies; a family-tenant draw the district grade alone would hide.
- Market conditions: Rents rising fast (+6.4%/yr); 120 active listings in the ZIP; 29 comparable units currently listed for rent nearby; rentals lingering (median 44d on market — plan ~5-8 weeks vacancy on turnover, expect pricing pressure); 52% of comp listings sitting > 30 days — soft ceiling on asking rent; 113 units permitted in Roanoke city in 2024 (0 in 5+ unit buildings).
Forward outlook
- Local home prices are declining (-3.0%/yr); year-one equity from $2k of loan paydown is wiped out by about $8k of value loss. Plan a longer hold.
- Roanoke County population projected at +11% by 2050 — modest demand growth; plan on rents tracking national, not racing it.
Negotiation context
- Only 1 days on market — expect competitive offers; lowballing is unlikely to land.
- Current owner paid $82k; list at $262k implies a 218% gain — meaningful room to come down on a strong offer.
Risks & watch-outs
- Watch-outs: built in 1953 — expect roof / HVAC / electrical / plumbing capex.
- Climate carrying-cost: extreme-heat days projected 7→18/yr by 2055 (HVAC capex compounding) — expect insurance premiums to compound above CPI over the hold.
Questions for the listing agent
- What do current leases actually rent for vs. the listed asking? Can we see a recent rent roll and the last 12 months of T-12 income?
- Built in 1953 — when were the roof, HVAC, electrical panel, plumbing, and water heater last replaced?
- Is there a deadline driving the sale (1031 exchange, divorce, estate, relocation)? That informs how much negotiation room exists.
- Schools are A-rated — typically a magnet for longer-tenancy family renters. What's the average tenant stay here, and is there a school-zone premium baked into asking?
- Crime grade is F in this area — have there been break-ins, vandalism, or insurance claims at this property in the last 3 years? What carrier currently insures it and at what premium?
- The area grade is low — what's the realistic commute time and amenity access for the typical tenant pool here? Any planned neighborhood developments (good or bad) we should know about?
- What's the average days-on-market for RENTAL listings here right now (not sales)? A rising rental-DOM trend means longer vacancies and softer asking-rent achievability than the comps imply.
- What's the recent tenant-quality profile in this submarket — average credit score on applications, eviction rate, late-payment / NSF rate, and stable-employment percentage? A property-management company in the area should have these aggregated.
- How much new for-sale + rental construction is in the pipeline within 1–3 miles? Heavy new supply typically softens prices + rents 12–24 months out; constrained supply supports both.
Investment metrics
- 1% rule
- 0.55% ✗
- Cap rate
- 3.50%
- Cash-on-cash
- -9.98%
- DSCR
- 0.56
- GRM
- 15.1
CMA / ARV
- ARV (on-the-fly)
- $256,620
- Comps found
- 12
Show comp detail 12 sales within ~0.75 mi
| Address | Dist | Beds/Ba | Sqft | Sold | Price | $/sf | Match |
|---|---|---|---|---|---|---|---|
| 2370 Idavere Rd SW | 0.18mi | 3/1.0 | 1,237 (+1%) | 17mo | $240,000 | $194 | 71 |
| 2606 Grandin Rd SW | 0.13mi | 3/2.0 | 1,330 (+9%) | 14mo | $279,900 | $210 | 68 |
| 2643 Lansing Dr SW | 0.38mi | 3/1.0 | 1,193 (-2%) | 13mo | $165,000 | $138 | 64 |
| 2612 Weaver Rd SW | 0.14mi | 3/1.0 | 1,125 (-8%) | 15mo | $221,500 | $197 | 64 |
| 2603 Fairway Dr SW | 0.40mi | 3/1.0 | 1,287 (+5%) | 9mo | $250,000 | $194 | 61 |
| 2325 Brandon Ave SW | 0.57mi | 3/1.5 | 1,234 (+1%) | 14mo | $265,000 | $215 | 58 |
| 1932 Carlton Rd SW | 0.59mi | 3/2.0 | 1,134 (-7%) | 8mo | $250,000 | $220 | 54 |
| 3014 Fleetwood Ave SW | 0.73mi | 2/1.0 (-1) | 1,191 (-2%) | 1mo | $237,000 | $199 | 52 |
| 2523 Brambleton Ave SW | 0.56mi | 2/1.0 (-1) | 1,337 (+9%) | 8mo | $270,000 | $202 | 42 |
| 2780 Derwent Dr SW | 0.70mi | 3/1.0 | 1,055 (-14%) | 4mo | $249,000 | $236 | 38 |
| 2927 Hollowell Ave SW | 0.74mi | 3/2.0 | 1,062 (-13%) | 14mo | $270,950 | $255 | 32 |
| 1735 Devon Rd SW | 0.72mi | 3/1.0 | 1,105 (-10%) | 19mo | $235,000 | $213 | 30 |
Match score weights: distance 35% · size 25% · config 20% · recency 20%. Top-matched comps best support the ARV.
Projected returns pro-forma
-3.0% appreciation · 6.39% rent growth · sell at horizon
- IRR
- -30.8%
- Equity multiple
- -0.04×
- Total profit
- $-76,382
- Equity at exit
- $39,140
- IRR
- -22.2%
- Equity multiple
- -0.28×
- Total profit
- $-94,238
- Equity at exit
- $22,696
Cash invested: $73,500 (down + closing). Projections, not guarantees.
Landlord ↔ Tenant lean methodology
- Overall (STATE)
- 55 Moderately Landlord-Leaning
- State Virginia
- 55 Moderately Landlord-Leaning · D+2
- County
- — inherits STATE
- City
- — inherits STATE
ZIP-level market 24015
- Rents YoY
- 6.4%
- Active inventory
- 120
- Price-to-rent
- 15.1×
Monthly cashflow live
- Estimated rent
- $1,448 high interval (Pro) →
- Mortgage (P&I)
- −$1,377
- Tax from tax record
- −$269 /mo · $3,233/yr
- Insurance
- −$109
- HOA
- −$0
- Vacancy / Maint / Mgmt
- −$304
- Net cashflow
- $-611
Break-even live
UW: 25.0% down · 7.5% · 30yr · 1.5% tax · 5.0% vac · 8.0% maint · 8.0% mgmt
Financing live
Cash to close
- Down payment
- $65,625
- Closing costs
- $7,875
- Reserves months
- —
- Total cash needed
- —
Loan-product check · same deal, 3 products live
Conventional
25% down · 7.5% · 30yr
- Down + closing
- —
- Monthly P&I
- —
- Monthly cashflow
- —
- DSCR
- —
- Eligible?
- —
Personal DTI + credit; lowest rate.
DSCR
20% down · 8.5% · 30yr
- Down + closing
- —
- Monthly P&I
- —
- Monthly cashflow
- —
- DSCR
- —
- Eligible?
- —
No personal income docs; deal must DSCR.
Hard money
10% down · 12.0% · 12mo
- Down + closing
- —
- Monthly P&I
- —
- Monthly cashflow
- —
- DSCR
- —
- Eligible?
- —
Short-term bridge; refi at stabilization.
Rent comps 29 comps
| Address | Beds | Baths | Sqft | Rent | $/sqft | DOM | Units | Dist |
|---|---|---|---|---|---|---|---|---|
| 2679 Beverly Blvd SW Roanoke, VA | 3.0 | 1.0 | 1000 | $1,623 | $1.62 | 13d | 1 | 0.40mi |
| 2615 Laburnum Ave SW Roanoke, VA | 2.0 | 1.5 | 1323 | $1,825 | $1.38 | 21d | 1 | 0.51mi |
| 2615 Laburnum Ave SW Roanoke, VA | 2.0 | 1.5 | 1323 | $1,800 | $1.36 | 43d | 1 | 0.51mi |
| 2432 Brandon Ave SW Roanoke, VA | 2.0 | 1.0 | 1015 | $1,275 | $1.26 | 43d | 1 | 0.53mi |
| 1924 Arden Rd SW Roanoke, VA | 2.0 | 1.0 | 1008 | $1,550 | $1.54 | 43d | 1 | 0.63mi |
| 1732 Grandin Rd SW Roanoke, VA | 2.0 | 1.0 | 814 | $980 | $1.20 | 21d | 1 | 0.93mi |
| 1732 Grandin Rd SW Unit 57 Roanoke, VA | 2.0 | 1.0 | 814 | $1,045 | $1.28 | 43d | 1 | 0.93mi |
| 1732 Grandin Rd SW Apt 55 Roanoke, VA | 2.0 | 1.0 | 814 | $995 | $1.22 | 43d | 1 | 0.93mi |
| 1716 Grandin Rd SW Unit 7 Roanoke, VA | 2.0 | 1.0 | 1000 | $1,025 | $1.02 | 43d | 1 | 0.94mi |
| 2601 Westover Ave SW Roanoke, VA | 2.0 | 1.0 | 828 | $940 | $1.14 | 44d | 1 | 1.00mi |
| 2627 Westover Ave SW Roanoke, VA | 2.0 | 1.0 | 828 | $1,015 | $1.23 | 44d | 1 | 1.01mi |
| 2633 Westover Ave SW Roanoke, VA | 2.0 | 1.0 | 828 | $1,045 | $1.26 | 13d | 1 | 1.02mi |
| 2633 Westover Ave SW Unit 1 Roanoke, VA | 2.0 | 1.0 | 828 | $1,045 | $1.26 | 21d | 1 | 1.02mi |
| 1301 Burks St SW Unit 204 Roanoke, VA | 2.0 | 1.0 | 794 | $890 | $1.12 | 43d | 1 | 1.04mi |
| 2325 Memorial Avenue SW Roanoke, VA | 1.0–2.0 | 1.0 | 925 | $1,225 | $1.32 | 13d | 3 | 1.05mi |
| 2325 Memorial Ave SW Unit 6 Roanoke, VA | 2.0 | 1.0 | 1050 | $1,125 | $1.07 | 21d | 1 | 1.05mi |
| 2216 Memorial Ave SW Unit 2218 Roanoke, VA | 2.0 | 1.0 | 1000 | $1,200 | $1.20 | 43d | 1 | 1.05mi |
| 1709 Sherwood Ave SW Roanoke, VA | 2.0 | 1.0 | 1271 | $1,650 | $1.30 | 43d | 1 | 1.06mi |
| 2307 Memorial Ave SW Roanoke, VA | 2.0 | 1.5 | 1100 | $1,035 | $0.94 | 13d | 1 | 1.06mi |
| 1520 Sherwood Ave SW Roanoke, VA | 2.0 | 1.0 | 900 | $1,500 | $1.67 | 13d | 1 | 1.10mi |
| 3363 View Ave Roanoke, VA | 3.0 | 1.0 | 1014 | $1,895 | $1.87 | 21d | 1 | 1.12mi |
| 2210 Berkley Ave SW Roanoke, VA | 2.0 | 1.0 | 700 | $995 | $1.42 | 43d | 1 | 1.20mi |
| 2251 Mountain View Ter SW Roanoke, VA | 2.0 | 1.0 | 830 | $988 | $1.19 | 43d | 1 | 1.32mi |
| 4356 Old Garst Ml Rd Cave Spring, VA | 1.0–2.0 | 1.0–1.5 | 889 | $1,341 | $1.51 | 13d | 14 | 1.33mi |
| 3464 Colonial Ave Roanoke, VA | 2.0 | 1.0 | 1100 | $1,495 | $1.36 | 13d | 5 | 1.33mi |
| 1701 Westover Ave SW Roanoke, VA | 1.0–2.0 | 1.0 | 876 | $1,045 | $1.19 | 43d | 4 | 1.35mi |
| 3807 Brandon Ave SW Roanoke, VA | 3.0 | 2.0 | 1200 | $1,600 | $1.33 | 13d | 2 | 1.37mi |
| 3345 Circle Brook Dr Cave Spring, VA | 1.0–3.0 | 1.0–2.0 | 997 | $1,920 | $1.92 | 13d | 11 | 1.38mi |
| 1813 Oxford Ave SW Roanoke, VA | 2.0 | 1.0 | 800 | $1,200 | $1.50 | 43d | 1 | 1.47mi |
Listing history 4 events
-
2026-04-17status Pending
-
2026-04-16$262,500 Active
-
1994-08-12soldstatus $82,500
-
1988-12-21soldstatus $66,000
ⓘ Source: listings_history table (triggers on properties + properties_extension) + one-shot
backfill from property_details.listing_events for pre-trigger history.
Tax reassessment forecast VA · Resets to sale price
- Current annual tax
- $3,233 · $269/mo
- Projected year-2 tax
- $3,233 · $269/mo
- Expected delta
- $0/yr ($0/mo · 0.0%)
ⓘ Screening estimate from a state-policy table — verify with the county assessor before closing.
Climate risk First Street
- Flood 1/10 Low FEMA zone X (unshaded) · 0% chance over 30 yrs
- Wildfire 1/10 Low
- Heat 5/10 Major 7 d/yr ≥100°F today · 18 d/yr by 30 yrs out
- Wind 2/10 Low 100% chance of damaging wind over 30 yrs
- Air quality 1/10 Low 0 unhealthy d/yr today · 0 by 30 yrs out
Nearby sold comps map
Loading sold comps map…
Walkable amenities ~0.75 mi
Loading nearby amenities…
Taxation est. · year 1
- Rental income
- $17,377
- − Mortgage interest
- −$14,704
- − Property taxes
- −$3,233
- − Insurance
- −$1,312
- − Repairs & maintenance
- −$1,390
- − Management
- −$1,390
- − Depreciation
- −$7,636
- Taxable loss
- −$12,289
- Est. tax savings @ 24.0%
- +$2,949
- After-tax cash flow
- $-4,387/yr
For passive investors: Depreciation is non-cash, so a rental often shows a tax loss while cash-flowing — sheltering income. Rental losses are passive: they offset passive income freely, and up to $25,000/yr can offset ordinary (W-2) income if you actively participate and your MAGI is under $100k (phasing out to $0 by $150k); unused losses carry forward. On sale, claimed depreciation is recaptured at up to 25%, and gains may owe capital-gains tax (a 1031 exchange can defer both). Figures are a year-1 estimate at your 24.0% rate — not tax advice; consult a CPA.
Schools (NCES district)
- District
- Roanoke City Public School District
- NCES district ID
- 5103300
- Math proficiency
- 40% ▼ -38.00%
- Reading proficiency
- 58% ▼ -12.00%
- Median HH income
- $38,592
- Composite
- 40.8/100
- National rank
- #3639
- State rank
- #102 of 131 in VA
Livability — Roanoke
- Score
- 73/100
- State rank
- #163
- US rank
- #5055
Category grades
Schools grade is shown separately in the Schools card above.
Census & demographics
- Census place
- Roanoke, VA
- County
- Roanoke City · 101,625 people
- City population
- 168,930
- Metro
- Roanoke, VA
- Population (ZIP)
- 15,865
- Household income
- $69,831
- Rent vs Own
- Severe rent burden
- 525.0
Population outlook (Roanoke County) Hauer SSP2
- Today (2025)
- 106,094 people
- By 2030
- 108,927 · +2.7%
- By 2040
- 114,104 · +7.5%
- By 2050
- 118,032 · +11.3%
- By 2075
- 123,363 · +16.3%
- By 2100
- 116,827 · +10.1%
Race, ethnicity, and origin ACS 2023
- Neighborhood character
- Predominantly White (83%)
- Race & ethnicity
- White 83% Two or more races 7% Black 5% Hispanic / Latino 5% Asian 2%
- Common ancestry
- Italian 5% Slovak 3% Serbian 2%
- Foreign-born
- 4% · Canada, Jamaica
- Languages at home
- 95% English-only · Spanish 2% Tagalog/Filipino 1% Other Indo-European 1%
Political lean MEDSL · Roanoke
- 2024 margin
- Strong D (+23.6) · D 61.1% · R 37.5% · Other 1.4%
- 2008→2024 swing
- +0.2pp no change · 2008: 23.4pp · 2024: 23.6pp
- All cycles
- 2024: D+23.6 2020: D+25.8 2016: D+17.6 2012: D+21.5 2008: D+23.4
Not yet ingested
- Civics
- —
Market trends
- HPI YoY
- ▼ -333.83%
- Current HPI
- 192.3108
- Rent YoY
- ▲ 6.39%
- Metro
- Roanoke, VA
- State GDP YoY
- ▲ 2.40%
- F500 in state
- 50
Industry mix (Fortune 500 HQ in VA)
| Industry | F500 HQs | Revenue |
|---|---|---|
| Aerospace / Defense | 4 | $236B |
|
||
| Technology / Defense | 3 | $32B |
|
||
| Financial Services | 2 | $176B |
|
||
| Utilities | 2 | $27B |
|
||
| Insurance | 2 | $25B |
|
||
| Technology | 2 | $15B |
|
||
Price history
+297.7% since first listed4 events — show timeline
- 2026-04-17 Pending — MLSRV
- 2026-04-16 Listed $262,500 MLSRV
- 1994-08-12 Sold (Public Records) $82,500 Public Records
- 1988-12-21 Sold (Public Records) $66,000 Public Records
Property tax history
+5.9%/yrLatest (2025): $3,233 · +16.4% YoY. Source: county tax records.
Cash-flow waterfall
monthlySold comps — $/sqft
last 12 mo · ≤1 miLoading sold comps…