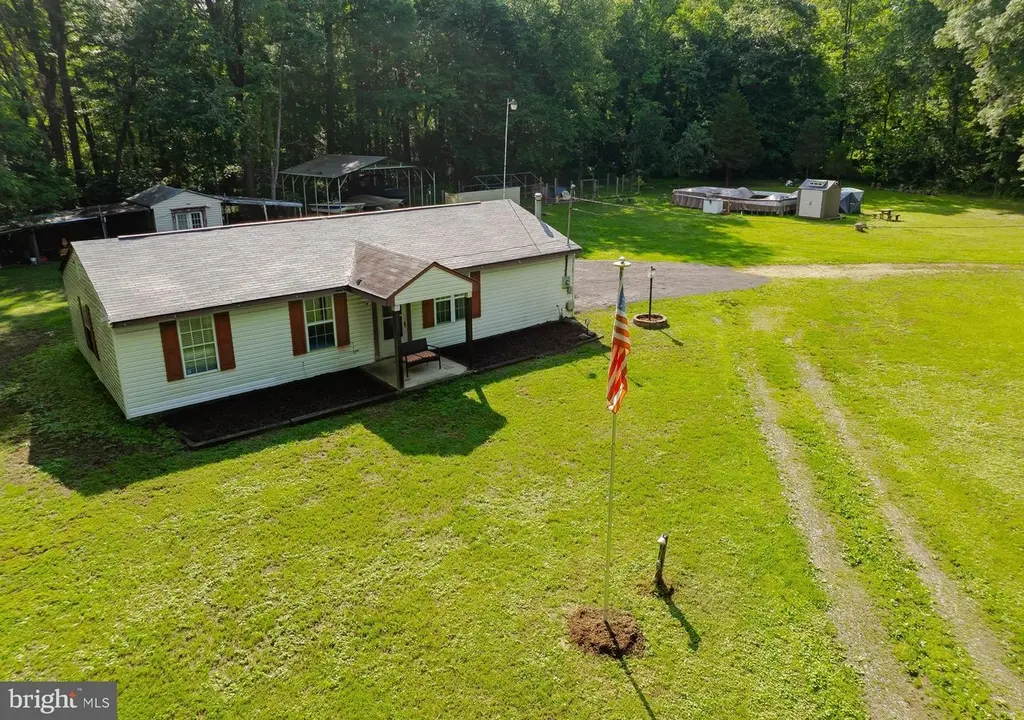
6345 Hoover Ln · Bryans Road, MD
Flood risk 1/10 · Minimal
- FEMA flood zone
- X (unshaded)
- Chance of flooding over 30 yrs
- 0.0%
- Est. flood insurance / yr
- $507 – $1,088
Fire risk 4/10 · Minor
- Est. fire insurance / yr
- $755 – $1,403
Heat risk 7/10 · Major
- Hot days now (above 103°F)
- 7 days/yr
- Hot days in 30 yrs
- 16 days/yr
Wind risk 4/10 · Minor
- Chance of severe wind over 30 yrs
- 17.0%
Air-quality risk 2/10 · Minimal
- Unhealthy air days now
- 1 days/yr
- Unhealthy air days in 30 yrs
- 2 days/yr
Risk factors via First Street. Map © Google.
Why this score? — see what drove the D grade
The composite is a weighted blend of 9 inputs, each scored 0–100. Each bar is that input's sub-score; the figure is the points it added to the 100-point composite (weight × sub-score).
- Cash flow +14.3/30.0
- ARV discount +10.3/15.0
- DSCR +4.4/10.0
- 1% rule +3.5/10.0
- Livability +3.1/5.0
- Rent growth +2.5/5.0
- Condition / age +2.5/5.0
- Schools +2.3/10.0
- Appreciation +0.0/10.0
$304,999
🖨 Deal sheet 📄 Offer letter ✓ Due diligence
Listing remarks MLS
This home is located in a great area to slow down and enjoy nature. Plenty of property to accommodate the outdoor lover. National Park just 1 mile away as well as nearby shopping. Living room has a cozy wood burning stove and home is equipped with a generator. Private yard backing to trees! Great value, don't miss out!
Key facts
- 1.2 acre lot
- 8 parking spots
- Built 1984
Property features AI
Finance
- Other: Fee simple ownership; Additional parcel (.6 acres at 6325 Hoover Ln conveys with property)
Exterior
- Parking: Detached carport (4 spaces); Circular driveway with 4 driveway spaces; Total of 8 garage/parking spaces
- Utilities: Well water; Holding tank sewer; Electric hot water; Electric-powered HVAC components
- Home design: Detached single-family home; Single-story entry level (main-level living); Year built source: Assessor
- Construction: Vinyl siding exterior; Slab foundation
- Exterior features: Patio(s); Backs to trees; Boat storage; Kennels; Storage barn/shed and additional outbuilding(s)
Interior
- Kitchen: Stove; Microwave; Refrigerator; Freezer; Dishwasher
- Bedrooms: Two main-level bedrooms (including master bedroom)
- Bathrooms: One full bathroom on main level
- Heating & cooling: Heat pump heating and cooling; Electric heating and cooling; Ceiling fan cooling
- Interior features: Eat-in kitchen with table space; Ceiling fans; Sliding glass door(s); Wood stove; Drywall walls and ceilings; Living room, dining room, family room, and study
- Laundry & utility: Washer and dryer in unit on main floor
Neighborhood map
What this means for you Summary
Snapshot
- This is a 2-bed/1.0-bath single-family listed at $305k.
Deal economics
- At list price, monthly cash flow is $58 ($700/yr) — positive.
- The deal already cash-flows at list — no discount required.
- To meet the 1% rule (rent ≥ 1% of price), the offer needs to be $260k (14.8% below list).
- Recommended offer: $260k (14.8% below list) — sets the bar for 1% rule.
- Cap rate 6.5% vs local median 4.2% in Bryans Road — top-decile yield for the area; either an underpriced asset or a hidden risk that comps aren't pricing in. Stress-test before assuming the spread holds.
Location & tenants
- Location reads 62/100 on livability (#315 in MD) — a middle-class / working-renter tenant base. Strengths: employment A+, housing A+; Watch: crime D+, cost of living D+, amenities F.
- Charles County Public Schools (suburban): math 13% / reading 29% proficiency, ranked #14 of 24 in MD (top 58%) — low school quality limits family demand, transient renter base, plan for 1-2y turnover.
- Zoned schools: Henry E. Lackey High School (math 26% / reading 49%, grade F, #138 of 222 statewide, top 63%, 1,042 students, 50% FRL) — zoned schools average 50% FRL vs 28% district-wide (22 pts higher); higher-poverty schools than district average — tighter screening recommended.
- Zoned-school proficiency averages 38% at this address vs 21% district-wide (+16 pts) — the actual schools serving this property are materially stronger than the Charles County Public Schools average implies; a family-tenant draw the district grade alone would hide.
- Market conditions: 77 active listings in the ZIP; 1 comparable units currently listed for rent nearby; 1,542 units permitted in Charles County in 2024 (516 in 5+ unit buildings).
Forward outlook
- Local home prices are declining (-3.0%/yr); year-one equity from $2k of loan paydown is wiped out by about $9k of value loss. Plan a longer hold.
- Charles County population projected at +27% by 2050 — long-run rental-demand tailwind backs the buy-and-hold thesis.
Negotiation context
- Only 9 days on market — expect competitive offers; lowballing is unlikely to land.
- 11 sale attempts since 12y ago; this cycle's ask is 52% above the opening price — seller raised mid-cycle; expect resistance to lowballs.
- Current owner paid $195k; list at $305k implies a 56% gain — meaningful room to come down on a strong offer.
Risks & watch-outs
- Climate carrying-cost: extreme-heat days projected 7→16/yr by 2055 (HVAC capex compounding) — expect insurance premiums to compound above CPI over the hold.
Questions for the listing agent
- Is there a deadline driving the sale (1031 exchange, divorce, estate, relocation)? That informs how much negotiation room exists.
- Schools are D-rated, which usually means shorter tenancies and higher turnover. Who's the typical renter profile here, and what's been the actual vacancy rate?
- Crime grade is D in this area — have there been break-ins, vandalism, or insurance claims at this property in the last 3 years? What carrier currently insures it and at what premium?
- The area grade is low — what's the realistic commute time and amenity access for the typical tenant pool here? Any planned neighborhood developments (good or bad) we should know about?
- What's the average days-on-market for RENTAL listings here right now (not sales)? A rising rental-DOM trend means longer vacancies and softer asking-rent achievability than the comps imply.
- What's the recent tenant-quality profile in this submarket — average credit score on applications, eviction rate, late-payment / NSF rate, and stable-employment percentage? A property-management company in the area should have these aggregated.
- How much new for-sale + rental construction is in the pipeline within 1–3 miles? Heavy new supply typically softens prices + rents 12–24 months out; constrained supply supports both.
Investment metrics
- 1% rule
- 0.85% ✗
- Cap rate
- 6.52%
- Cash-on-cash
- 0.82%
- DSCR
- 1.04
- GRM
- 9.8
CMA / ARV
- ARV (on-the-fly)
- $324,864
- Comps found
- 1
Show comp detail 1 sale within ~0.75 mi
| Address | Dist | Beds/Ba | Sqft | Sold | Price | $/sf | Match |
|---|---|---|---|---|---|---|---|
| 6525 Oreto Ln | 0.21mi | 3/2.0 (+1) | 1,296 (+12%) | 10mo | $365,000 | $282 | 52 |
Match score weights: distance 35% · size 25% · config 20% · recency 20%. Top-matched comps best support the ARV.
Projected returns pro-forma
-3.0% appreciation · 3.0% rent growth · sell at horizon
- IRR
- -15.0%
- Equity multiple
- 0.46×
- Total profit
- $-45,736
- Equity at exit
- $45,476
- IRR
- -6.4%
- Equity multiple
- 0.59×
- Total profit
- $-35,162
- Equity at exit
- $26,371
Cash invested: $85,400 (down + closing). Projections, not guarantees.
Landlord ↔ Tenant lean methodology
- Overall (STATE)
- 27 Tenant-Leaning
- State Maryland
- 27 Tenant-Leaning · D+14
- County
- — inherits STATE
- City
- — inherits STATE
ZIP-level market 20616
- Home prices YoY
- -6.5%
- Active inventory
- 77
- Price-to-rent
- 9.8×
Monthly cashflow live
- Estimated rent
- $2,600 medium interval (Pro) →
- Mortgage (P&I)
- −$1,599
- Tax from tax record
- −$269 /mo · $3,229/yr
- Insurance
- −$127
- HOA
- −$0
- Vacancy / Maint / Mgmt
- −$546
- Net cashflow
- $58
Break-even live
UW: 25.0% down · 7.5% · 30yr · 1.5% tax · 5.0% vac · 8.0% maint · 8.0% mgmt
Financing live
Cash to close
- Down payment
- $76,250
- Closing costs
- $9,150
- Reserves months
- —
- Total cash needed
- —
Loan-product check · same deal, 3 products live
Conventional
25% down · 7.5% · 30yr
- Down + closing
- —
- Monthly P&I
- —
- Monthly cashflow
- —
- DSCR
- —
- Eligible?
- —
Personal DTI + credit; lowest rate.
DSCR
20% down · 8.5% · 30yr
- Down + closing
- —
- Monthly P&I
- —
- Monthly cashflow
- —
- DSCR
- —
- Eligible?
- —
No personal income docs; deal must DSCR.
Hard money
10% down · 12.0% · 12mo
- Down + closing
- —
- Monthly P&I
- —
- Monthly cashflow
- —
- DSCR
- —
- Eligible?
- —
Short-term bridge; refi at stabilization.
Rent comps 1 comps
| Address | Beds | Baths | Sqft | Rent | $/sqft | DOM | Units | Dist |
|---|---|---|---|---|---|---|---|---|
| 1420 Riverside Dr Bryans Road, MD | 2.0 | 1.5 | 1149 | $2,600 | $2.26 | 44d | 1 | 1.19mi |
Listing history 9 events
-
2026-06-18days on market $304,999 Active 9 DOM
-
2026-06-17statusdays on market $304,999 Active 8 DOM
-
2026-06-13statusdays on market $304,999 Active Under Contract 7 DOM
-
2026-06-09days on market $304,999 Active 5 DOM
-
2026-06-08days on market $304,999 Active 4 DOM
-
2026-06-07statusdays on market $304,999 Active 3 DOM
-
2026-06-04days on market $304,999 Coming Soon 2 DOM
-
2026-06-02remarks 699-char remark
-
2026-06-02$304,999 Coming Soon 1 DOM
ⓘ Source: listings_history table (triggers on properties + properties_extension) + one-shot
backfill from property_details.listing_events for pre-trigger history.
Tax reassessment forecast MD · Partial reset (capped growth)
- Current annual tax
- $3,229 · $269/mo
- Projected year-2 tax
- $3,277 · $273/mo
- Expected delta
- +$48/yr (+$4/mo · 1.5%)
ⓘ Screening estimate from a state-policy table — verify with the county assessor before closing.
Climate risk First Street
- Flood 1/10 Low FEMA zone X (unshaded) · 0% chance over 30 yrs
- Wildfire 4/10 Moderate
- Heat 7/10 Severe 7 d/yr ≥103°F today · 16 d/yr by 30 yrs out
- Wind 4/10 Moderate 17% chance of damaging wind over 30 yrs
- Air quality 2/10 Low 1 unhealthy d/yr today · 2 by 30 yrs out
Nearby sold comps map
Loading sold comps map…
Walkable amenities ~0.75 mi
Loading nearby amenities…
Taxation est. · year 1
- Rental income
- $31,200
- − Mortgage interest
- −$17,085
- − Property taxes
- −$3,229
- − Insurance
- −$1,525
- − Repairs & maintenance
- −$2,496
- − Management
- −$2,496
- − Depreciation
- −$8,873
- Taxable loss
- −$4,504
- Est. tax savings @ 24.0%
- +$1,081
- After-tax cash flow
- $1,781/yr
For passive investors: Depreciation is non-cash, so a rental often shows a tax loss while cash-flowing — sheltering income. Rental losses are passive: they offset passive income freely, and up to $25,000/yr can offset ordinary (W-2) income if you actively participate and your MAGI is under $100k (phasing out to $0 by $150k); unused losses carry forward. On sale, claimed depreciation is recaptured at up to 25%, and gains may owe capital-gains tax (a 1031 exchange can defer both). Figures are a year-1 estimate at your 24.0% rate — not tax advice; consult a CPA.
Schools (NCES district)
- District
- Charles County Public Schools
- NCES district ID
- 2400270
- Math proficiency
- 13% ▼ -19.00%
- Reading proficiency
- 29% ▼ -13.00%
- Median HH income
- $90,389
- Composite
- 22.54/100
- National rank
- #8087
- State rank
- #14 of 24 in MD
Livability — Bryans Road
- Score
- 62/100
- State rank
- #315
- US rank
- #16395
Category grades
Schools grade is shown separately in the Schools card above.
Census & demographics
- Population (ZIP)
- 7,435
Population outlook (Charles County) Hauer SSP2
- Today (2025)
- 176,616 people
- By 2030
- 186,471 · +5.6%
- By 2040
- 206,472 · +16.9%
- By 2050
- 224,883 · +27.3%
- By 2075
- 272,101 · +54.1%
- By 2100
- 303,564 · +71.9%
Race, ethnicity, and origin ACS 2023
- Neighborhood character
- Predominantly Black (71%)
- Race & ethnicity
- Black 71% White 14% Hispanic / Latino 8% Two or more races 7%
- Hispanic origin (detail)
- Mexican 1% Dominican 1%
- Common ancestry
- Italian 1%
- Foreign-born
- 7% · Canada, China
- Languages at home
- 93% English-only · Spanish 5% Tagalog/Filipino 1%
Political lean MEDSL · Charles
- 2024 margin
- Solid D (+40.7) · D 69.2% · R 28.5% · Other 2.2%
- 2008→2024 swing
- +15.2pp toward D · 2008: 25.5pp · 2024: 40.7pp
- All cycles
- 2024: D+40.7 2020: D+40.9 2016: D+30.2 2012: D+31.3 2008: D+25.5
Not yet ingested
- Civics
- —
Market trends
- HPI YoY
- ▼ -15.83%
- Current HPI
- 229.3107
- Rent YoY
- —
- Metro
- —
- State GDP YoY
- ▲ 2.97%
- F500 in state
- 12
Industry mix (Fortune 500 HQ in MD)
| Industry | F500 HQs | Revenue |
|---|---|---|
| Aerospace / Defense | 1 | $71B |
|
||
| Utilities | 1 | $25B |
|
||
| Hotels | 1 | $24B |
|
||
| Consumer Goods | 1 | $7B |
|
||
| Real Estate | 1 | $6B |
|
||
| Chemicals | 1 | $2B |
|
||
Price history
+165.4% since first listed31 events — show timeline
- 2026-06-02 Coming Soon $304,999 BRIGHT MLS
- 2019-08-28 Sold (Public Records) $195,000 Public Records
- 2019-08-08 Sold (MLS) $195,000 BRIGHT MLS
- 2019-07-03 Pending — BRIGHT MLS
- 2019-06-03 Listed $200,000 BRIGHT MLS
- 2019-06-03 Listing Removed — BRIGHT MLS
- 2019-05-29 Price Changed $200,000 BRIGHT MLS
- 2019-05-09 Price Changed $215,000 BRIGHT MLS
- 2019-02-12 Relisted — BRIGHT MLS
- 2018-11-16 Listing Removed — BRIGHT MLS
- 2018-09-13 Price Changed $225,000 BRIGHT MLS
- 2018-08-15 Relisted — BRIGHT MLS
- 2018-08-13 Listing Removed — BRIGHT MLS
- 2018-08-13 Listed $235,000 BRIGHT MLS
- 2015-07-30 Listing Removed — BRIGHT MLS
- 2015-07-30 Delisted — MRIS
- 2015-06-04 Relisted — MRIS
- 2015-05-26 Pending — MRIS
- 2015-05-23 Contingent — MRIS
- 2015-04-21 Listed — MRIS
- 2015-04-21 Listed $144,900 BRIGHT MLS
- 2015-04-11 Delisted — MRIS
- 2015-04-11 Listing Removed — BRIGHT MLS
- 2015-03-28 Listed — MRIS
- 2015-03-28 Listed $150,000 BRIGHT MLS
- 2015-02-12 Delisted — MRIS
- 2015-02-12 Listing Removed — BRIGHT MLS
- 2015-02-02 Price Changed — MRIS
- 2014-12-03 Listed — MRIS
- 2014-12-03 Listed $150,000 BRIGHT MLS
- 1997-06-20 Sold (Public Records) $114,900 Public Records
Property tax history
+3.9%/yrLatest (2025): $3,229 · +6.9% YoY. Source: county tax records.
Cash-flow waterfall
monthlySold comps — $/sqft
last 12 mo · ≤1 miLoading sold comps…