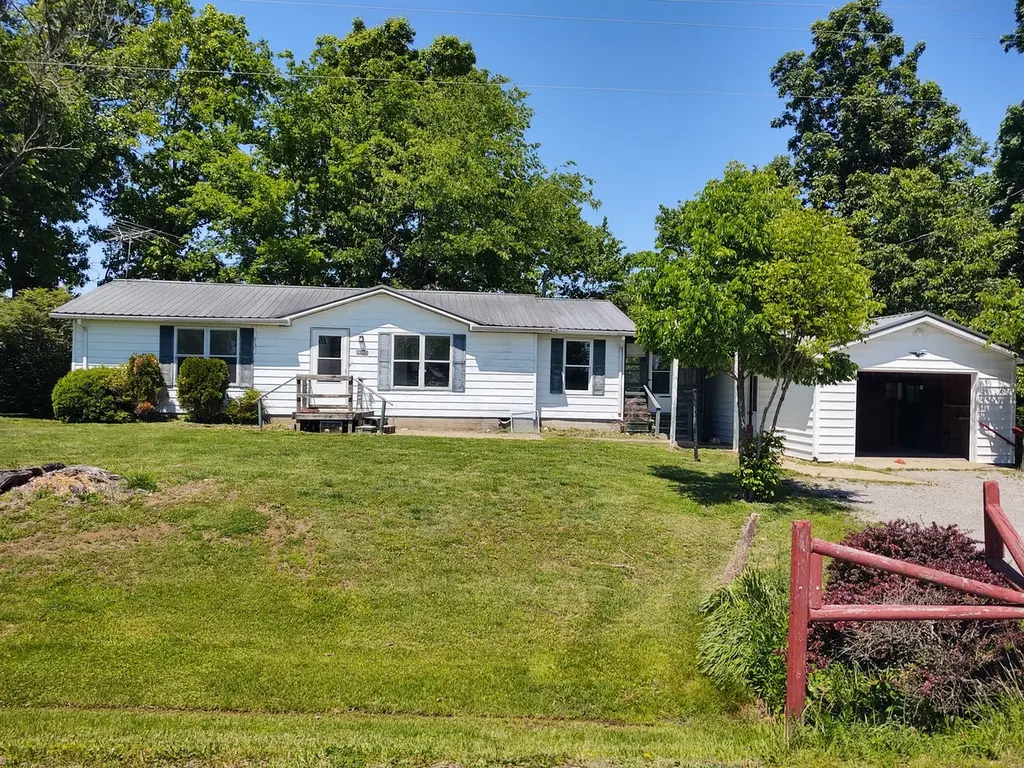
1045 Ozark Rd · New Burnside, IL
Flood risk 1/10 · Minimal
- FEMA flood zone
- X
- Chance of flooding over 30 yrs
- 0.0%
- Est. flood insurance / yr
- $473 – $860
Fire risk 4/10 · Minor
- Est. fire insurance / yr
- $804 – $1,492
Heat risk 4/10 · Minor
- Hot days now (above 106°F)
- 7 days/yr
- Hot days in 30 yrs
- 21 days/yr
Wind risk 3/10 · Minor
- Chance of severe wind over 30 yrs
- 4.0%
Air-quality risk 2/10 · Minimal
- Unhealthy air days now
- 0 days/yr
- Unhealthy air days in 30 yrs
- 1 days/yr
Risk factors via First Street. Map © Google.
Why this score? — see what drove the C+ grade
The composite is a weighted blend of 9 inputs, each scored 0–100. Each bar is that input's sub-score; the figure is the points it added to the 100-point composite (weight × sub-score).
- Cash flow +24.1/30.0
- DSCR +7.8/10.0
- ARV discount +7.5/15.0
- 1% rule +6.6/10.0
- Appreciation +5.6/10.0
- Livability +2.6/5.0
- Rent growth +2.5/5.0
- Condition / age +2.5/5.0
- Schools +2.4/10.0
$85,000
🖨 Deal sheet 📄 Offer letter ✓ Due diligence
Listing remarks
Wonderful Shady Yard & Budget Friendly Home-Ozark IL! 2 Bedroom, 1 Bath w/ Large Low Entry Shower & Grab Bars, Large Kitchen/Dining Space, An Extra Room for Office/Play/Possible 3rd Bedroom(new waterproof vinyl plank flooring), 8x24 Glass/Screened Side Porch, 16x24 Garage/Workshop w/ Door Opener. Older Building for Chickens/Garden Stuff. Starting of A Newer Dog/Chicken Pen + 10x16 Concrete Pad. Home Has Central Heat/Air, Metal Roof, Public Water, on Hard Surface Road. No Restrictions! Just Down Road From Camp Ondessonk, Jackson Falls, Bell Smith Springs, Gum Springs!! Call & Come See!
Key facts
- Concrete pad
- Garage workshop
- Central heat air
Tags
Property features AI
Finance
- Other: Lot approximately 0.5–0.99 acre (dimensions 322 x 213 x 320 x 215); Parcel number available
- HOA & community: No master association fee required; Community features include horse-riding trails, paved streets and sidewalks
Exterior
- Parking: Detached garage (garage owned); Two garage spaces and room for six vehicles total
- Utilities: Public water; Septic tank sewer
- Home design: Detached single-family home; One-story layout; Fee simple ownership; Disability accessible; School bus service available; Age: approximately 26–30 years
- Construction: Steel siding; Metal roof; Block foundation; Not rebuilt or rehabilitated
- Exterior features: Screened patio/porch; Exterior lighting; Wooded lot with mature trees
Interior
- Kitchen: Kitchen with eating area/table space
- Bedrooms: Two bedrooms (both on the main level); Additional rooms labeled as Bedroom 3 and Bedroom 4
- Flooring: Engineered hardwood in living room; Linoleum in dining room, kitchen and laundry
- Bathrooms: One full bathroom with accessible shower (no tub)
- Heating & cooling: Electric heating; Central air conditioning
- Interior features: Accessible shower; no bathtub; Separate dining room; Crawl space basement; Six total rooms
- Laundry & utility: Main-level laundry room
Neighborhood map
What this means for you Summary
Snapshot
- This is a 2-bed/1.0-bath single-family listed at $85k.
Deal economics
- At list price, monthly cash flow is $168 ($2k/yr) — positive.
- The deal already cash-flows at list — no discount required.
- Meets the 1% rule at list price ($985 rent vs $85k).
- Recommended offer: $82k (3.0% below list) — sets the bar for market timing.
Location & tenants
- Location reads 52/100 on livability (#1,308 in IL) — a working-class tenant base; expect higher turnover. Strengths: cost of living A+; Watch: housing C-, crime F, amenities F.
- Vienna Hsd 133 (rural): math 15% / reading 35% proficiency, ranked #630 of 919 in IL (top 69%) — low school quality limits family demand, transient renter base, plan for 1-2y turnover.
- Zoned schools: Vienna High School (math 12% / reading 27%, grade F, #397 of 693 statewide, top 61%, 322 students, 0% FRL).
- Market conditions: 11 active listings in the ZIP.
Forward outlook
- In year one you build about $2k of equity ($588 loan paydown + $1k appreciation (1.3% local appreciation)).
- Johnson County population projected at +4% by 2050 — modest demand growth; plan on rents tracking national, not racing it.
- At projected returns (1.3% appreciation + 3.0% rent growth), your $24k cash investment doubles in ~6 years — after that, you're playing with house money.
Negotiation context
- It's been on market 34 days — a 3% lower offer ($82k) is reasonable based on typical stale-listing flexibility.
Questions for the listing agent
- It's been on market 34 days. Have you received any prior offers? Is the seller open to a 3% concession, seller financing, or rate buy-down credit?
- Is there a deadline driving the sale (1031 exchange, divorce, estate, relocation)? That informs how much negotiation room exists.
- Schools are F-rated, which usually means shorter tenancies and higher turnover. Who's the typical renter profile here, and what's been the actual vacancy rate?
- Crime grade is F in this area — have there been break-ins, vandalism, or insurance claims at this property in the last 3 years? What carrier currently insures it and at what premium?
- What's the average days-on-market for RENTAL listings here right now (not sales)? A rising rental-DOM trend means longer vacancies and softer asking-rent achievability than the comps imply.
- What's the recent tenant-quality profile in this submarket — average credit score on applications, eviction rate, late-payment / NSF rate, and stable-employment percentage? A property-management company in the area should have these aggregated.
- How much new for-sale + rental construction is in the pipeline within 1–3 miles? Heavy new supply typically softens prices + rents 12–24 months out; constrained supply supports both.
Investment metrics
- 1% rule
- 1.16% ✓
- Cap rate
- 8.67%
- Cash-on-cash
- 8.48%
- DSCR
- 1.38
- GRM
- 7.2
CMA / ARV
- ARV (median comp)
- $176,562
- List price
- $85,000
- Delta
- -51.86%
- Verdict
- UNDERPRICED
- Comps
- 2 within 1.0 mi
Projected returns pro-forma
1.27% appreciation · 3.0% rent growth · sell at horizon
- IRR
- 10.9%
- Equity multiple
- 1.56×
- Total profit
- $13,439
- Equity at exit
- $30,203
- IRR
- 14.5%
- Equity multiple
- 2.80×
- Total profit
- $42,956
- Equity at exit
- $41,069
Cash invested: $23,800 (down + closing). Projections, not guarantees.
Landlord ↔ Tenant lean methodology
- Overall (STATE)
- 43 Moderately Tenant-Leaning
- State Illinois
- 43 Moderately Tenant-Leaning · D+7
- County
- — inherits STATE
- City
- — inherits STATE
ZIP-level market 62972
- Home prices YoY
- 0.8%
- Active inventory
- 11
- Price-to-rent
- 7.2×
Monthly cashflow live
- Estimated rent
- $985 medium interval (Pro) →
- Mortgage (P&I)
- −$446
- Tax from tax record
- −$129 /mo · $1,550/yr
- Insurance
- −$35
- HOA
- −$0
- Vacancy / Maint / Mgmt
- −$207
- Net cashflow
- $168
Break-even live
UW: 25.0% down · 7.5% · 30yr · 1.5% tax · 5.0% vac · 8.0% maint · 8.0% mgmt
Financing live
Cash to close
- Down payment
- $21,250
- Closing costs
- $2,550
- Reserves months
- —
- Total cash needed
- —
Loan-product check · same deal, 3 products live
Conventional
25% down · 7.5% · 30yr
- Down + closing
- —
- Monthly P&I
- —
- Monthly cashflow
- —
- DSCR
- —
- Eligible?
- —
Personal DTI + credit; lowest rate.
DSCR
20% down · 8.5% · 30yr
- Down + closing
- —
- Monthly P&I
- —
- Monthly cashflow
- —
- DSCR
- —
- Eligible?
- —
No personal income docs; deal must DSCR.
Hard money
10% down · 12.0% · 12mo
- Down + closing
- —
- Monthly P&I
- —
- Monthly cashflow
- —
- DSCR
- —
- Eligible?
- —
Short-term bridge; refi at stabilization.
Listing history 18 events
-
2026-06-18days on market $85,000 Active 34 DOM
-
2026-06-17days on market $85,000 Active 33 DOM
-
2026-06-16days on market $85,000 Active 32 DOM
-
2026-06-15days on market $85,000 Active 31 DOM
-
2026-06-13days on market $85,000 Active 29 DOM
-
2026-06-12days on market $85,000 Active 28 DOM
-
2026-06-09days on market $85,000 Active 25 DOM
-
2026-06-08days on market $85,000 Active 24 DOM
-
2026-06-07days on market $85,000 Active 23 DOM
-
2026-06-05days on market $85,000 Active 21 DOM
-
2026-06-04days on market $85,000 Active 19 DOM
-
2026-06-02days on market $85,000 Active 18 DOM
-
2026-06-01days on market $85,000 Active 17 DOM
-
2026-05-31days on market $85,000 Active 16 DOM
-
2026-05-31days on market $85,000 Active 15 DOM
-
2026-05-15$85,000 Active 599-char remark
-
2023-07-24soldstatus $112,500
-
2002-11-04soldstatus $29,850
ⓘ Source: listings_history table (triggers on properties + properties_extension) + one-shot
backfill from property_details.listing_events for pre-trigger history.
Tax reassessment forecast IL · Partial reset (capped growth)
- Current annual tax
- $1,550 · $129/mo
- Projected year-2 tax
- $1,740 · $145/mo
- Expected delta
- +$190/yr (+$16/mo · 12.3%)
ⓘ Screening estimate from a state-policy table — verify with the county assessor before closing.
Climate risk First Street
- Flood 1/10 Low FEMA zone X · 0% chance over 30 yrs
- Wildfire 4/10 Moderate
- Heat 4/10 Moderate 7 d/yr ≥106°F today · 21 d/yr by 30 yrs out
- Wind 3/10 Moderate 4% chance of damaging wind over 30 yrs
- Air quality 2/10 Low 0 unhealthy d/yr today · 1 by 30 yrs out
Nearby sold comps map
Loading sold comps map…
Walkable amenities ~0.75 mi
Loading nearby amenities…
Taxation est. · year 1
- Rental income
- $11,824
- − Mortgage interest
- −$4,761
- − Property taxes
- −$1,550
- − Insurance
- −$425
- − Repairs & maintenance
- −$946
- − Management
- −$946
- − Depreciation
- −$2,473
- Taxable income
- $723
- Est. tax owed @ 24.0%
- −$174
- After-tax cash flow
- $1,844/yr
For passive investors: Depreciation is non-cash, so a rental often shows a tax loss while cash-flowing — sheltering income. Rental losses are passive: they offset passive income freely, and up to $25,000/yr can offset ordinary (W-2) income if you actively participate and your MAGI is under $100k (phasing out to $0 by $150k); unused losses carry forward. On sale, claimed depreciation is recaptured at up to 25%, and gains may owe capital-gains tax (a 1031 exchange can defer both). Figures are a year-1 estimate at your 24.0% rate — not tax advice; consult a CPA.
Schools (NCES district)
- District
- Vienna Hsd 133
- NCES district ID
- 1740290
- Math proficiency
- 15% ▲ 5.00%
- Reading proficiency
- 35% ▬ 0.00%
- Median HH income
- $40,197
- Composite
- 24.12/100
- National rank
- #13157
- State rank
- #630 of 919 in IL
Livability — New Burnside
- Score
- 52/100
- State rank
- #1308
- US rank
- #24820
Category grades
Schools grade is shown separately in the Schools card above.
Census & demographics
- Population (ZIP)
- 891
Population outlook (Johnson County) Hauer SSP2
- Today (2025)
- 13,355 people
- By 2030
- 13,579 · +1.7%
- By 2040
- 13,849 · +3.7%
- By 2050
- 13,880 · +3.9%
- By 2075
- 13,759 · +3.0%
- By 2100
- 11,536 · -13.6%
Race, ethnicity, and origin ACS 2023
- Neighborhood character
- Predominantly White (88%)
- Race & ethnicity
- White 88% Hispanic / Latino 9% Two or more races 2%
- Hispanic origin (detail)
- Mexican 7%
- Common ancestry
- Romanian 9% Italian 2% Serbian 1%
- Foreign-born
- 1% · Canada
- Languages at home
- 97% English-only · Spanish 3%
Political lean MEDSL · Johnson
- 2024 margin
- Solid R (+58.3) · D 20.3% · R 78.6% · Other 1.1%
- 2008→2024 swing
- -23.7pp toward R · 2008: -34.6pp · 2024: -58.3pp
- All cycles
- 2024: R+58.3 2020: R+58.6 2016: R+58.3 2012: R+42.1 2008: R+34.6
Not yet ingested
- Civics
- —
Market trends
- HPI YoY
- ▲ 1.27%
- Current HPI
- 164.2171
- Rent YoY
- —
- Metro
- —
- State GDP YoY
- ▲ 1.59%
- F500 in state
- 60
Industry mix (Fortune 500 HQ in IL)
| Industry | F500 HQs | Revenue |
|---|---|---|
| Insurance | 4 | $201B |
|
||
| Consumer Goods | 4 | $87B |
|
||
| Industrial Machinery | 3 | $64B |
|
||
| Healthcare | 2 | $55B |
|
||
| Retail / Pharmacy | 1 | $148B |
|
||
| Agriculture / Food | 1 | $86B |
|
||
Price history
+184.8% since first listed3 events — show timeline
- 2026-05-15 Listed $85,000 MRED as Distributed by MLS Grid
- 2023-07-24 Sold (Public Records) $112,500 Public Records
- 2002-11-04 Sold (Public Records) $29,850 Public Records
Property tax history
+25.7%/yrLatest (2024): $1,550 · +4.2% YoY. Source: county tax records.
Cash-flow waterfall
monthlySold comps — $/sqft
last 12 mo · ≤1 miLoading sold comps…