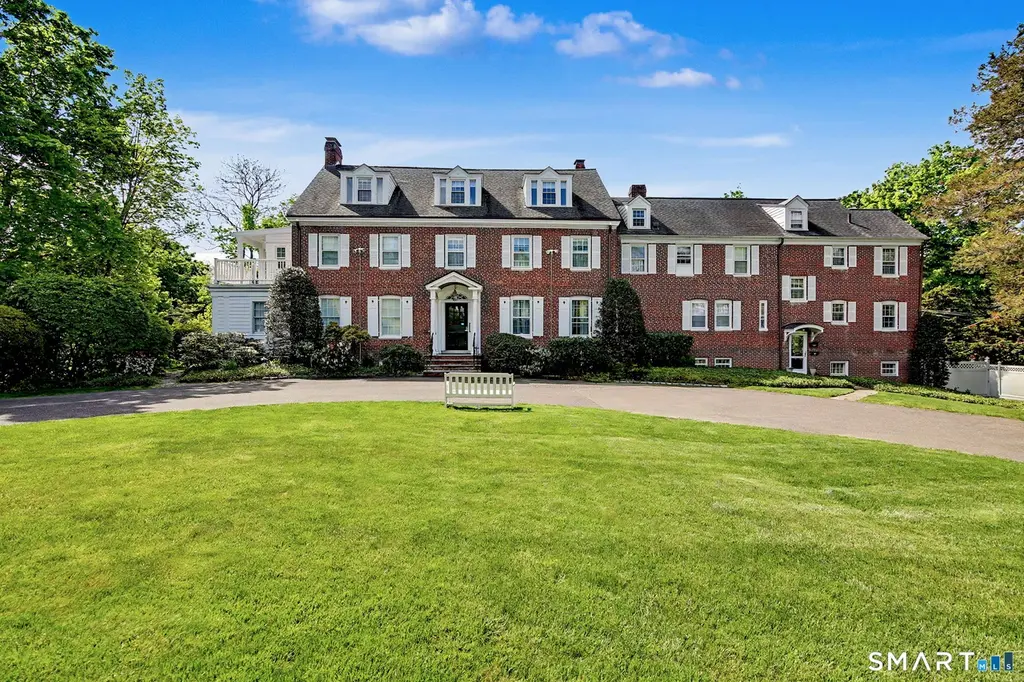
24 Saint Johns Pl #4 · New Canaan, CT
Flood risk 1/10 · Minimal
- FEMA flood zone
- X (unshaded)
- Chance of flooding over 30 yrs
- 0.0%
- Est. flood insurance / yr
- $507 – $1,088
Fire risk 1/10 · Minimal
- Est. fire insurance / yr
- $829 – $1,539
Heat risk 5/10 · Moderate
- Hot days now (above 99°F)
- 7 days/yr
- Hot days in 30 yrs
- 16 days/yr
Wind risk 6/10 · Moderate
- Chance of severe wind over 30 yrs
- 58.0%
Air-quality risk 4/10 · Minor
- Unhealthy air days now
- 4 days/yr
- Unhealthy air days in 30 yrs
- 6 days/yr
Risk factors via First Street. Map © Google.
Why this score? — see what drove the D+ grade
The composite is a weighted blend of 9 inputs, each scored 0–100. Each bar is that input's sub-score; the figure is the points it added to the 100-point composite (weight × sub-score).
- Cash flow +14.1/30.0
- Schools +8.1/10.0
- ARV discount +7.5/15.0
- 1% rule +5.3/10.0
- DSCR +4.3/10.0
- Rent growth +2.5/5.0
- Livability +2.5/5.0
- Condition / age +2.5/5.0
- Appreciation +0.0/10.0
$599,000
🖨 Deal sheet 📄 Offer letter ✓ Due diligence
Listing remarks
In-town location. Ideally situated just one block from the Metro North train station to NYC, village center, parks and library and all the plethora of amenities New Canaan has to offer. A circular drive and lush front lawn greet you at this brick 1910 mansion, which has been thoughtfully converted into nine charming residences. The property features park-like estate grounds perfect for picnics on the sweeping level back lawn. Sitting benches and lovely gardens abound. St. John Place is a highly sought-after location on "the Acre". This two-bedroom condo with living room, dining room, kitchen and roof top views is the perfect place to call home. HOA fee includes-heat, hot water, wa
Key facts
- Circular drive
- Sitting benches
- Lush front lawn
Tags
Property features AI
Finance
- HOA & community: Monthly HOA fee; HOA includes trash pickup, snow removal, heat, hot water, water, sewer, and property management; Has homeowner's association; Professional off-site property management; Pets allowed (ask for details)
Exterior
- Parking: Paved assigned parking space (1)
- Utilities: Public water connected; Public sewer connected
- Home design: Condominium (Condo/Co-Op for sale); Part of St. John Place complex; Unit on 3rd floor
- Construction: Brick construction
- Exterior features: Brick siding; Garden area; Level lot
Interior
- Kitchen: Electric range; Microwave; Range hood; Refrigerator; Dishwasher
- Bedrooms: 2 bedrooms
- Bathrooms: 1 full bathroom
- Heating & cooling: Wall unit cooling; Other heat; Other hot water
- Interior features: 3-level unit; Full unfinished basement; Laundry room in unit
- Laundry & utility: In-unit laundry
Neighborhood map
What this means for you Summary
Snapshot
- This is a 2-bed/1.0-bath condo listed at $599k.
Deal economics
- At list price, monthly cash flow is $86 ($1k/yr) — positive.
- The deal already cash-flows at list — no discount required.
- Meets the 1% rule at list price ($6k rent vs $599k).
- Recommended offer: $581k (3.0% below list) — sets the bar for market timing.
- Cap rate 6.5% vs local median 1.5% in New Canaan — top-decile yield for the area; either an underpriced asset or a hidden risk that comps aren't pricing in. Stress-test before assuming the spread holds.
Location & tenants
- Location reads: area grade D — affects rentability + tenant quality, not the cash-flow math above.
- New Canaan School District (suburban): math 81% / reading 86% proficiency, ranked #1 of 153 in CT (top 1%) — strong family-tenant draw, lease renewals of 3-5y typical; only 6% free/reduced lunch — higher-income household profile.
- Zoned schools: West School (math 92% / reading 87%, grade A+, #1 of 553 statewide, top 0%, 483 students, 0% FRL); New Canaan High School (math 77% / reading 92%, grade A, #1 of 194 statewide, top 1%, 1,294 students, 0% FRL).
- Market conditions: 165 active listings in the ZIP; 11 comparable units currently listed for rent nearby; rentals at typical pace (median 24d on market — plan ~3-4 weeks tenant-placement turnaround); high-income renter base; 1,151 units permitted in Western Connecticut Planning Region in 2024 (714 in 5+ unit buildings).
Forward outlook
- Local home prices are declining (-3.0%/yr); year-one equity from $4k of loan paydown is wiped out by about $18k of value loss. Plan a longer hold.
Negotiation context
- It's been on market 37 days — a 3% lower offer ($581k) is reasonable based on typical stale-listing flexibility.
- 4 sale attempts since 19y ago; this cycle's ask has dropped $100k (14%) from the opening price — seller is motivated, your offer sets the floor, not the list.
- Current owner paid $375k; list at $599k implies a 60% gain — meaningful room to come down on a strong offer.
Risks & watch-outs
- Watch-outs: built in 1910 — expect roof / HVAC / electrical / plumbing capex.
- Climate carrying-cost: major wind risk, 58% chance of damaging wind over 30y; extreme-heat days projected 7→16/yr by 2055 (HVAC capex compounding) — expect insurance premiums to compound above CPI over the hold.
Questions for the listing agent
- It's been on market 37 days. Have you received any prior offers? Is the seller open to a 3% concession, seller financing, or rate buy-down credit?
- Built in 1910 — when were the roof, HVAC, electrical panel, plumbing, and water heater last replaced?
- What does the HOA fee cover, when was the last increase, and are there any pending special assessments or reserve-fund shortfalls?
- Any open or pending special assessments — roof, HVAC, plumbing, elevator, façade? What's the per-unit balance and payoff schedule, and is the seller paying it off at close or rolling it to the buyer?
- Is there a deadline driving the sale (1031 exchange, divorce, estate, relocation)? That informs how much negotiation room exists.
- The area grade is low — what's the realistic commute time and amenity access for the typical tenant pool here? Any planned neighborhood developments (good or bad) we should know about?
- What's the average days-on-market for RENTAL listings here right now (not sales)? A rising rental-DOM trend means longer vacancies and softer asking-rent achievability than the comps imply.
- What's the recent tenant-quality profile in this submarket — average credit score on applications, eviction rate, late-payment / NSF rate, and stable-employment percentage? A property-management company in the area should have these aggregated.
- How much new apartment / multifamily construction is in the pipeline within 1–3 miles? Heavy new supply (>2% of stock underway) typically softens rents 12–24 months out; light construction supports rent growth.
Investment metrics
- 1% rule
- 1.03% ✓
- Cap rate
- 6.47%
- Cash-on-cash
- 0.62%
- DSCR
- 1.03
- GRM
- 8.1
CMA / ARV
- ARV (median comp)
- $1,604,525
- List price
- $599,000
- Delta
- -62.67%
- Verdict
- UNDERPRICED
- Comps
- 20 within 1.0 mi
Projected returns pro-forma
-3.0% appreciation · 3.0% rent growth · sell at horizon
- IRR
- -15.2%
- Equity multiple
- 0.46×
- Total profit
- $-91,075
- Equity at exit
- $89,313
- IRR
- -6.5%
- Equity multiple
- 0.58×
- Total profit
- $-70,215
- Equity at exit
- $51,791
Cash invested: $167,720 (down + closing). Projections, not guarantees.
Landlord ↔ Tenant lean methodology
- Overall (STATE)
- 27 Tenant-Leaning
- State Connecticut
- 27 Tenant-Leaning · D+7
- County
- — inherits STATE
- City
- — inherits STATE
ZIP-level market 06840
- Active inventory
- 165
- Price-to-rent
- 8.1×
Monthly cashflow live
- Estimated rent
- $6,181 high interval (Pro) →
- Mortgage (P&I)
- −$3,141
- Tax from tax record
- −$436 /mo · $5,229/yr
- Insurance
- −$250
- HOA
- −$970
- Vacancy / Maint / Mgmt
- −$1,298
- Net cashflow
- $86
Break-even live
UW: 25.0% down · 7.5% · 30yr · 1.5% tax · 5.0% vac · 8.0% maint · 8.0% mgmt
Financing live
Cash to close
- Down payment
- $149,750
- Closing costs
- $17,970
- Reserves months
- —
- Total cash needed
- —
Loan-product check · same deal, 3 products live
Conventional
25% down · 7.5% · 30yr
- Down + closing
- —
- Monthly P&I
- —
- Monthly cashflow
- —
- DSCR
- —
- Eligible?
- —
Personal DTI + credit; lowest rate.
DSCR
20% down · 8.5% · 30yr
- Down + closing
- —
- Monthly P&I
- —
- Monthly cashflow
- —
- DSCR
- —
- Eligible?
- —
No personal income docs; deal must DSCR.
Hard money
10% down · 12.0% · 12mo
- Down + closing
- —
- Monthly P&I
- —
- Monthly cashflow
- —
- DSCR
- —
- Eligible?
- —
Short-term bridge; refi at stabilization.
Rent comps 11 comps
| Address | Beds | Baths | Sqft | Rent | $/sqft | DOM | Units | Dist |
|---|---|---|---|---|---|---|---|---|
| 54 Main St New Canaan, CT | 2.0 | 2.5 | 1347 | $7,350 | $5.46 | 23d | 1 | 0.20mi |
| 8 Husted Ln Unit 1D New Canaan, CT | 2.0 | 2.0 | 1050 | $5,975 | $5.69 | 23d | 1 | 0.24mi |
| 37 Maple St New Canaan, CT | 2.0 | 2.5 | 1506 | $6,500 | $4.32 | 43d | 1 | 0.27mi |
| 88 Heritage Hill Rd Unit A New Canaan, CT | 2.0 | 1.0 | 927 | $3,575 | $3.86 | 14d | 1 | 0.32mi |
| 44 Hillside Ave New Canaan, CT | 3.0 | 1.5 | 1200 | $5,200 | $4.33 | 43d | 1 | 0.42mi |
| 244 Park St #244 New Canaan, CT | 3.0 | 2.0 | 1521 | $7,500 | $4.93 | 23d | 1 | 0.43mi |
| 52 Sunrise Ave New Canaan, CT | 3.0 | 2.0 | 1198 | $7,500 | $6.26 | 14d | 1 | 0.43mi |
| 172 East Ave #174 New Canaan, CT | 2.0 | 1.0 | 1162 | $4,100 | $3.53 | 3d | 1 | 0.65mi |
| 135 Millport Ave New Canaan, CT | 3.0 | 1.5 | 1576 | $5,300 | $3.36 | 23d | 1 | 0.67mi |
| 138 Millport Ave New Canaan, CT | 3.0 | 1.5 | 1750 | $5,300 | $3.03 | 43d | 1 | 0.71mi |
| 100 Lakeview Ave New Canaan, CT | 2.0–3.0 | 2.0 | 1255 | $3,935 | $3.14 | 2d | 8 | 0.76mi |
HOA detail condo
- Monthly dues
- $970 · $11,640/yr
- Likely covers
- waterlandscaping
- Assessments
- None detected in remarks — confirm with the listing agent.
Listing history 27 events
-
2026-06-18days on market $599,000 Active 37 DOM
-
2026-06-17days on market $599,000 Active 36 DOM
-
2026-06-16days on market $599,000 Active 35 DOM
-
2026-06-15days on market $599,000 Active 34 DOM
-
2026-06-13days on market $599,000 Active 32 DOM
-
2026-06-10pricedays on market $599,000 Active 29 DOM
-
2026-06-09days on market $699,000 Active 28 DOM
-
2026-06-08days on market $699,000 Active 27 DOM
-
2026-06-07days on market $699,000 Active 26 DOM
-
2026-06-05days on market $699,000 Active 23 DOM
-
2026-06-03days on market $699,000 Active 22 DOM
-
2026-06-03days on market $699,000 Active 21 DOM
-
2026-06-01days on market $699,000 Active 20 DOM
-
2026-05-31days on market $699,000 Active 19 DOM
-
2026-05-12$699,000 Active 530-char remark
-
2009-06-10soldstatus $375,000
-
2009-06-09soldstatus $375,000
-
2008-12-08$375,000
-
2008-07-31historical
-
2008-04-09$495,000
-
2008-01-02historical
-
2007-09-14$565,000
-
2005-07-26soldstatus $510,000
-
2002-06-18soldstatus $358,000
-
1994-08-30soldstatus $154,000
-
1992-06-11soldstatus $225,000
-
1988-10-28soldstatus $225,000
ⓘ Source: listings_history table (triggers on properties + properties_extension) + one-shot
backfill from property_details.listing_events for pre-trigger history.
Tax reassessment forecast CT · Partial reset (capped growth)
- Current annual tax
- $5,229 · $436/mo
- Projected year-2 tax
- $9,024 · $752/mo
- Expected delta
- +$3,795/yr (+$316/mo · 72.6%)
ⓘ Screening estimate from a state-policy table — verify with the county assessor before closing.
Climate risk First Street
- Flood 1/10 Low FEMA zone X (unshaded) · 0% chance over 30 yrs
- Wildfire 1/10 Low
- Heat 5/10 Major 7 d/yr ≥99°F today · 16 d/yr by 30 yrs out
- Wind 6/10 Major 58% chance of damaging wind over 30 yrs
- Air quality 4/10 Moderate 4 unhealthy d/yr today · 6 by 30 yrs out
Nearby sold comps map
Loading sold comps map…
Walkable amenities ~0.75 mi
Loading nearby amenities…
Taxation est. · year 1
- Rental income
- $74,169
- − Mortgage interest
- −$33,553
- − Property taxes
- −$5,229
- − Insurance
- −$2,995
- − Repairs & maintenance
- −$5,934
- − Management
- −$5,934
- − HOA
- −$11,640
- − Depreciation
- −$17,425
- Taxable loss
- −$8,541
- Est. tax savings @ 24.0%
- +$2,050
- After-tax cash flow
- $3,085/yr
For passive investors: Depreciation is non-cash, so a rental often shows a tax loss while cash-flowing — sheltering income. Rental losses are passive: they offset passive income freely, and up to $25,000/yr can offset ordinary (W-2) income if you actively participate and your MAGI is under $100k (phasing out to $0 by $150k); unused losses carry forward. On sale, claimed depreciation is recaptured at up to 25%, and gains may owe capital-gains tax (a 1031 exchange can defer both). Figures are a year-1 estimate at your 24.0% rate — not tax advice; consult a CPA.
Schools (NCES district)
- District
- New Canaan School District
- NCES district ID
- 0902700
- Math proficiency
- 81% ▼ -6.00%
- Reading proficiency
- 86% ▼ -4.00%
- Median HH income
- $164,303
- Composite
- 81.47/100
- National rank
- #38
- State rank
- #1 of 153 in CT
Livability — New Canaan
No livability data for this city. (Only ~50 U.S. cities are tracked.)
Census & demographics
- Census place
- New Canaan, CT
- County
- Fairfield County · 765,532 people
- City population
- 20,870
- Metro
- Bridgeport-Stamford-Norwalk, CT
- Population (ZIP)
- 20,870
- Household income
- $250,001
- Rent vs Own
- Severe rent burden
- 261.0
Population outlook (Western Connecticut County) Hauer SSP2
- By 2040
- 685,031
Race, ethnicity, and origin ACS 2023
- Neighborhood character
- Predominantly White (83%)
- Race & ethnicity
- White 83% Two or more races 7% Asian 6% Hispanic / Latino 5% Black 2%
- Common ancestry
- Romanian 5% Lithuanian 4% Italian 2%
- Foreign-born
- 14% · Canada, China, South Korea
- Languages at home
- 85% English-only · Other Indo-European 6% Chinese 2% Spanish 2%
Political lean MEDSL · Western Connecticut
- 2024 margin
- D (+19.1) · D 58.8% · R 39.7% · Other 1.6%
- All cycles
- 2024: D+19.1
Not yet ingested
- Civics
- —
Market trends
- HPI YoY
- ▼ -480.93%
- Current HPI
- 232.5667
- Rent YoY
- —
- Metro
- Bridgeport-Stamford-Norwalk, CT
- State GDP YoY
- ▲ 1.06%
- F500 in state
- 38
Industry mix (Fortune 500 HQ in CT)
| Industry | F500 HQs | Revenue |
|---|---|---|
| Industrial Machinery | 4 | $38B |
|
||
| Insurance | 3 | $71B |
|
||
| Financial Services | 2 | $25B |
|
||
| Transportation / Logistics | 2 | $18B |
|
||
| Healthcare | 1 | $247B |
|
||
| Telecommunications | 1 | $55B |
|
||
Price history
+166.2% since first listed14 events — show timeline
- 2026-06-09 Price Changed $599,000 Smart MLS
- 2026-05-12 Listed $699,000 Smart MLS
- 2009-06-10 Sold (Public Records) $375,000 Public Records
- 2009-06-09 Sold (MLS) $375,000 Smart MLS
- 2008-12-08 Listed $375,000 Smart MLS
- 2008-07-31 Listing Removed — Smart MLS
- 2008-04-09 Listed $495,000 Smart MLS
- 2008-01-02 Listing Removed — Smart MLS
- 2007-09-14 Listed $565,000 Smart MLS
- 2005-07-26 Sold (Public Records) $510,000 Public Records
- 2002-06-18 Sold (Public Records) $358,000 Public Records
- 1994-08-30 Sold (Public Records) $154,000 Public Records
- 1992-06-11 Sold (Public Records) $225,000 Public Records
- 1988-10-28 Sold (Public Records) $225,000 Public Records
Property tax history
+2.8%/yrLatest (2023): $5,229 · +3.1% YoY. Source: county tax records.
Cash-flow waterfall
monthlySold comps — $/sqft
last 12 mo · ≤1 miLoading sold comps…