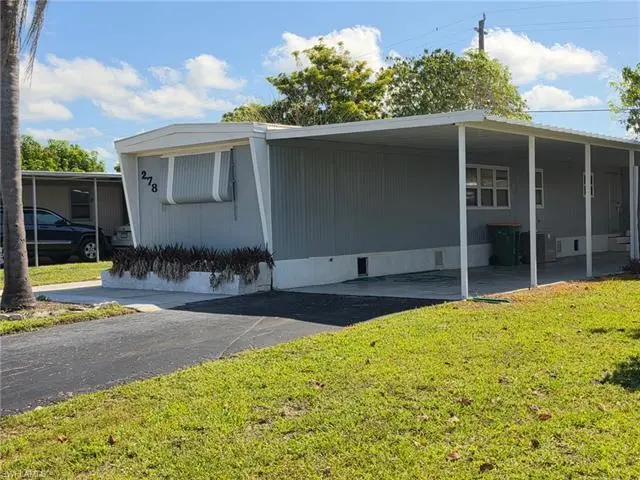
278 Cape Sable Dr · Berkshire Lakes, FL
Flood risk 6/10 · Moderate
- FEMA flood zone
- X (unshaded)
- Chance of flooding over 30 yrs
- 0.51%
- Est. flood insurance / yr
- $507 – $1,088
Fire risk 1/10 · Minimal
- Est. fire insurance / yr
- $947 – $1,759
Heat risk 10/10 · Severe
- Hot days now (above 107°F)
- 6 days/yr
- Hot days in 30 yrs
- 24 days/yr
Wind risk 10/10 · Severe
- Chance of severe wind over 30 yrs
- 99.0%
Air-quality risk 2/10 · Minimal
- Unhealthy air days now
- 2 days/yr
- Unhealthy air days in 30 yrs
- 2 days/yr
Risk factors via First Street. Map © Google.
Why this score? — see what drove the B- grade
The composite is a weighted blend of 9 inputs, each scored 0–100. Each bar is that input's sub-score; the figure is the points it added to the 100-point composite (weight × sub-score).
- Cash flow +30.0/30.0
- 1% rule +10.0/10.0
- DSCR +10.0/10.0
- ARV discount +7.5/15.0
- Schools +5.0/10.0
- Livability +2.5/5.0
- Condition / age +2.5/5.0
- Rent growth +2.2/5.0
- Appreciation +0.0/10.0
$79,999
🖨 Deal sheet 📄 Offer letter ✓ Due diligence
Listing remarks
Located in a desirable 55+ community in Naples. Community offers a peaceful setting with well-maintained surroundings and amenities for active adult living. Conveniently located near shopping, dining, golf, and Gulf beaches. Great opportunity for seasonal, retirement, or low-maintenance living.
Key facts
- Near dining
- Near golf
- Near shopping
Tags
Property features AI
Finance
- Other: Single-unit property in a single-story building
- HOA & community: Mandatory HOA; Monthly HOA fee of $188 (annual recurring fees $2,256); On-site management; Lawn/land maintenance included; Community clubhouse; Mobile/manufactured community type
Exterior
- Parking: Attached 1-car carport
- Utilities: Water assessment paid; Sewer assessment paid; Cable available
- Home design: Manufactured residential property; 1 story (ranch) with rear exposure to the east; Located in NAPLES MOBILE ESTATE (Naples Mobile Estates)
- Construction: Modular construction; Shingle roof; Built in 1972; Architectural plans used for lot dimensions
- Exterior features: Landscaped area view; Windows: see remarks
Interior
- Bedrooms: 4 bedrooms
- Bathrooms: 1 full bathroom; 1 half bathroom; No master bath
- Heating & cooling: Central electric heat
- Interior features: Open dining area (family-style); Unfurnished; See remarks for additional interior details
Neighborhood map
What this means for you Summary
Snapshot
- This is a 4-bed/1.5-bath manufactured listed at $80k.
Deal economics
- At list price, monthly cash flow is $1k ($15k/yr) — positive.
- The deal already cash-flows at list — no discount required.
- Meets the 1% rule at list price ($3k rent vs $80k).
- Recommended offer: $79k (1.5% below list) — sets the bar for market timing.
Location & tenants
- Location reads: area grade B — affects rentability + tenant quality, not the cash-flow math above.
- Collier (suburban): math 60% / reading 56% proficiency, ranked #16 of 73 in FL (top 22%) — acceptable for families but not a draw, mixed tenant base, ~2y average lease.
- Market conditions: Rents soft (-1.1%/yr); 436 active listings in the ZIP; 6 comparable units currently listed for rent nearby; rentals at typical pace (median 21d on market — plan ~3-4 weeks tenant-placement turnaround); 3,520 units permitted in Collier County in 2024 (959 in 5+ unit buildings).
- This rent runs 43% of the median local income ($72k/yr) — at the standard rent-burdened threshold; future hikes will face affordability resistance.
Forward outlook
- Local home prices are declining (-3.0%/yr); year-one equity from $553 of loan paydown is wiped out by about $2k of value loss. Plan a longer hold.
- Collier County population projected at +30% by 2050 — long-run rental-demand tailwind backs the buy-and-hold thesis.
- At projected returns (-3.0% appreciation + 0.0% rent growth), your $22k cash investment doubles in ~2 years — after that, you're playing with house money.
Negotiation context
- It's been on market 20 days — a 2% lower offer ($79k) is reasonable based on typical stale-listing flexibility.
- Current owner paid $66k; 21% above their basis — modest negotiation headroom, anchor on the comps not their cost.
Risks & watch-outs
- Climate carrying-cost: major flood risk; severe wind risk, 99% chance of damaging wind over 30y; extreme-heat days projected 6→24/yr by 2055 (HVAC capex compounding) — expect insurance premiums to compound above CPI over the hold.
Questions for the listing agent
- Built in 1972 — when were the roof, HVAC, electrical panel, plumbing, and water heater last replaced?
- What does the HOA fee cover, when was the last increase, and are there any pending special assessments or reserve-fund shortfalls?
- Is there a deadline driving the sale (1031 exchange, divorce, estate, relocation)? That informs how much negotiation room exists.
- What's the average days-on-market for RENTAL listings here right now (not sales)? A rising rental-DOM trend means longer vacancies and softer asking-rent achievability than the comps imply.
- What's the recent tenant-quality profile in this submarket — average credit score on applications, eviction rate, late-payment / NSF rate, and stable-employment percentage? A property-management company in the area should have these aggregated.
- How much new for-sale + rental construction is in the pipeline within 1–3 miles? Heavy new supply typically softens prices + rents 12–24 months out; constrained supply supports both.
Investment metrics
- 1% rule
- 3.22% ✓
- Cap rate
- 25.44%
- Cash-on-cash
- 68.40%
- DSCR
- 4.04
- GRM
- 2.6
CMA / ARV
No comps found within radius.
Projected returns pro-forma
-3.0% appreciation · 0.0% rent growth · sell at horizon
- IRR
- 64.1%
- Equity multiple
- 3.72×
- Total profit
- $60,967
- Equity at exit
- $11,928
- IRR
- 67.4%
- Equity multiple
- 6.77×
- Total profit
- $129,291
- Equity at exit
- $6,917
Cash invested: $22,400 (down + closing). Projections, not guarantees.
Landlord ↔ Tenant lean methodology
- Overall (STATE)
- 87 Strongly Landlord-Friendly
- State Florida
- 87 Strongly Landlord-Friendly · R+3
- County
- — inherits STATE
- City
- — inherits STATE
ZIP-level market 34104
- Rents YoY
- -1.1%
- Active inventory
- 436
- Price-to-rent
- 2.6×
Monthly cashflow live
- Estimated rent
- $2,576 high interval (Pro) →
- Mortgage (P&I)
- −$420
- Tax from tax record
- −$117 /mo · $1,409/yr
- Insurance
- −$33
- HOA
- −$188
- Vacancy / Maint / Mgmt
- −$541
- Net cashflow
- $1,277
Break-even live
UW: 25.0% down · 7.5% · 30yr · 1.5% tax · 5.0% vac · 8.0% maint · 8.0% mgmt
Financing live
Cash to close
- Down payment
- $20,000
- Closing costs
- $2,400
- Reserves months
- —
- Total cash needed
- —
Loan-product check · same deal, 3 products live
Conventional
25% down · 7.5% · 30yr
- Down + closing
- —
- Monthly P&I
- —
- Monthly cashflow
- —
- DSCR
- —
- Eligible?
- —
Personal DTI + credit; lowest rate.
DSCR
20% down · 8.5% · 30yr
- Down + closing
- —
- Monthly P&I
- —
- Monthly cashflow
- —
- DSCR
- —
- Eligible?
- —
No personal income docs; deal must DSCR.
Hard money
10% down · 12.0% · 12mo
- Down + closing
- —
- Monthly P&I
- —
- Monthly cashflow
- —
- DSCR
- —
- Eligible?
- —
Short-term bridge; refi at stabilization.
Rent comps 6 comps
| Address | Beds | Baths | Sqft | Rent | $/sqft | DOM | Units | Dist |
|---|---|---|---|---|---|---|---|---|
| 1895 Courtyard Way #103 Naples, FL | 3.0 | 2.0 | 1046 | $2,200 | $2.10 | 21d | 1 | 1.03mi |
| 1865 Florida Club Dr Naples, FL | 2.0–3.0 | 1.0–2.0 | 1214 | $1,950 | $1.61 | 23d | 2 | 1.04mi |
| 2648 Kings Lake Blvd Unit 6-201 Naples, FL | 3.0 | 2.0 | 1060 | $2,200 | $2.08 | 21d | 1 | 1.14mi |
| 4640 Santa Barbara Blvd Naples, FL | 2.0–3.0 | 2.0 | 1164 | $2,229 | $1.91 | 23d | 2 | 1.34mi |
| 4710 Altis Dr Naples, FL | 1.0–3.0 | 1.0–2.0 | 1101 | $2,885 | $2.62 | 13d | 39 | 1.37mi |
| 7725 Tara Cir Naples, FL | 1.0–3.0 | 1.0–2.0 | 929 | $1,808 | $1.95 | 13d | 1 | 1.49mi |
HOA detail
- Monthly dues
- $188 · $2,256/yr
Listing history 15 events
-
2026-06-18days on market $79,999 Active 20 DOM
-
2026-06-17days on market $79,999 Active 19 DOM
-
2026-06-16days on market $79,999 Active 18 DOM
-
2026-06-15days on market $79,999 Active 17 DOM
-
2026-06-14pricedays on market $79,999 Active 15 DOM
-
2026-06-10pricedays on market $83,999 Active 12 DOM
-
2026-06-09days on market $89,999 Active 11 DOM
-
2026-06-08days on market $89,999 Active 10 DOM
-
2026-06-07pricedays on market $89,999 Active 9 DOM
-
2026-06-03days on market $92,999 Active 5 DOM
-
2026-06-02days on market $92,999 Active 4 DOM
-
2026-06-01days on market $92,999 Active 3 DOM
-
2026-05-31days on market $92,999 Active 2 DOM
-
2026-05-30remarks 295-char remark
-
2026-05-30$92,999 Active 1 DOM
ⓘ Source: listings_history table (triggers on properties + properties_extension) + one-shot
backfill from property_details.listing_events for pre-trigger history.
Tax reassessment forecast FL · Resets to sale price
- Current annual tax
- $1,409 · $117/mo
- Projected year-2 tax
- $1,409 · $117/mo
- Expected delta
- $0/yr ($0/mo · 0.0%)
ⓘ Screening estimate from a state-policy table — verify with the county assessor before closing.
Climate risk First Street
- Flood 6/10 Major FEMA zone X (unshaded) · 51% chance over 30 yrs
- Wildfire 1/10 Low
- Heat 10/10 Extreme 6 d/yr ≥107°F today · 24 d/yr by 30 yrs out
- Wind 10/10 Extreme 99% chance of damaging wind over 30 yrs
- Air quality 2/10 Low 2 unhealthy d/yr today · 2 by 30 yrs out
Nearby sold comps map
Loading sold comps map…
Walkable amenities ~0.75 mi
Loading nearby amenities…
Taxation est. · year 1
- Rental income
- $30,911
- − Mortgage interest
- −$4,481
- − Property taxes
- −$1,409
- − Insurance
- −$400
- − Repairs & maintenance
- −$2,473
- − Management
- −$2,473
- − HOA
- −$2,256
- − Depreciation
- −$2,327
- Taxable income
- $15,092
- Est. tax owed @ 24.0%
- −$3,622
- After-tax cash flow
- $11,698/yr
For passive investors: Depreciation is non-cash, so a rental often shows a tax loss while cash-flowing — sheltering income. Rental losses are passive: they offset passive income freely, and up to $25,000/yr can offset ordinary (W-2) income if you actively participate and your MAGI is under $100k (phasing out to $0 by $150k); unused losses carry forward. On sale, claimed depreciation is recaptured at up to 25%, and gains may owe capital-gains tax (a 1031 exchange can defer both). Figures are a year-1 estimate at your 24.0% rate — not tax advice; consult a CPA.
Schools (NCES district)
- District
- Collier
- NCES district ID
- 1200330
- Math proficiency
- 60% ▼ -4.00%
- Reading proficiency
- 56% ▼ -2.00%
- Median HH income
- $58,275
- Composite
- 50.23/100
- National rank
- #1892
- State rank
- #16 of 73 in FL
Livability — Berkshire Lakes
No livability data for this city. (Only ~50 U.S. cities are tracked.)
Census & demographics
- County
- Collier County · 396,295 people
- Metro
- Naples-Marco Island, FL
- Population (ZIP)
- 26,408
- Household income
- $71,686
- Rent vs Own
- Severe rent burden
- 1423.0
Population outlook (Collier County) Hauer SSP2
- Today (2025)
- 420,858 people
- By 2030
- 450,054 · +6.9%
- By 2040
- 502,232 · +19.3%
- By 2050
- 544,932 · +29.5%
- By 2075
- 627,203 · +49.0%
- By 2100
- 659,015 · +56.6%
Race, ethnicity, and origin ACS 2023
- Neighborhood character
- Majority White (62%)
- Race & ethnicity
- White 62% Hispanic / Latino 30% Two or more races 19% Black 4% Asian 2%
- Hispanic origin (detail)
- Mexican 7% Puerto Rican 3% Cuban 6% Dominican 1%
- Common ancestry
- Lithuanian 6% Romanian 3% Hispanic 2%
- Foreign-born
- 30% · Canada, Jamaica, Dominican Republic
- Languages at home
- 66% English-only · Spanish 24% French/Haitian/Cajun 5% Russian/Polish/Slavic 1%
Political lean MEDSL · Collier
- 2024 margin
- Solid R (+33.1) · D 33.1% · R 66.2%
- 2008→2024 swing
- -10.6pp toward R · 2008: -22.5pp · 2024: -33.1pp
- All cycles
- 2024: R+33.1 2020: R+24.7 2016: R+26.0 2012: R+30.1 2008: R+22.5
Not yet ingested
- Civics
- —
Market trends
- HPI YoY
- ▼ -252.48%
- Current HPI
- 259.3498
- Rent YoY
- ▼ -1.10%
- Metro
- Naples-Marco Island, FL
- State GDP YoY
- ▲ 3.28%
- F500 in state
- 36
Industry mix (Fortune 500 HQ in FL)
| Industry | F500 HQs | Revenue |
|---|---|---|
| Industrial Technology | 2 | $29B |
|
||
| Insurance | 2 | $17B |
|
||
| Retail | 1 | $60B |
|
||
| Technology Distribution | 1 | $58B |
|
||
| Homebuilding | 1 | $35B |
|
||
| Technology Manufacturing | 1 | $35B |
|
||
Price history
+244.4% since first listed4 events — show timeline
- 2026-05-29 Listed $92,999 NAPLESMLS
- 2005-09-22 Sold (Public Records) $66,000 Public Records
- 2003-05-02 Sold (Public Records) $44,000 Public Records
- 1997-04-21 Sold (Public Records) $27,000 Public Records
Property tax history
+9.6%/yrLatest (2025): $1,409 · +6.1% YoY. Source: county tax records.
Cash-flow waterfall
monthlySold comps — $/sqft
last 12 mo · ≤1 miLoading sold comps…