27551 S Solis Rd · Solis, TX
Flood risk 1/10 · Minimal
- FEMA flood zone
- X (unshaded)
- Chance of flooding over 30 yrs
- 0.0%
- Est. flood insurance / yr
- $507 – $1,088
Fire risk 3/10 · Minor
- Est. fire insurance / yr
- $1,222 – $2,270
Heat risk 9/10 · Severe
- Hot days now (above 111°F)
- 7 days/yr
- Hot days in 30 yrs
- 23 days/yr
Wind risk 9/10 · Severe
- Chance of severe wind over 30 yrs
- 99.0%
Air-quality risk 1/10 · Minimal
- Unhealthy air days now
- 0 days/yr
- Unhealthy air days in 30 yrs
- 0 days/yr
Risk factors via First Street. Map © Google.
Why this score? — see what drove the D- grade
The composite is a weighted blend of 9 inputs, each scored 0–100. Each bar is that input's sub-score; the figure is the points it added to the 100-point composite (weight × sub-score).
- ARV discount +15.0/15.0
- Cash flow +9.5/30.0
- 1% rule +3.0/10.0
- DSCR +2.7/10.0
- Rent growth +2.5/5.0
- Schools +2.5/10.0
- Condition / age +2.5/5.0
- Livability +2.0/5.0
- Appreciation +0.0/10.0
$138,000
🖨 Deal sheet 📄 Offer letter ✓ Due diligence
Listing remarks
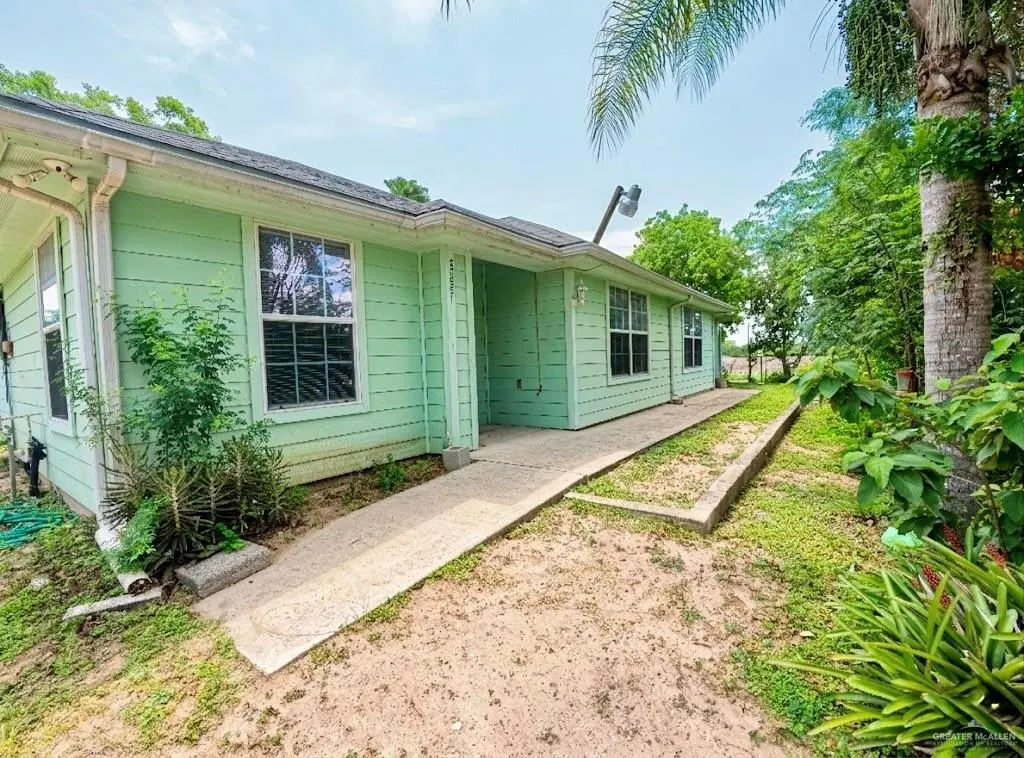
This versatile 2-bedroom, 2-bathroom residence offers a rare and functional layout designed for maximum flexibility. The interior features two complete kitchens, two spacious living areas, and two separate laundry zones, essentially providing two independent living suites under one roof. With two private main entrances already in place, the property is perfectly configured for multi-generational living or a seamless conversion into a duplex. While utilities are currently on a single meter, the home is masterfully laid out to allow for the easy addition of a second meter to separate services. Whether you are looking for a primary residence with an independent guest wing, a "house-hack&q
Key facts
- 5,200 sq ft lot
- Built 2008
- Listed 37 days
Tags
Property features AI
Finance
- HOA & community: No association
Exterior
- Parking: No garage or carport; no covered parking
- Utilities: Public water; City sewer; Electric water heater
- Home design: Frame/wood construction with siding; Shingle roof; Slab foundation
- Construction: Frame/wood siding construction; Shingle roof; Slab foundation
- Exterior features: Chain link fencing; Mature trees; Storage structure on property; Paved road access
Interior
- Kitchen: Gas stove/range; Electric water heater
- Flooring: Tile
- Bathrooms: 2 full bathrooms
- Heating & cooling: Central heating; Central air conditioning
- Interior features: Tile flooring; Countertops: other; No window coverings; Two living areas
- Laundry & utility: Laundry closet
Neighborhood map
What this means for you Summary
Snapshot
- This is a 2-bed/2.0-bath single-family listed at $138k.
Deal economics
- At list price, monthly cash flow is $-95 ($-1k/yr) — negative.
- To cash-flow at today's rent, offer at most $121k (12.2% below list).
- To meet the 1% rule (rent ≥ 1% of price), the offer needs to be $111k (19.9% below list).
- Recommended offer: $111k (19.9% below list) — sets the bar for 1% rule.
Location & tenants
- Location reads 40/100 on livability (#1,602 in TX) — a working-class tenant base; expect higher turnover. Strengths: cost of living A+, crime A; Watch: amenities F, commute F, employment F.
- La Feria ISD (suburban): math 27% / reading 35% proficiency, ranked #630 of 826 in TX (top 76%) — families likely to look elsewhere, expect single-tenant / working-renter base with shorter leases.
- Zoned schools: W B Green J H (math 24% / reading 35%, grade F, #1,077 of 1,662 statewide, top 66%, 454 students, 85% FRL); La Feria H S (math 32% / reading 52%, grade F, #730 of 1,632 statewide, top 47%, 909 students, 85% FRL) — zoned schools average 85% FRL vs 50% district-wide (35 pts higher); higher-poverty schools than district average — tighter screening recommended.
- Market conditions: 260 active listings in the ZIP; 15 comparable units currently listed for rent nearby; rentals at typical pace (median 21d on market — plan ~3-4 weeks tenant-placement turnaround); 47% of comp listings sitting > 30 days — soft ceiling on asking rent; 2,326 units permitted in Cameron County in 2024 (503 in 5+ unit buildings).
Forward outlook
- Local home prices are declining (-3.0%/yr); year-one equity from $954 of loan paydown is wiped out by about $4k of value loss. Plan a longer hold.
- Cameron County population projected at +3% by 2050 — modest demand growth; plan on rents tracking national, not racing it.
Negotiation context
- It's been on market 37 days — a 3% lower offer ($134k) is reasonable based on typical stale-listing flexibility.
Risks & watch-outs
- Climate carrying-cost: severe wind risk, 99% chance of damaging wind over 30y; extreme-heat days projected 7→23/yr by 2055 (HVAC capex compounding) — expect insurance premiums to compound above CPI over the hold.
Questions for the listing agent
- What do current leases actually rent for vs. the listed asking? Can we see a recent rent roll and the last 12 months of T-12 income?
- It's been on market 37 days. Have you received any prior offers? Is the seller open to a 20% concession, seller financing, or rate buy-down credit?
- Is there a deadline driving the sale (1031 exchange, divorce, estate, relocation)? That informs how much negotiation room exists.
- Schools are F-rated, which usually means shorter tenancies and higher turnover. Who's the typical renter profile here, and what's been the actual vacancy rate?
- The area grade is low — what's the realistic commute time and amenity access for the typical tenant pool here? Any planned neighborhood developments (good or bad) we should know about?
- What's the average days-on-market for RENTAL listings here right now (not sales)? A rising rental-DOM trend means longer vacancies and softer asking-rent achievability than the comps imply.
- What's the recent tenant-quality profile in this submarket — average credit score on applications, eviction rate, late-payment / NSF rate, and stable-employment percentage? A property-management company in the area should have these aggregated.
- How much new for-sale + rental construction is in the pipeline within 1–3 miles? Heavy new supply typically softens prices + rents 12–24 months out; constrained supply supports both.
Investment metrics
- 1% rule
- 0.80% ✗
- Cap rate
- 5.46%
- Cash-on-cash
- -2.96%
- DSCR
- 0.87
- GRM
- 10.4
CMA / ARV
- ARV (median comp)
- $246,967
- List price
- $138,000
- Delta
- -44.12%
- Verdict
- UNDERPRICED
- Comps
- 6 within 1.0 mi
Projected returns pro-forma
-3.0% appreciation · 3.0% rent growth · sell at horizon
- IRR
- -21.2%
- Equity multiple
- 0.26×
- Total profit
- $-28,408
- Equity at exit
- $20,576
- IRR
- -14.7%
- Equity multiple
- 0.16×
- Total profit
- $-32,451
- Equity at exit
- $11,932
Cash invested: $38,640 (down + closing). Projections, not guarantees.
Landlord ↔ Tenant lean methodology
- Overall (STATE)
- 87 Strongly Landlord-Friendly
- State Texas
- 87 Strongly Landlord-Friendly · R+5
- County
- — inherits STATE
- City
- — inherits STATE
ZIP-level market 78559
- Home prices YoY
- -6.1%
- Active inventory
- 260
- Price-to-rent
- 10.4×
Monthly cashflow live
- Estimated rent
- $1,106 high interval (Pro) →
- Mortgage (P&I)
- −$724
- Tax from tax record
- −$188 /mo · $2,255/yr
- Insurance
- −$58
- HOA
- −$0
- Vacancy / Maint / Mgmt
- −$232
- Net cashflow
- $-95
Break-even live
UW: 25.0% down · 7.5% · 30yr · 1.5% tax · 5.0% vac · 8.0% maint · 8.0% mgmt
Financing live
Cash to close
- Down payment
- $34,500
- Closing costs
- $4,140
- Reserves months
- —
- Total cash needed
- —
Loan-product check · same deal, 3 products live
Conventional
25% down · 7.5% · 30yr
- Down + closing
- —
- Monthly P&I
- —
- Monthly cashflow
- —
- DSCR
- —
- Eligible?
- —
Personal DTI + credit; lowest rate.
DSCR
20% down · 8.5% · 30yr
- Down + closing
- —
- Monthly P&I
- —
- Monthly cashflow
- —
- DSCR
- —
- Eligible?
- —
No personal income docs; deal must DSCR.
Hard money
10% down · 12.0% · 12mo
- Down + closing
- —
- Monthly P&I
- —
- Monthly cashflow
- —
- DSCR
- —
- Eligible?
- —
Short-term bridge; refi at stabilization.
Rent comps 15 comps
| Address | Beds | Baths | Sqft | Rent | $/sqft | DOM | Units | Dist |
|---|---|---|---|---|---|---|---|---|
| 910 S Palmera Dr La Feria, TX | 2.0 | 2.0 | 1480 | $950 | $0.64 | 13d | 1 | 0.72mi |
| 508 6th St Unit A La Feria, TX | 2.0 | 2.0 | 926 | $1,000 | $1.08 | 21d | 1 | 1.03mi |
| 2225 S Valley Cir Unit B La Feria, TX | 3.0 | 2.0 | 980 | $1,225 | $1.25 | 43d | 1 | 1.14mi |
| 2328 S Valley Cir Unit A La Feria, TX | 2.0 | 2.0 | 954 | $1,100 | $1.15 | 43d | 1 | 1.15mi |
| 2432 S Valley Cir Unit B La Feria, TX | 3.0 | 2.0 | 1149 | $1,275 | $1.11 | 43d | 1 | 1.15mi |
| 2114 E Valley Cir Unit B La Feria, TX | 2.0 | 2.0 | 954 | $1,100 | $1.15 | 13d | 1 | 1.16mi |
| 2332 S Valley Cir Unit A La Feria, TX | 2.0 | 2.0 | 954 | $1,000 | $1.05 | 13d | 1 | 1.17mi |
| 2429 Summit Rd Unit B La Feria, TX | 2.0 | 2.0 | 965 | $1,150 | $1.19 | 21d | 1 | 1.19mi |
| 405 Lion's Villa Ave Unit 15 La Feria, TX | 2.0 | 1.5 | 992 | $999 | $1.01 | 13d | 1 | 1.21mi |
| 2228 N Valley Cir Unit A La Feria, TX | 3.0 | 2.0 | 980 | $1,225 | $1.25 | 13d | 1 | 1.25mi |
| 2226 N Valley Cir Unit B La Feria, TX | 3.0 | 2.0 | 980 | $1,225 | $1.25 | 43d | 1 | 1.25mi |
| 2326 N Valley Cir Unit B La Feria, TX | 3.0 | 2.0 | 980 | $1,225 | $1.25 | 43d | 1 | 1.25mi |
| 2526 N Valley Cir Unit A La Feria, TX | 2.0 | 2.0 | 786 | $1,125 | $1.43 | 43d | 1 | 1.25mi |
| 300 Cub Cir Unit 2 La Feria, TX | 2.0 | 1.5 | 966 | $1,050 | $1.09 | 43d | 1 | 1.38mi |
| 200 Cub Cir La Feria, TX | 2.0 | 1.5 | 966 | $1,024 | $1.06 | 13d | 1 | 1.41mi |
Listing history 18 events
-
2026-06-18days on market $138,000 Active 37 DOM
-
2026-06-17days on market $138,000 Active 36 DOM
-
2026-06-16days on market $138,000 Active 35 DOM
-
2026-06-15days on market $138,000 Active 34 DOM
-
2026-06-14days on market $138,000 Active 32 DOM
-
2026-06-13days on market $138,000 Active 31 DOM
-
2026-06-10pricedays on market $138,000 Active 29 DOM
-
2026-06-09days on market $148,000 Active 28 DOM
-
2026-06-08days on market $148,000 Active 27 DOM
-
2026-06-07days on market $148,000 Active 26 DOM
-
2026-06-03days on market $148,000 Active 22 DOM
-
2026-06-02days on market $148,000 Active 21 DOM
-
2026-06-01days on market $148,000 Active 20 DOM
-
2026-05-31days on market $148,000 Active 19 DOM
-
2026-05-30days on market $148,000 Active 18 DOM
-
2026-05-12$148,000 Active 923-char remark
-
2026-03-05soldstatus
-
2026-03-05soldstatus
ⓘ Source: listings_history table (triggers on properties + properties_extension) + one-shot
backfill from property_details.listing_events for pre-trigger history.
Tax reassessment forecast TX · Resets to sale price
- Current annual tax
- $2,255 · $188/mo
- Projected year-2 tax
- $2,525 · $210/mo
- Expected delta
- +$271/yr (+$23/mo · 12.0%)
ⓘ Screening estimate from a state-policy table — verify with the county assessor before closing.
Climate risk First Street
- Flood 1/10 Low FEMA zone X (unshaded) · 0% chance over 30 yrs
- Wildfire 3/10 Moderate
- Heat 9/10 Extreme 7 d/yr ≥111°F today · 23 d/yr by 30 yrs out
- Wind 9/10 Extreme 99% chance of damaging wind over 30 yrs
- Air quality 1/10 Low 0 unhealthy d/yr today · 0 by 30 yrs out
Nearby sold comps map
Loading sold comps map…
Walkable amenities ~0.75 mi
Loading nearby amenities…
Taxation est. · year 1
- Rental income
- $13,272
- − Mortgage interest
- −$7,730
- − Property taxes
- −$2,255
- − Insurance
- −$690
- − Repairs & maintenance
- −$1,062
- − Management
- −$1,062
- − Depreciation
- −$4,015
- Taxable loss
- −$3,541
- Est. tax savings @ 24.0%
- +$850
- After-tax cash flow
- $-294/yr
For passive investors: Depreciation is non-cash, so a rental often shows a tax loss while cash-flowing — sheltering income. Rental losses are passive: they offset passive income freely, and up to $25,000/yr can offset ordinary (W-2) income if you actively participate and your MAGI is under $100k (phasing out to $0 by $150k); unused losses carry forward. On sale, claimed depreciation is recaptured at up to 25%, and gains may owe capital-gains tax (a 1031 exchange can defer both). Figures are a year-1 estimate at your 24.0% rate — not tax advice; consult a CPA.
Schools (NCES district)
- District
- La Feria ISD
- NCES district ID
- 4826040
- Math proficiency
- 27% ▼ -25.00%
- Reading proficiency
- 35% ▼ -4.00%
- Median HH income
- $33,306
- Composite
- 25.41/100
- National rank
- #7460
- State rank
- #630 of 826 in TX
Livability — Solis
- Score
- 40/100
- State rank
- #1602
- US rank
- #27244
Category grades
Schools grade is shown separately in the Schools card above.
Census & demographics
- Census place
- Solis, TX
- Population (ZIP)
- 12,752
Population outlook (Cameron County) Hauer SSP2
- Today (2025)
- 441,603 people
- By 2030
- 448,113 · +1.5%
- By 2040
- 456,385 · +3.3%
- By 2050
- 456,294 · +3.3%
- By 2075
- 423,851 · -4.0%
- By 2100
- 342,787 · -22.4%
Race, ethnicity, and origin ACS 2023
- Neighborhood character
- Predominantly Hispanic (91%)
- Race & ethnicity
- Hispanic / Latino 91% Two or more races 35% White 8%
- Hispanic origin (detail)
- Mexican 87%
- Common ancestry
- Slovak 1% Lithuanian 1%
- Foreign-born
- 17% · Canada
- Languages at home
- 40% English-only · Spanish 60%
Political lean MEDSL · Cameron
- 2024 margin
- Lean R (+5.8) · D 46.7% · R 52.5%
- 2008→2024 swing
- -34.6pp toward R · 2008: 28.8pp · 2024: -5.8pp
- All cycles
- 2024: R+5.8 2020: D+13.2 2016: D+32.5 2012: D+32.4 2008: D+28.8
Not yet ingested
- Civics
- —
Market trends
- HPI YoY
- ▼ -12.21%
- Current HPI
- 187.8512
- Rent YoY
- —
- Metro
- —
- State GDP YoY
- ▲ 3.95%
- F500 in state
- 110
Industry mix (Fortune 500 HQ in TX)
| Industry | F500 HQs | Revenue |
|---|---|---|
| Energy | 16 | $1,198B |
|
||
| Technology | 5 | $198B |
|
||
| Engineering / Construction | 4 | $72B |
|
||
| Energy Services | 3 | $60B |
|
||
| Utilities | 3 | $41B |
|
||
| Healthcare | 2 | $330B |
|
||
Price history
-6.8% since first listed4 events — show timeline
- 2026-06-09 Price Changed $138,000 MCALLENMLS
- 2026-05-12 Listed $148,000 MCALLENMLS
- 2026-03-05 Sold (Public Records) — Public Records
- 2026-03-05 Sold (Public Records) — Public Records
Property tax history
+9.6%/yrLatest (2025): $2,255 · +2.1% YoY. Source: county tax records.
Cash-flow waterfall
monthlySold comps — $/sqft
last 12 mo · ≤1 miLoading sold comps…