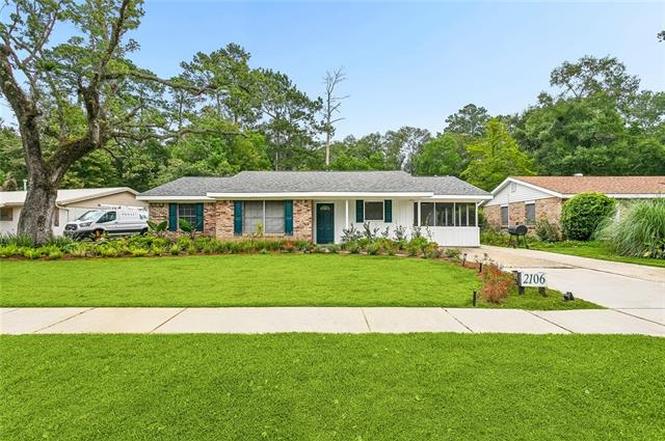
2106 Park Dr · Slidell, LA
Flood risk No data
- FEMA flood zone
- —
- Chance of flooding over 30 yrs
- —
- Est. flood insurance / yr
- —
Fire risk No data
- Est. fire insurance / yr
- —
Heat risk No data
- Hot days now (above threshold)
- —
- Hot days in 30 yrs
- —
Wind risk No data
- Chance of severe wind over 30 yrs
- —
Air-quality risk No data
- Unhealthy air days now
- —
- Unhealthy air days in 30 yrs
- —
Risk factors via First Street. Map © Google.
Why this score? — see what drove the C+ grade
The composite is a weighted blend of 9 inputs, each scored 0–100. Each bar is that input's sub-score; the figure is the points it added to the 100-point composite (weight × sub-score).
- Cash flow +23.0/30.0
- ARV discount +15.0/15.0
- DSCR +7.4/10.0
- 1% rule +4.8/10.0
- Schools +4.3/10.0
- Livability +3.5/5.0
- Rent growth +2.9/5.0
- Condition / age +2.5/5.0
- Appreciation +0.0/10.0
$165,000
🖨 Deal sheet 📄 Offer letter ✓ Due diligence
Listing remarks MLS
Completely updated brick ranch with incredible curb appeal! This move-in ready home received a full renovation last year including a new roof, new AC system, new LVP flooring, fresh interior paint, updated kitchen cabinets with stone countertops, and stainless steel appliances. The open living and dining areas are bright and inviting, while the updated bathrooms feature clean modern finishes throughout. Enjoy the oversized screened-in porch, a massive backyard with storage shed, and jaw-dropping front yard landscaping that truly sets this home apart. Nothing left to do but move in!
Key facts
- Stone countertops
- Massive backyard
- Storage shed
Tags
Property features AI
Exterior
- Parking: Driveway
- Utilities: Public water; Public sewer
- Home design: Single-story home
- Construction: Brick construction; Shingle roof; Slab foundation; Property in excellent condition
- Exterior features: Covered patio/porch; City lot with rectangular shape
Interior
- Kitchen: Dishwasher; Microwave; Oven; Range; Refrigerator
- Bedrooms: Total rooms: 5 (includes bedrooms and living spaces)
- Bathrooms: 2 full bathrooms
- Heating & cooling: Central heating; Central air conditioning
- Interior features: Ceiling fans; Stone counters; Stainless steel appliances
Neighborhood map
What this means for you Summary
Snapshot
- This is a 3-bed/2.0-bath single-family listed at $165k.
Deal economics
- At list price, monthly cash flow is $294 ($4k/yr) — positive.
- The deal already cash-flows at list — no discount required.
- To meet the 1% rule (rent ≥ 1% of price), the offer needs to be $162k (1.8% below list).
- Recommended offer: $162k (1.8% below list) — sets the bar for 1% rule.
- Cap rate 8.4% vs local median 5.9% in Slidell — top-decile yield for the area; either an underpriced asset or a hidden risk that comps aren't pricing in. Stress-test before assuming the spread holds.
Location & tenants
- Location reads 70/100 on livability (#57 in LA) — a middle-class / working-renter tenant base. Strengths: cost of living A+, housing A+, health & safety A+; Watch: amenities F, commute F.
- St. Tammany Parish (suburban): math 43% / reading 55% proficiency, ranked #11 of 98 in LA (top 11%) — families likely to look elsewhere, expect single-tenant / working-renter base with shorter leases.
- Market conditions: Rents rising (+1.5%/yr); 489 active listings in the ZIP; 34 comparable units currently listed for rent nearby; rentals at typical pace (median 24d on market — plan ~3-4 weeks tenant-placement turnaround); 1,064 units permitted in St. Tammany Parish in 2024 (0 in 5+ unit buildings).
Forward outlook
- Local home prices are declining (-3.0%/yr); year-one equity from $1k of loan paydown is wiped out by about $5k of value loss. Plan a longer hold.
- St. Tammany County population projected at +27% by 2050 — long-run rental-demand tailwind backs the buy-and-hold thesis.
Negotiation context
- Only 2 days on market — expect competitive offers; lowballing is unlikely to land.
- 6 sale attempts since 23y ago with the ask held roughly flat each time — persistent listings suggest the price (not the market) is what's stuck; bring a comps-based counter.
- Current owner paid $121k; 36% above their basis — modest negotiation headroom, anchor on the comps not their cost.
Questions for the listing agent
- Built in 1963 — when were the roof, HVAC, electrical panel, plumbing, and water heater last replaced?
- Is there a deadline driving the sale (1031 exchange, divorce, estate, relocation)? That informs how much negotiation room exists.
- Schools are B-rated — typically a magnet for longer-tenancy family renters. What's the average tenant stay here, and is there a school-zone premium baked into asking?
- What's the average days-on-market for RENTAL listings here right now (not sales)? A rising rental-DOM trend means longer vacancies and softer asking-rent achievability than the comps imply.
- What's the recent tenant-quality profile in this submarket — average credit score on applications, eviction rate, late-payment / NSF rate, and stable-employment percentage? A property-management company in the area should have these aggregated.
- How much new for-sale + rental construction is in the pipeline within 1–3 miles? Heavy new supply typically softens prices + rents 12–24 months out; constrained supply supports both.
Investment metrics
- 1% rule
- 0.98% ✗
- Cap rate
- 8.43%
- Cash-on-cash
- 7.62%
- DSCR
- 1.34
- GRM
- 8.5
CMA / ARV
- ARV (on-the-fly)
- $208,800
- Comps found
- 12
Show comp detail 12 sales within ~0.75 mi
| Address | Dist | Beds/Ba | Sqft | Sold | Price | $/sf | Match |
|---|---|---|---|---|---|---|---|
| 1207 Cousin St | 0.04mi | 3/2.0 | 1,525 (+10%) | 3mo | $200,000 | $131 | 80 |
| 2708 Lincoln Ave | 0.47mi | 3/2.0 | 1,394 (+0%) | 5mo | $69,900 | $50 | 73 |
| 5453 Fornea Glen Way | 0.57mi | 3/2.0 | 1,405 (+1%) | 3mo | $237,990 | $169 | 69 |
| 1593 Eastridge Dr | 0.46mi | 3/2.0 | 1,459 (+5%) | 4mo | $144,900 | $99 | 67 |
| 1706 Mary Dr | 0.75mi | 3/2.0 | 1,406 (+1%) | 2mo | $227,000 | $161 | 62 |
| 1764 Mary Dr | 0.71mi | 3/2.0 | 1,465 (+5%) | 0mo | $240,000 | $164 | 58 |
| 3004 Terrace Ave | 0.57mi | 4/2.0 (+1) | 1,306 (-6%) | 2mo | $167,500 | $128 | 57 |
| 1951 Beth Dr | 0.56mi | 3/2.0 | 1,227 (-12%) | 0mo | $192,500 | $157 | 54 |
| 1744 Nellie Dr | 0.67mi | 3/2.0 | 1,260 (-10%) | 6mo | $212,000 | $168 | 48 |
| 1216 Tupelo St | 0.75mi | 3/1.0 | 1,264 (-9%) | 6mo | $130,000 | $103 | 41 |
| 2651 2nd St | 0.68mi | 3/2.0 | 1,184 (-15%) | 4mo | $175,000 | $148 | 40 |
| 1553 Susan Ln | 0.70mi | 2/2.0 (-1) | 1,201 (-14%) | 4mo | $180,000 | $150 | 36 |
Match score weights: distance 35% · size 25% · config 20% · recency 20%. Top-matched comps best support the ARV.
Projected returns pro-forma
-3.0% appreciation · 1.47% rent growth · sell at horizon
- IRR
- -6.3%
- Equity multiple
- 0.77×
- Total profit
- $-10,568
- Equity at exit
- $24,602
- IRR
- 1.6%
- Equity multiple
- 1.10×
- Total profit
- $4,808
- Equity at exit
- $14,266
Cash invested: $46,200 (down + closing). Projections, not guarantees.
Landlord ↔ Tenant lean methodology
- Overall (STATE)
- 90 Strongly Landlord-Friendly
- State Louisiana
- 90 Strongly Landlord-Friendly · R+12
- County
- — inherits STATE
- City
- — inherits STATE
ZIP-level market 70458
- Rents YoY
- 1.5%
- Active inventory
- 489
- Price-to-rent
- 8.5×
Monthly cashflow live
- Estimated rent
- $1,621 high interval (Pro) →
- Mortgage (P&I)
- −$865
- Tax from tax record
- −$53 /mo · $637/yr
- Insurance
- −$69
- HOA
- −$0
- Vacancy / Maint / Mgmt
- −$340
- Net cashflow
- $294
Break-even live
UW: 25.0% down · 7.5% · 30yr · 1.5% tax · 5.0% vac · 8.0% maint · 8.0% mgmt
Financing live
Cash to close
- Down payment
- $41,250
- Closing costs
- $4,950
- Reserves months
- —
- Total cash needed
- —
Loan-product check · same deal, 3 products live
Conventional
25% down · 7.5% · 30yr
- Down + closing
- —
- Monthly P&I
- —
- Monthly cashflow
- —
- DSCR
- —
- Eligible?
- —
Personal DTI + credit; lowest rate.
DSCR
20% down · 8.5% · 30yr
- Down + closing
- —
- Monthly P&I
- —
- Monthly cashflow
- —
- DSCR
- —
- Eligible?
- —
No personal income docs; deal must DSCR.
Hard money
10% down · 12.0% · 12mo
- Down + closing
- —
- Monthly P&I
- —
- Monthly cashflow
- —
- DSCR
- —
- Eligible?
- —
Short-term bridge; refi at stabilization.
Rent comps 34 comps
| Address | Beds | Baths | Sqft | Rent | $/sqft | DOM | Units | Dist |
|---|---|---|---|---|---|---|---|---|
| 2001 Tenth St Unit B Slidell, LA | 3.0 | 2.0 | 1137 | $1,550 | $1.36 | 17d | 1 | 0.19mi |
| 2004 5th St Unit A Slidell, LA | 2.0 | 1.0 | 900 | $1,250 | $1.39 | 23d | 1 | 0.37mi |
| 517 Erlanger Ave Unit A Slidell, LA | 3.0 | 2.0 | 1134 | $1,375 | $1.21 | 14d | 1 | 0.44mi |
| 517 Erlanger Ave Unit A Slidell, LA | 3.0 | 2.0 | 1134 | $1,400 | $1.23 | 43d | 1 | 0.44mi |
| 516 Erlanger Ave Slidell, LA | 2.0 | 2.0 | 1250 | $1,750 | $1.40 | 43d | 1 | 0.46mi |
| 513 Michigan Ave Slidell, LA | 3.0 | 2.0 | 1250 | $1,575 | $1.26 | 23d | 1 | 0.57mi |
| 2009 Beth Dr Slidell, LA | 3.0 | 2.0 | 1500 | $1,750 | $1.17 | 3d | 1 | 0.59mi |
| 1540 Wildwood Ln Slidell, LA | 3.0 | 2.0 | 1525 | $2,200 | $1.44 | 23d | 1 | 0.67mi |
| 1733 Mary Dr Slidell, LA | 3.0 | 2.0 | 1349 | $1,650 | $1.22 | 43d | 1 | 0.70mi |
| 1731 Mary Dr Slidell, LA | 3.0 | 2.0 | 1200 | $1,650 | $1.38 | 3d | 1 | 0.70mi |
| 1466 Florida Ave Slidell, LA | 3.0 | 2.0 | 1456 | $2,200 | $1.51 | 43d | 1 | 0.81mi |
| 48 Chamale Cv E Slidell, LA | 2.0 | 2.0 | 1432 | $1,650 | $1.15 | 43d | 1 | 0.85mi |
| 1303 Town Center Pkwy Slidell, LA | 3.0 | 1.0–2.0 | 990 | $1,825 | $1.84 | 1d | 31 | 0.88mi |
| 96 Chamale Cv Slidell, LA | 3.0 | 2.5 | 1432 | $1,500 | $1.05 | 43d | 1 | 0.96mi |
| 96 Chamale Cv Slidell, LA | 2.0 | 2.5 | 1432 | $1,500 | $1.05 | 23d | 1 | 0.96mi |
| 2864 Slidell Ave Slidell, LA | 3.0 | 1.0 | 963 | $1,395 | $1.45 | 3d | 1 | 0.99mi |
| 901 Old Spanish Trl Slidell, LA | 2.0 | 1.5 | 1070 | $1,120 | $1.05 | 11d | 1 | 1.05mi |
| 3046 Slidell Ave Slidell, LA | 4.0 | 1.0 | 1253 | $1,850 | $1.48 | 3d | 1 | 1.08mi |
| 3159 Dee St Slidell, LA | 3.0 | 1.0 | 898 | $1,400 | $1.56 | 43d | 1 | 1.09mi |
| 57376 Beech Ave Slidell, LA | 2.0 | 1.5 | 1000 | $1,350 | $1.35 | 17d | 1 | 1.20mi |
| 57376 Beech Ave Slidell, LA | 2.0 | 1.5 | 1004 | $1,350 | $1.34 | 14d | 1 | 1.20mi |
| 3152 College St Slidell, LA | 3.0 | 1.0 | 1373 | $1,750 | $1.27 | 43d | 1 | 1.28mi |
| 1640 Town Center Pkwy Slidell, LA | 3.0 | 1.0–2.0 | 959 | $1,895 | $1.98 | 1d | 46 | 1.29mi |
| 943 N Magnolia St Slidell, LA | 2.0 | 2.0 | 900 | $1,000 | $1.11 | 3d | 1 | 1.33mi |
| 57346 Maple Ave Slidell, LA | 3.0 | 2.5 | 1550 | $1,500 | $0.97 | 43d | 1 | 1.36mi |
| 57389 Brookter Rd Slidell, LA | 2.0 | 1.0 | 971 | $1,200 | $1.24 | 19d | 1 | 1.39mi |
| 221 Martin Ln Slidell, LA | 3.0 | 1.5 | 1353 | $1,800 | $1.33 | 23d | 1 | 1.39mi |
| 908 Asheville Dr Slidell, LA | 2.0 | 1.0 | 1000 | $1,350 | $1.35 | 10d | 1 | 1.39mi |
| 221 Bella Sera Ln Slidell, LA | 3.0 | 2.0 | 1028 | $1,525 | $1.48 | 11d | 1 | 1.39mi |
| 932 Asheville Dr Slidell, LA | 2.0 | 1.5 | 1220 | $1,225 | $1.00 | 3d | 1 | 1.40mi |
| 3304 Bridge Dr Slidell, LA | 3.0 | 2.0 | 1250 | $1,700 | $1.36 | 43d | 1 | 1.41mi |
| 128 Foxbriar Ct Slidell, LA | 3.0 | 2.0 | 1395 | $1,650 | $1.18 | 43d | 1 | 1.44mi |
| 816 Rue Rochelle Slidell, LA | 2.0 | 1.5 | 1500 | $1,200 | $0.80 | 43d | 1 | 1.47mi |
| 1500 Richmond Dr Slidell, LA | 2.0 | 2.0 | 1137 | $1,250 | $1.10 | 2d | 1 | 1.48mi |
Listing history 3 events
-
2026-06-18days on market $165,000 Active 2 DOM
-
2026-06-16remarks 588-char remark
Show marketing remark (588 chars)
Completely updated brick ranch with incredible curb appeal! This move-in ready home received a full renovation last year including a new roof, new AC system, new LVP flooring, fresh interior paint, updated kitchen cabinets with stone countertops, and stainless steel appliances. The open living and dining areas are bright and inviting, while the updated bathrooms feature clean modern finishes throughout. Enjoy the oversized screened-in porch, a massive backyard with storage shed, and jaw-dropping front yard landscaping that truly sets this home apart. Nothing left to do but move in!
-
2026-06-16$165,000 Active 1 DOM
Show marketing remark (588 chars)
Completely updated brick ranch with incredible curb appeal! This move-in ready home received a full renovation last year including a new roof, new AC system, new LVP flooring, fresh interior paint, updated kitchen cabinets with stone countertops, and stainless steel appliances. The open living and dining areas are bright and inviting, while the updated bathrooms feature clean modern finishes throughout. Enjoy the oversized screened-in porch, a massive backyard with storage shed, and jaw-dropping front yard landscaping that truly sets this home apart. Nothing left to do but move in!
ⓘ Source: listings_history table (triggers on properties + properties_extension) + one-shot
backfill from property_details.listing_events for pre-trigger history.
Tax reassessment forecast LA · Resets to sale price
- Current annual tax
- $637 · $53/mo
- Projected year-2 tax
- $908 · $76/mo
- Expected delta
- +$270/yr (+$23/mo · 42.4%)
ⓘ Screening estimate from a state-policy table — verify with the county assessor before closing.
Nearby sold comps map
Loading sold comps map…
Walkable amenities ~0.75 mi
Loading nearby amenities…
Taxation est. · year 1
- Rental income
- $19,453
- − Mortgage interest
- −$9,243
- − Property taxes
- −$637
- − Insurance
- −$825
- − Repairs & maintenance
- −$1,556
- − Management
- −$1,556
- − Depreciation
- −$4,800
- Taxable income
- $836
- Est. tax owed @ 24.0%
- −$201
- After-tax cash flow
- $3,322/yr
For passive investors: Depreciation is non-cash, so a rental often shows a tax loss while cash-flowing — sheltering income. Rental losses are passive: they offset passive income freely, and up to $25,000/yr can offset ordinary (W-2) income if you actively participate and your MAGI is under $100k (phasing out to $0 by $150k); unused losses carry forward. On sale, claimed depreciation is recaptured at up to 25%, and gains may owe capital-gains tax (a 1031 exchange can defer both). Figures are a year-1 estimate at your 24.0% rate — not tax advice; consult a CPA.
Schools (NCES district)
- District
- St. Tammany Parish
- NCES district ID
- 2201650
- Math proficiency
- 43% ▼ -32.00%
- Reading proficiency
- 55% ▼ -26.00%
- Median HH income
- $61,752
- Composite
- 43.04/100
- National rank
- #3098
- State rank
- #11 of 98 in LA
Livability — Slidell
- Score
- 70/100
- State rank
- #57
- US rank
- #7673
Category grades
Schools grade is shown separately in the Schools card above.
Census & demographics
- Census place
- Slidell, LA
- County
- Saint Tammany Parish · 228,296 people
- City population
- 95,511
- Metro
- New Orleans-Metairie, LA
- Population (ZIP)
- 39,034
- Household income
- $72,843
- Rent vs Own
- Severe rent burden
- 1331.0
Population outlook (St. Tammany County) Hauer SSP2
- Today (2025)
- 286,725 people
- By 2030
- 304,175 · +6.1%
- By 2040
- 336,203 · +17.3%
- By 2050
- 364,590 · +27.2%
- By 2075
- 433,362 · +51.1%
- By 2100
- 470,333 · +64.0%
Race, ethnicity, and origin ACS 2023
- Neighborhood character
- Predominantly White (66%)
- Race & ethnicity
- White 66% Black 17% Two or more races 10% Hispanic / Latino 9% Native American 2% Asian 1%
- Hispanic origin (detail)
- Mexican 3% Puerto Rican 1%
- Common ancestry
- Lithuanian 15% Slovak 2% Romanian 1%
- Foreign-born
- 3% · Canada, Vietnam
- Languages at home
- 93% English-only · Spanish 5% Vietnamese 1%
Political lean MEDSL · St. Tammany
- 2024 margin
- Solid R (+43.8) · D 27.3% · R 71.1% · Other 1.6%
- 2008→2024 swing
- +9.6pp toward D · 2008: -53.4pp · 2024: -43.8pp
- All cycles
- 2024: R+43.8 2020: R+44.2 2016: R+50.8 2012: R+52.2 2008: R+53.4
Not yet ingested
- Civics
- —
Market trends
- HPI YoY
- ▼ -173.60%
- Current HPI
- 147.4749
- Rent YoY
- ▲ 1.47%
- Metro
- New Orleans-Metairie, LA
- State GDP YoY
- ▲ 3.29%
- F500 in state
- 10
Industry mix (Fortune 500 HQ in LA)
| Industry | F500 HQs | Revenue |
|---|---|---|
| Telecommunications | 2 | $23B |
|
||
| Utilities | 1 | $12B |
|
||
| Wholesale / Distribution | 1 | $5B |
|
||
| Advertising | 1 | $2B |
|
||
Price history
+106.5% since first listed10 events — show timeline
- 2026-06-16 Listed $165,000 GSREIN
- 2026-06-16 Listed $165,000 AcadianaMLS
- 2006-08-01 Sold (Public Records) $121,000 Public Records
- 2006-07-28 Sold (MLS) $121,000 GSREIN
- 2006-04-23 Listed $120,000 GSREIN
- 2006-04-23 Listed $120,000 AcadianaMLS
- 2003-04-02 Sold (Public Records) $82,500 Public Records
- 2003-03-28 Sold (MLS) $85,397 GSREIN
- 2003-01-14 Listed $79,900 AcadianaMLS
- 2003-01-14 Listed $79,900 GSREIN
Property tax history
-7.2%/yrLatest (2025): $637 · -9.2% YoY. Source: county tax records.
Cash-flow waterfall
monthlySold comps — $/sqft
last 12 mo · ≤1 miLoading sold comps…