7204 Ohio River Rd · Sciotodale, OH
Flood risk 1/10 · Minimal
- FEMA flood zone
- X (unshaded)
- Chance of flooding over 30 yrs
- 0.0%
- Est. flood insurance / yr
- $473 – $860
Fire risk 4/10 · Minor
- Est. fire insurance / yr
- $713 – $1,323
Heat risk 5/10 · Moderate
- Hot days now (above 102°F)
- 7 days/yr
- Hot days in 30 yrs
- 19 days/yr
Wind risk 2/10 · Minimal
- Chance of severe wind over 30 yrs
- 1.0%
Air-quality risk 2/10 · Minimal
- Unhealthy air days now
- 0 days/yr
- Unhealthy air days in 30 yrs
- 1 days/yr
Risk factors via First Street. Map © Google.
Why this score? — see what drove the B+ grade
The composite is a weighted blend of 9 inputs, each scored 0–100. Each bar is that input's sub-score; the figure is the points it added to the 100-point composite (weight × sub-score).
- Cash flow +30.0/30.0
- ARV discount +15.0/15.0
- 1% rule +10.0/10.0
- DSCR +10.0/10.0
- Schools +5.2/10.0
- Livability +3.0/5.0
- Rent growth +2.5/5.0
- Condition / age +2.5/5.0
- Appreciation +0.0/10.0
$69,900
🖨 Deal sheet 📄 Offer letter ✓ Due diligence
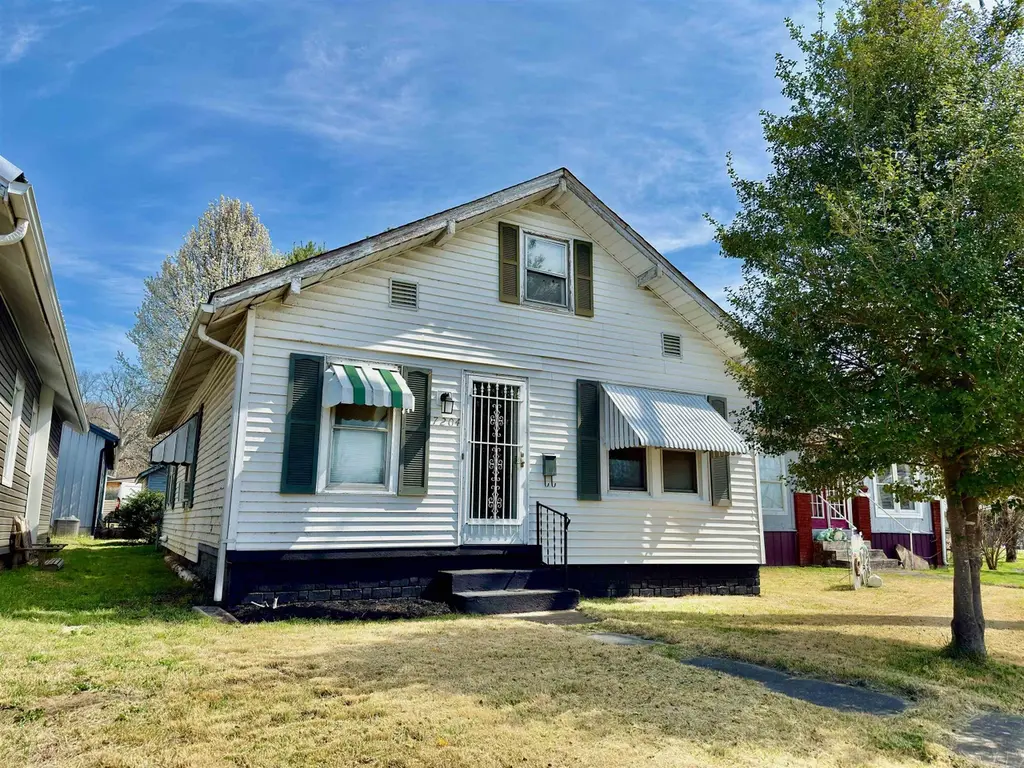
Listing remarks
Perfect starter home, downsizing home or rental! This charming 2 bedroom 1.5 bath home sits just minutes from downtown Wheelersburg. You may be surprised that the layout of this home makes it feel more spacious than 816 sqft. Walking in you’ll start in the kitchen with laundry to your left and the full bathroom to your right, the dining room then adjoins the two bathrooms, and finally the living room which features the gas log fireplace connects to the foyer. The attic space is accessible from the foyer and can be used for many different things, it also features unfinished storage space behind the door. On the exterior, you’ll have access to the basement/cellar which hosts the n
Key facts
- 5,227 sq ft lot
- 2 garage spots
- Built 1928
Neighborhood map
What this means for you Summary
Snapshot
- This is a 2-bed/1.0-bath single-family listed at $70k.
Deal economics
- At list price, monthly cash flow is $533 ($6k/yr) — positive.
- The deal already cash-flows at list — no discount required.
- Meets the 1% rule at list price ($1k rent vs $70k).
Location & tenants
- Location reads 60/100 on livability (#987 in OH) — a middle-class / working-renter tenant base. Strengths: cost of living A+, housing A-; Watch: health & safety C-, schools D, amenities F.
- Wheelersburg Local (town): math 50% / reading 74% proficiency, ranked #270 of 656 in OH (top 41%) — acceptable for families but not a draw, mixed tenant base, ~2y average lease.
- Market conditions: 16 active listings in the ZIP; lower-income renter base — watch delinquency; 8 units permitted in Scioto County in 2024 (0 in 5+ unit buildings).
- This rent runs 40% of the median local income ($37k/yr) — at the standard rent-burdened threshold; future hikes will face affordability resistance.
Forward outlook
- Local home prices are declining (-3.0%/yr); year-one equity from $483 of loan paydown is wiped out by about $2k of value loss. Plan a longer hold.
- Scioto County population projected at -24% by 2050 — secular population decline; favor cash flow + early exit over multi-decade hold.
- At projected returns (-3.0% appreciation + 3.0% rent growth), your $20k cash investment doubles in ~4 years — after that, you're playing with house money.
Negotiation context
- Only 5 days on market — expect competitive offers; lowballing is unlikely to land.
Risks & watch-outs
- Watch-outs: built in 1928 — expect roof / HVAC / electrical / plumbing capex.
- Climate carrying-cost: extreme-heat days projected 7→19/yr by 2055 (HVAC capex compounding) — expect insurance premiums to compound above CPI over the hold.
Questions for the listing agent
- Built in 1928 — when were the roof, HVAC, electrical panel, plumbing, and water heater last replaced?
- Is there a deadline driving the sale (1031 exchange, divorce, estate, relocation)? That informs how much negotiation room exists.
- Schools are D-rated, which usually means shorter tenancies and higher turnover. Who's the typical renter profile here, and what's been the actual vacancy rate?
- What's the average days-on-market for RENTAL listings here right now (not sales)? A rising rental-DOM trend means longer vacancies and softer asking-rent achievability than the comps imply.
- What's the recent tenant-quality profile in this submarket — average credit score on applications, eviction rate, late-payment / NSF rate, and stable-employment percentage? A property-management company in the area should have these aggregated.
- How much new for-sale + rental construction is in the pipeline within 1–3 miles? Heavy new supply typically softens prices + rents 12–24 months out; constrained supply supports both.
Investment metrics
- 1% rule
- 1.79% ✓
- Cap rate
- 15.44%
- Cash-on-cash
- 32.68%
- DSCR
- 2.45
- GRM
- 4.7
CMA / ARV
- ARV (on-the-fly)
- $135,456
- Comps found
- 1
Show comp detail 1 sale within ~0.75 mi
| Address | Dist | Beds/Ba | Sqft | Sold | Price | $/sf | Match |
|---|---|---|---|---|---|---|---|
| 194 Wilson Ave | 0.60mi | 3/1.0 (+1) | 768 (-6%) | 8mo | $127,500 | $166 | 51 |
Match score weights: distance 35% · size 25% · config 20% · recency 20%. Top-matched comps best support the ARV.
Projected returns pro-forma
-3.0% appreciation · 3.0% rent growth · sell at horizon
- IRR
- 27.8%
- Equity multiple
- 2.16×
- Total profit
- $22,621
- Equity at exit
- $10,422
- IRR
- 35.3%
- Equity multiple
- 4.24×
- Total profit
- $63,414
- Equity at exit
- $6,044
Cash invested: $19,572 (down + closing). Projections, not guarantees.
Landlord ↔ Tenant lean methodology
- Overall (STATE)
- 73 Landlord-Friendly
- State Ohio
- 73 Landlord-Friendly · R+6
- County
- — inherits STATE
- City
- — inherits STATE
ZIP-level market 45662
- Active inventory
- 16
- Price-to-rent
- 4.7×
Monthly cashflow live
- Estimated rent
- $1,249 medium interval (Pro) →
- Mortgage (P&I)
- −$367
- Tax from tax record
- −$58 /mo · $692/yr
- Insurance
- −$29
- HOA
- −$0
- Vacancy / Maint / Mgmt
- −$262
- Net cashflow
- $533
Break-even live
UW: 25.0% down · 7.5% · 30yr · 1.5% tax · 5.0% vac · 8.0% maint · 8.0% mgmt
Financing live
Cash to close
- Down payment
- $17,475
- Closing costs
- $2,097
- Reserves months
- —
- Total cash needed
- —
Loan-product check · same deal, 3 products live
Conventional
25% down · 7.5% · 30yr
- Down + closing
- —
- Monthly P&I
- —
- Monthly cashflow
- —
- DSCR
- —
- Eligible?
- —
Personal DTI + credit; lowest rate.
DSCR
20% down · 8.5% · 30yr
- Down + closing
- —
- Monthly P&I
- —
- Monthly cashflow
- —
- DSCR
- —
- Eligible?
- —
No personal income docs; deal must DSCR.
Hard money
10% down · 12.0% · 12mo
- Down + closing
- —
- Monthly P&I
- —
- Monthly cashflow
- —
- DSCR
- —
- Eligible?
- —
Short-term bridge; refi at stabilization.
Listing history 2 events
-
2026-03-31status Pending
-
2026-03-26$69,900 Active
ⓘ Source: listings_history table (triggers on properties + properties_extension) + one-shot
backfill from property_details.listing_events for pre-trigger history.
Tax reassessment forecast OH · Partial reset (capped growth)
- Current annual tax
- $692 · $58/mo
- Projected year-2 tax
- $891 · $74/mo
- Expected delta
- +$199/yr (+$17/mo · 28.8%)
ⓘ Screening estimate from a state-policy table — verify with the county assessor before closing.
Climate risk First Street
- Flood 1/10 Low FEMA zone X (unshaded) · 0% chance over 30 yrs
- Wildfire 4/10 Moderate
- Heat 5/10 Major 7 d/yr ≥102°F today · 19 d/yr by 30 yrs out
- Wind 2/10 Low 100% chance of damaging wind over 30 yrs
- Air quality 2/10 Low 0 unhealthy d/yr today · 1 by 30 yrs out
Nearby sold comps map
Loading sold comps map…
Walkable amenities ~0.75 mi
Loading nearby amenities…
Taxation est. · year 1
- Rental income
- $14,983
- − Mortgage interest
- −$3,915
- − Property taxes
- −$692
- − Insurance
- −$350
- − Repairs & maintenance
- −$1,199
- − Management
- −$1,199
- − Depreciation
- −$2,033
- Taxable income
- $5,595
- Est. tax owed @ 24.0%
- −$1,343
- After-tax cash flow
- $5,053/yr
For passive investors: Depreciation is non-cash, so a rental often shows a tax loss while cash-flowing — sheltering income. Rental losses are passive: they offset passive income freely, and up to $25,000/yr can offset ordinary (W-2) income if you actively participate and your MAGI is under $100k (phasing out to $0 by $150k); unused losses carry forward. On sale, claimed depreciation is recaptured at up to 25%, and gains may owe capital-gains tax (a 1031 exchange can defer both). Figures are a year-1 estimate at your 24.0% rate — not tax advice; consult a CPA.
Schools (NCES district)
- District
- Wheelersburg Local
- NCES district ID
- 3904966
- Math proficiency
- 50% ▼ -26.00%
- Reading proficiency
- 74% ▼ -9.00%
- Median HH income
- $44,480
- Composite
- 52.11/100
- National rank
- #1621
- State rank
- #270 of 656 in OH
Livability — Sciotodale
- Score
- 60/100
- State rank
- #987
- US rank
- #19342
Category grades
Schools grade is shown separately in the Schools card above.
Census & demographics
- Census place
- Sciotodale, OH
- County
- Scioto · 71,806 people
- Population (ZIP)
- 26,972
- Household income
- $37,345
- Rent vs Own
- Severe rent burden
- 11.3
Population outlook (Scioto County) Hauer SSP2
- Today (2025)
- 71,121 people
- By 2030
- 67,817 · -4.6%
- By 2040
- 61,021 · -14.2%
- By 2050
- 54,016 · -24.1%
- By 2075
- 38,532 · -45.8%
- By 2100
- 25,734 · -63.8%
Race, ethnicity, and origin ACS 2023
- Neighborhood character
- Predominantly White (88%)
- Race & ethnicity
- White 88% Two or more races 6% Black 3% Hispanic / Latino 2%
- Common ancestry
- Lithuanian 2% Slovak 1% Iranian 1%
- Foreign-born
- 1% · Canada, China
- Languages at home
- 98% English-only · Spanish 1%
Political lean MEDSL · Scioto
- 2024 margin
- Solid R (+48.0) · D 25.7% · R 73.7%
- 2008→2024 swing
- -41.6pp toward R · 2008: -6.3pp · 2024: -48.0pp
- All cycles
- 2024: R+48.0 2020: R+42.2 2016: R+36.8 2012: R+2.0 2008: R+6.3
Not yet ingested
- Civics
- —
Market trends
- HPI YoY
- ▼ -101.06%
- Current HPI
- 141.5176
- Rent YoY
- —
- Metro
- —
- State GDP YoY
- ▲ 1.98%
- F500 in state
- 48
Industry mix (Fortune 500 HQ in OH)
| Industry | F500 HQs | Revenue |
|---|---|---|
| Insurance | 3 | $145B |
|
||
| Industrial Machinery | 3 | $49B |
|
||
| Financial Services | 3 | $24B |
|
||
| Consumer Goods | 2 | $93B |
|
||
| Aerospace / Defense | 2 | $47B |
|
||
| Utilities | 2 | $33B |
|
||
Price history
2 events — show timeline
- 2026-03-31 Pending — HBRMLS
- 2026-03-26 Listed $69,900 HBRMLS
Property tax history
+7.1%/yrLatest (2025): $692 · +39.5% YoY. Source: county tax records.
Cash-flow waterfall
monthlySold comps — $/sqft
last 12 mo · ≤1 miLoading sold comps…