7432 Gainesville Ave · Jacksonville, FL
Flood risk 1/10 · Minimal
- FEMA flood zone
- X (unshaded)
- Chance of flooding over 30 yrs
- 0.0%
- Est. flood insurance / yr
- $507 – $1,088
Fire risk 3/10 · Minor
- Est. fire insurance / yr
- $947 – $1,759
Heat risk 9/10 · Severe
- Hot days now (above 107°F)
- 7 days/yr
- Hot days in 30 yrs
- 18 days/yr
Wind risk 9/10 · Severe
- Chance of severe wind over 30 yrs
- 99.0%
Air-quality risk 4/10 · Minor
- Unhealthy air days now
- 6 days/yr
- Unhealthy air days in 30 yrs
- 6 days/yr
Risk factors via First Street. Map © Google.
Why this score? — see what drove the C- grade
The composite is a weighted blend of 9 inputs, each scored 0–100. Each bar is that input's sub-score; the figure is the points it added to the 100-point composite (weight × sub-score).
- Cash flow +21.3/30.0
- ARV discount +7.9/15.0
- DSCR +6.8/10.0
- 1% rule +5.7/10.0
- Livability +4.2/5.0
- Schools +3.9/10.0
- Condition / age +2.5/5.0
- Rent growth +2.2/5.0
- Appreciation +0.0/10.0
$125,000
🖨 Deal sheet (PDF) 📄 Offer letter ✓ Due diligence
Listing remarks
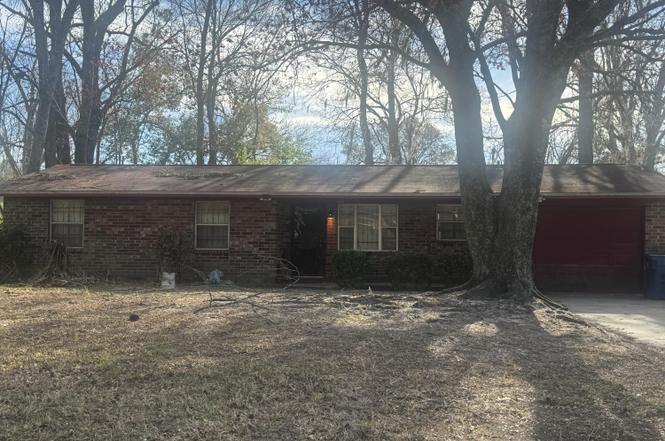
Great home for a first time homeowner, or a Great Investment. This all brick home is just right. Location, Location, Location. No HOA, minutes to the airport or downtown. Make it yours today.
Key facts
- 7,840 sq ft lot
- Garage
- Built 1977
Property features AI
Finance
- HOA & community: Not a senior community
Exterior
- Parking: Attached garage; 1-car garage
- Utilities: Public sewer; Cable available; Electricity connected
- Home design: Single-family residence; Residential use
- Exterior features: 0.18-acre lot
Interior
- Kitchen: Electric range
- Bedrooms: 3 bedrooms
- Bathrooms: 2 full bathrooms
- Heating & cooling: Central heating; Central air conditioning
- Interior features: Electric range
Neighborhood map
What this means for you Summary
Snapshot
- This is a 3-bed/2.0-bath single-family listed at $125k.
Deal economics
- At list price, monthly cash flow is $184 ($2k/yr) — positive.
- The deal already cash-flows at list — no discount required.
- Meets the 1% rule at list price ($1k rent vs $125k).
- Recommended offer: $118k (6.0% below list) — sets the bar for market timing.
- Cap rate 8.1% vs local median 3.9% in Jacksonville — top-decile yield for the area; either an underpriced asset or a hidden risk that comps aren't pricing in. Stress-test before assuming the spread holds.
Location & tenants
- Location reads 83/100 on livability (#50 in FL, #911 nationally) — a professional / high-income tenant draw. Strengths: amenities A+, commute A+, housing A+.
- Duval (urban): math 46% / reading 45% proficiency, ranked #48 of 73 in FL (top 66%) — families likely to look elsewhere, expect single-tenant / working-renter base with shorter leases.
- Zoned schools: Northwestern Legends Elementary (math 21% / reading 14%, grade F, #2,117 of 2,144 statewide, top 99%, 528 students, 88% FRL); Joseph Stilwell Middle School (math 31% / reading 33%, grade F, #448 of 571 statewide, top 79%, 612 students, 68% FRL); Jean Ribault High School (math 22% / reading 25%, grade F, #533 of 667 statewide, top 80%, 1,385 students, 71% FRL) — zoned schools average 76% FRL vs 49% district-wide (27 pts higher); higher-poverty schools than district average — tighter screening recommended.
- Zoned-school proficiency averages 24% at this address vs 46% district-wide (-21 pts) — the specific schools serving this property underperform the Duval average; the district grade overstates school quality for this exact location.
- Market conditions: Rents soft (-1.4%/yr); 294 active listings in the ZIP; 40 comparable units currently listed for rent nearby; rentals at typical pace (median 26d on market — plan ~3-4 weeks tenant-placement turnaround); lower-income renter base — watch delinquency; 6,503 units permitted in Duval County in 2024 (1,131 in 5+ unit buildings).
- This rent runs 39% of the median local income ($41k/yr) — at the standard rent-burdened threshold; future hikes will face affordability resistance.
Forward outlook
- Local home prices are declining (-3.0%/yr); year-one equity from $864 of loan paydown is wiped out by about $4k of value loss. Plan a longer hold.
- Duval County population projected at +19% by 2050 — long-run rental-demand tailwind backs the buy-and-hold thesis.
Negotiation context
- It's been on market 74 days — a 6% lower offer ($118k) is reasonable based on typical stale-listing flexibility.
- Current owner paid $28k; list at $125k implies a 339% gain — meaningful room to come down on a strong offer.
Risks & watch-outs
- Climate carrying-cost: severe wind risk, 99% chance of damaging wind over 30y; extreme-heat days projected 7→18/yr by 2055 (HVAC capex compounding) — expect insurance premiums to compound above CPI over the hold.
Questions for the listing agent
- It's been on market 74 days. Have you received any prior offers? Is the seller open to a 6% concession, seller financing, or rate buy-down credit?
- Built in 1977 — when were the roof, HVAC, electrical panel, plumbing, and water heater last replaced?
- Why hasn't it sold? Are there any deal-killer items the seller is aware of (foundation, flood, title, zoning, code violations)?
- Is there a deadline driving the sale (1031 exchange, divorce, estate, relocation)? That informs how much negotiation room exists.
- Schools are B-rated — typically a magnet for longer-tenancy family renters. What's the average tenant stay here, and is there a school-zone premium baked into asking?
- What's the average days-on-market for RENTAL listings here right now (not sales)? A rising rental-DOM trend means longer vacancies and softer asking-rent achievability than the comps imply.
- What's the recent tenant-quality profile in this submarket — average credit score on applications, eviction rate, late-payment / NSF rate, and stable-employment percentage? A property-management company in the area should have these aggregated.
- How much new for-sale + rental construction is in the pipeline within 1–3 miles? Heavy new supply typically softens prices + rents 12–24 months out; constrained supply supports both.
Investment metrics
- 1% rule
- 1.07% ✓
- Cap rate
- 8.06%
- Cash-on-cash
- 6.30%
- DSCR
- 1.28
- GRM
- 7.8
CMA / ARV
- ARV (on-the-fly)
- $126,082
- Comps found
- 12
Show comp detail 12 sales within ~0.75 mi
| Address | Dist | Beds/Ba | Sqft | Sold | Price | $/sf | Match |
|---|---|---|---|---|---|---|---|
| 7437 Oriole St | 0.08mi | 3/2.0 | 1,032 (-1%) | 10mo | $169,000 | $164 | 86 |
| 7447 Oriole St | 0.08mi | 3/1.5 | 912 (-12%) | 8mo | $71,250 | $78 | 67 |
| 7400 Fernandina Ave | 0.15mi | 2/1.0 (-1) | 933 (-10%) | 1mo | $28,000 | $30 | 66 |
| 1224 Kennard St | 0.60mi | 3/2.0 | 1,092 (+5%) | 6mo | $50,000 | $46 | 59 |
| 5752 Oprey St | 0.36mi | 3/2.0 | 912 (-12%) | 6mo | $110,000 | $121 | 58 |
| 7632 Lueders Ave | 0.67mi | 3/1.0 | 1,024 (-2%) | 6mo | $144,000 | $141 | 57 |
| 950 Ashton St | 0.64mi | 3/1.0 | 1,000 (-4%) | 4mo | $142,500 | $143 | 56 |
| 2115 Burgoyne Dr | 0.67mi | 3/2.0 | 1,092 (+5%) | 8mo | $90,000 | $82 | 54 |
| 2231 Palmdale St | 0.73mi | 3/1.5 | 1,104 (+6%) | 2mo | $75,000 | $68 | 53 |
| 1508 Golf Forest Dr | 0.69mi | 3/2.0 | 1,100 (+6%) | 8mo | $150,000 | $136 | 52 |
| 5745 Benedict Rd | 0.70mi | 3/1.0 | 904 (-13%) | 5mo | $60,000 | $66 | 37 |
| 7939 Denham Rd E | 0.73mi | 3/1.0 | 1,168 (+12%) | 14mo | $154,000 | $132 | 30 |
Match score weights: distance 35% · size 25% · config 20% · recency 20%. Top-matched comps best support the ARV.
Projected returns pro-forma
-3.0% appreciation · 0.0% rent growth · sell at horizon
- IRR
- -10.1%
- Equity multiple
- 0.64×
- Total profit
- $-12,462
- Equity at exit
- $18,638
- IRR
- -5.5%
- Equity multiple
- 0.69×
- Total profit
- $-10,879
- Equity at exit
- $10,808
Cash invested: $35,000 (down + closing). Projections, not guarantees.
Landlord ↔ Tenant lean methodology
- Overall (STATE)
- 87 Strongly Landlord-Friendly
- State Florida
- 87 Strongly Landlord-Friendly · R+3
- County
- — inherits STATE
- City
- — inherits STATE
ZIP-level market 32208
- Home prices YoY
- -33.6%
- Rents YoY
- -1.4%
- Active inventory
- 294
- Price-to-rent
- 7.8×
Monthly cashflow live
- Estimated rent
- $1,343 high interval (Pro) →
- Mortgage (P&I)
- −$656
- Tax from tax record
- −$169 /mo · $2,034/yr
- Insurance
- −$52
- HOA
- −$0
- Vacancy / Maint / Mgmt
- −$282
- Net cashflow
- $184
Break-even live
Sensitivity live
| Price | -10% $254 | -5% $219 | +0% $184 | +5% $148 | +10% $113 |
|---|---|---|---|---|---|
| Rent | -10% $78 | -5% $131 | +0% $184 | +5% $237 | +10% $290 |
| Rate | -1.0pp $247 | -0.5pp $215 | base $184 | +0.5pp $151 | +1.0pp $118 |
UW: 25.0% down · 7.5% · 30yr · 1.5% tax · 5.0% vac · 8.0% maint · 8.0% mgmt
Financing live
Cash to close
- Down payment
- $31,250
- Closing costs
- $3,750
- Reserves months
- —
- Total cash needed
- —
Loan-product check · same deal, 3 products live
Conventional
25% down · 7.5% · 30yr
- Down + closing
- —
- Monthly P&I
- —
- Monthly cashflow
- —
- DSCR
- —
- Eligible?
- —
Personal DTI + credit; lowest rate.
DSCR
20% down · 8.5% · 30yr
- Down + closing
- —
- Monthly P&I
- —
- Monthly cashflow
- —
- DSCR
- —
- Eligible?
- —
No personal income docs; deal must DSCR.
Hard money
10% down · 12.0% · 12mo
- Down + closing
- —
- Monthly P&I
- —
- Monthly cashflow
- —
- DSCR
- —
- Eligible?
- —
Short-term bridge; refi at stabilization.
Rent comps 40 comps
| Address | Beds | Baths | Sqft | Rent | $/sqft | DOM | Units | Dist |
|---|---|---|---|---|---|---|---|---|
| 5903 Droad St Jacksonville, FL | 3.0 | 1.0 | 1161 | $1,400 | $1.21 | 4d | 1 | 0.09mi |
| 1567 Rutledge Ave Jacksonville, FL | 3.0 | 2.0 | 1050 | $1,113 | $1.06 | 25d | 1 | 0.20mi |
| 1750 Rutledge Ave Jacksonville, FL | 3.0 | 2.0 | 1250 | $1,358 | $1.09 | 16d | 1 | 0.48mi |
| 1536 W 45th St Jacksonville, FL | 2.0 | 1.0 | 800 | $1,050 | $1.31 | 25d | 1 | 0.50mi |
| 5736 Teeler Ave Jacksonville, FL | 3.0 | 1.0 | 852 | $1,000 | $1.17 | 25d | 1 | 0.52mi |
| 7927 Reid Ave Jacksonville, FL | 3.0 | 1.0 | 1055 | $1,500 | $1.42 | 25d | 1 | 0.69mi |
| 2312 Palmdale St Jacksonville, FL | 3.0 | 2.0 | 972 | $1,231 | $1.27 | 25d | 1 | 0.72mi |
| 961 Dorchester St Jacksonville, FL | 2.0 | 1.0 | 884 | $1,025 | $1.16 | 4d | 1 | 0.74mi |
| 1834 Meharry Ave Jacksonville, FL | 3.0 | 1.0 | 1291 | $1,295 | $1.00 | 6d | 1 | 0.77mi |
| 6510 Avalon St Jacksonville, FL | 4.0 | 2.0 | 1488 | $1,425 | $0.96 | 25d | 1 | 0.82mi |
| 1010 Edgewood Ave W Jacksonville, FL | 4.0 | 2.0 | 1450 | $1,250 | $0.86 | 25d | 1 | 0.83mi |
| 1010 Edgewood Ave W Jacksonville, FL | 4.0 | 2.0 | 1450 | $1,250 | $0.86 | 16d | 1 | 0.83mi |
| 1136 Maynard St Jacksonville, FL | 2.0 | 1.0 | 919 | $1,045 | $1.14 | 25d | 1 | 0.84mi |
| 920 Alderside St Jacksonville, FL | 3.0 | 1.0 | 1255 | $1,195 | $0.95 | 6d | 1 | 0.85mi |
| 2092 Benedict Rd Jacksonville, FL | 3.0 | 1.0 | 816 | $1,095 | $1.34 | 25d | 1 | 0.85mi |
| 1348 Crestwood St Jacksonville, FL | 3.0 | 1.0 | 1300 | $1,100 | $0.85 | 25d | 1 | 0.86mi |
| 1803 W 44th St Unit 1803 Jacksonville, FL | 2.0 | 1.0 | 750 | $950 | $1.27 | 9d | 1 | 0.88mi |
| 5352 Dodge Rd Jacksonville, FL | 3.0 | 2.0 | 1050 | $1,261 | $1.20 | 25d | 1 | 0.89mi |
| 1823 W 44th St Jacksonville, FL | 3.0 | 2.0 | 1066 | $1,500 | $1.41 | 25d | 1 | 0.89mi |
| 2534 Aubrey Ave Jacksonville, FL | 4.0 | 2.0 | 759 | $1,250 | $1.65 | 25d | 1 | 0.90mi |
| 5350 Dodge Rd Jacksonville, FL | 3.0 | 1.0 | 1000 | $1,500 | $1.50 | 25d | 1 | 0.91mi |
| 1975 Rugby Rd Jacksonville, FL | 2.0 | 1.0 | 992 | $1,100 | $1.11 | 9d | 1 | 0.92mi |
| 1959 W 45th St Jacksonville, FL | 2.0 | 1.0 | 895 | $1,245 | $1.39 | 15d | 1 | 0.93mi |
| 4813 Moncrief Rd Jacksonville, FL | 2.0–3.0 | 1.0 | 755 | $920 | $1.22 | 4d | 8 | 0.93mi |
| 2151 Wilberforce Rd Jacksonville, FL | 3.0 | 2.0 | 1166 | $1,249 | $1.07 | 25d | 1 | 0.95mi |
| 2069 Talladega Rd Jacksonville, FL | 4.0 | 2.0 | 1152 | $1,298 | $1.13 | 5d | 1 | 1.02mi |
| 6114 Strawflower Pl Jacksonville, FL | 3.0 | 1.0 | 1030 | $1,200 | $1.17 | 25d | 1 | 1.03mi |
| 8617 3rd Ave Jacksonville, FL | 3.0 | 1.0 | 1048 | $1,200 | $1.15 | 12d | 1 | 1.04mi |
| 2818 Palmdale St Jacksonville, FL | 4.0 | 2.5 | 1484 | $1,900 | $1.28 | 25d | 1 | 1.05mi |
| 1867 W 41st St Jacksonville, FL | 3.0 | 2.0 | 1218 | $1,325 | $1.09 | 19d | 1 | 1.07mi |
| 8642 2nd Ave Jacksonville, FL | 3.0 | 2.0 | 1074 | $1,245 | $1.16 | 3d | 1 | 1.08mi |
| 2108 Talladega Rd Jacksonville, FL | 3.0 | 2.0 | 1160 | $1,579 | $1.36 | 5d | 1 | 1.08mi |
| 8663 5th Ave Jacksonville, FL | 2.0 | 1.0 | 720 | $1,045 | $1.45 | 25d | 1 | 1.11mi |
| 1653 W 35th St Jacksonville, FL | 2.0 | 1.0 | 800 | $825 | $1.03 | 25d | 1 | 1.14mi |
| 7210 Elwood Ave Jacksonville, FL | 2.0 | 1.0 | 831 | $995 | $1.20 | 23d | 1 | 1.16mi |
| 8721 4th Ave Jacksonville, FL | 3.0 | 1.5 | 1344 | $1,399 | $1.04 | 25d | 1 | 1.17mi |
| 1021 Lake Forest Blvd Jacksonville, FL | 3.0 | 1.0 | 1393 | $1,290 | $0.93 | 4d | 1 | 1.18mi |
| 915 Wayne St Jacksonville, FL | 4.0 | 2.0 | 1220 | $1,313 | $1.08 | 4d | 1 | 1.24mi |
| 5306 Paris Ave Jacksonville, FL | 3.0 | 1.0 | 944 | $1,150 | $1.22 | 25d | 1 | 1.24mi |
| 1551 W 33rd St #2 Jacksonville, FL | 2.0 | 1.0 | 842 | $795 | $0.94 | 22d | 1 | 1.24mi |
Listing history 3 events
-
2026-05-11status Pending
-
2026-02-26$125,000 Active
-
1977-09-23soldstatus $28,500
ⓘ Source: listings_history table (triggers on properties + properties_extension) + one-shot
backfill from property_details.listing_events for pre-trigger history.
Tax reassessment forecast FL · Resets to sale price
- Current annual tax
- $2,034 · $169/mo
- Projected year-2 tax
- $2,034 · $169/mo
- Expected delta
- $0/yr ($0/mo · 0.0%)
ⓘ Screening estimate from a state-policy table — verify with the county assessor before closing.
Climate risk First Street
- Flood 1/10 Low FEMA zone X (unshaded) · 0% chance over 30 yrs
- Wildfire 3/10 Moderate
- Heat 9/10 Extreme 7 d/yr ≥107°F today · 18 d/yr by 30 yrs out
- Wind 9/10 Extreme 99% chance of damaging wind over 30 yrs
- Air quality 4/10 Moderate 6 unhealthy d/yr today · 6 by 30 yrs out
Nearby sold comps map
Loading sold comps map…
Walkable amenities ~0.75 mi
Loading nearby amenities…
Taxation est. · year 1
- Rental income
- $16,113
- − Mortgage interest
- −$7,002
- − Property taxes
- −$2,034
- − Insurance
- −$625
- − Repairs & maintenance
- −$1,289
- − Management
- −$1,289
- − Depreciation
- −$3,636
- Taxable income
- $238
- Est. tax owed @ 24.0%
- −$57
- After-tax cash flow
- $2,147/yr
For passive investors: Depreciation is non-cash, so a rental often shows a tax loss while cash-flowing — sheltering income. Rental losses are passive: they offset passive income freely, and up to $25,000/yr can offset ordinary (W-2) income if you actively participate and your MAGI is under $100k (phasing out to $0 by $150k); unused losses carry forward. On sale, claimed depreciation is recaptured at up to 25%, and gains may owe capital-gains tax (a 1031 exchange can defer both). Figures are a year-1 estimate at your 24.0% rate — not tax advice; consult a CPA.
Schools (NCES district)
- District
- Duval
- NCES district ID
- 1200480
- Math proficiency
- 46% ▼ -11.00%
- Reading proficiency
- 45% ▼ -4.00%
- Median HH income
- $48,987
- Composite
- 38.97/100
- National rank
- #4076
- State rank
- #48 of 73 in FL
Livability — Jacksonville
- Score
- 83/100
- State rank
- #50
- US rank
- #911
Category grades
Schools grade is shown separately in the Schools card above.
Census & demographics
- Census place
- Jacksonville, FL
- County
- Duval County · 1,015,274 people
- City population
- 979,034
- Metro
- Jacksonville, FL
- Population (ZIP)
- 32,699
- Household income
- $41,324
- Rent vs Own
- Severe rent burden
- 1765.0
Population outlook (Duval County) Hauer SSP2
- Today (2025)
- 1,013,010 people
- By 2030
- 1,059,228 · +4.6%
- By 2040
- 1,141,439 · +12.7%
- By 2050
- 1,205,258 · +19.0%
- By 2075
- 1,324,282 · +30.7%
- By 2100
- 1,319,620 · +30.3%
Race, ethnicity, and origin ACS 2023
- Neighborhood character
- Predominantly Black (77%)
- Race & ethnicity
- Black 77% White 16% Two or more races 4% Hispanic / Latino 3%
- Common ancestry
- Italian 1%
- Foreign-born
- 2% · Canada
- Languages at home
- 97% English-only · Spanish 2%
Political lean MEDSL · Duval
- 2024 margin
- Toss-up / Even · D 48.7% · R 50.1% · Other 1.2%
- 2008→2024 swing
- +0.4pp no change · 2008: -1.9pp · 2024: -1.5pp
- All cycles
- 2024: R+1.5 2020: D+3.8 2016: R+1.5 2012: R+3.6 2008: R+1.9
Not yet ingested
- Civics
- —
Market trends
- HPI YoY
- ▼ -110.56%
- Current HPI
- 217.9706
- Rent YoY
- ▼ -1.36%
- Metro
- Jacksonville, FL
- State GDP YoY
- ▲ 3.28%
- F500 in state
- 36
Industry mix (Fortune 500 HQ in FL)
| Industry | F500 HQs | Revenue |
|---|---|---|
| Industrial Technology | 2 | $29B |
|
||
| Insurance | 2 | $17B |
|
||
| Retail | 1 | $60B |
|
||
| Technology Distribution | 1 | $58B |
|
||
| Homebuilding | 1 | $35B |
|
||
| Technology Manufacturing | 1 | $35B |
|
||
Price history
+338.6% since first listed3 events — show timeline
- 2026-05-11 Pending — realMLS
- 2026-02-26 Listed $125,000 realMLS
- 1977-09-23 Sold (Public Records) $28,500 Public Records
Property tax history
+7.7%/yrLatest (2025): $2,034 · +20.4% YoY. Source: county tax records.
Cash-flow waterfall
monthlySold comps — $/sqft
last 12 mo · ≤1 miLoading sold comps…