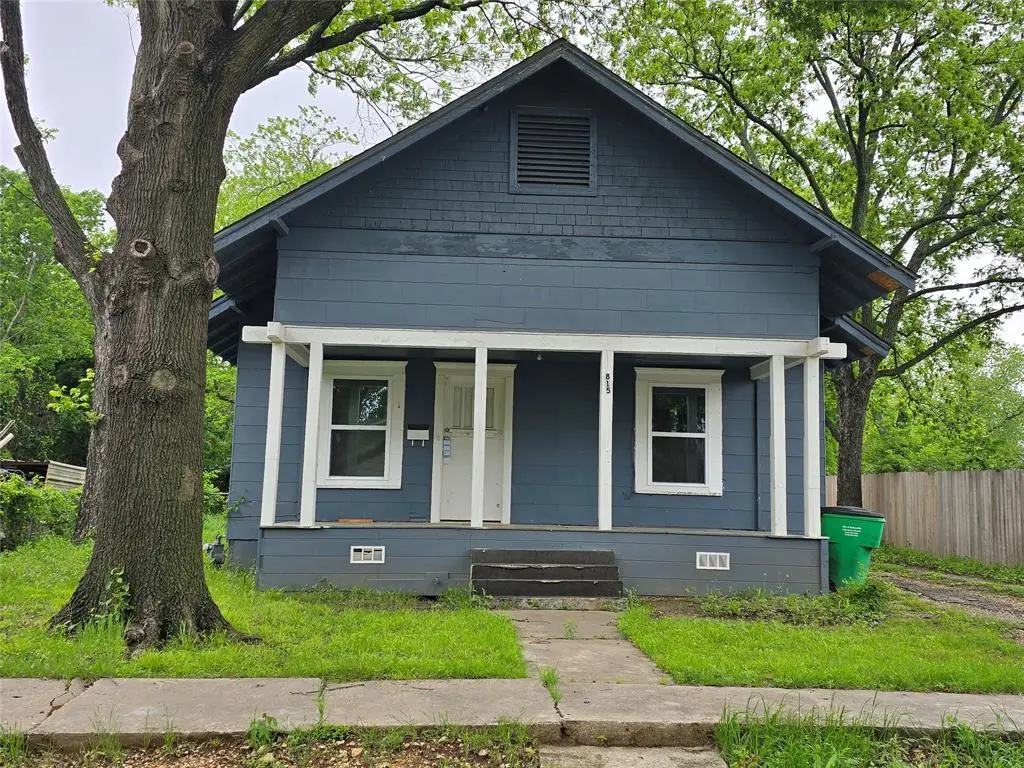
815 Moran St · Gainesville, TX
Flood risk 1/10 · Minimal
- FEMA flood zone
- X (unshaded)
- Chance of flooding over 30 yrs
- 0.0%
- Est. flood insurance / yr
- $507 – $1,088
Fire risk 7/10 · Major
- Est. fire insurance / yr
- $1,222 – $2,270
Heat risk 7/10 · Major
- Hot days now (above 110°F)
- 7 days/yr
- Hot days in 30 yrs
- 21 days/yr
Wind risk 4/10 · Minor
- Chance of severe wind over 30 yrs
- 16.0%
Air-quality risk 3/10 · Minor
- Unhealthy air days now
- 3 days/yr
- Unhealthy air days in 30 yrs
- 4 days/yr
Risk factors via First Street. Map © Google.
Why this score? — see what drove the B grade
The composite is a weighted blend of 9 inputs, each scored 0–100. Each bar is that input's sub-score; the figure is the points it added to the 100-point composite (weight × sub-score).
- Cash flow +27.3/30.0
- ARV discount +15.0/15.0
- DSCR +9.5/10.0
- 1% rule +7.6/10.0
- Livability +3.3/5.0
- Schools +2.6/10.0
- Rent growth +2.5/5.0
- Condition / age +2.5/5.0
- Appreciation +0.0/10.0
$142,500
🖨 Deal sheet 📄 Offer letter ✓ Due diligence
Listing remarks MLS
Solid older home near downtown. Two floor furnaces, owner says they are functional. Two window units, go with property. Fenced back yard. Several mature trees. House is at end of dead end street. Low traffic.
Key facts
- 9,583 sq ft lot
- Garage
- Built 1940
Property features AI
Finance
- Other: Unknown encumbrance(s) noted in restrictions; Possession at closing/funding or negotiable
- Financial info: Treat as clear loan type; No second mortgage; Listing terms: Cash or Conventional
- HOA & community: No association
Exterior
- Parking: Garage; 1 covered parking space; 1 garage space
- Utilities: City water; City sewer; Not in a municipal utility district
- Home design: Single family residence; One story; Residential property; Preowned (built 1940)
- Construction: Composition roof; Siding exterior; Pillar/post/pier foundation; Year built 1940
- Exterior features: Covered front porch; Covered porch(es); Chain link fencing; Utilities easement
Interior
- Kitchen: Kitchen on main level; Other appliances
- Bedrooms: 2 bedrooms (both on the main level; primary bedroom on level 1)
- Flooring: Laminate flooring
- Bathrooms: 1 full bathroom
- Heating & cooling: Wall/window cooling unit(s); Floor furnace; Wall furnace
- Interior features: 6 total rooms; 2 living areas; 1 dining area; Other interior features
- Laundry & utility: Washer hookup; Utility room on main level
Neighborhood map
What this means for you Summary
Snapshot
- This is a 3-bed/2.0-bath single-family listed at $142k.
Deal economics
- At list price, monthly cash flow is $410 ($5k/yr) — positive.
- The deal already cash-flows at list — no discount required.
- Meets the 1% rule at list price ($2k rent vs $142k).
- Recommended offer: $138k (3.0% below list) — sets the bar for market timing.
- Cap rate 9.7% vs local median 3.7% in Gainesville — top-decile yield for the area; either an underpriced asset or a hidden risk that comps aren't pricing in. Stress-test before assuming the spread holds.
Location & tenants
- Location reads 66/100 on livability (#602 in TX) — a middle-class / working-renter tenant base. Strengths: cost of living A+, housing A+, crime B+; Watch: amenities F, commute F, employment F.
- Gainesville ISD (rural): math 33% / reading 29% proficiency, ranked #606 of 826 in TX (top 73%) — families likely to look elsewhere, expect single-tenant / working-renter base with shorter leases; 72% free/reduced lunch — lower-income household profile, screen leases tightly.
- Zoned schools: Edison El (683 students, 81% FRL).
- Market conditions: 462 active listings in the ZIP; 6 comparable units currently listed for rent nearby; rentals lingering (median 44d on market — plan ~5-8 weeks vacancy on turnover, expect pricing pressure); 100% of comp listings sitting > 30 days — soft ceiling on asking rent; 190 units permitted in Cooke County in 2024 (0 in 5+ unit buildings).
- This rent runs 30% of the median local income ($72k/yr) — at the standard rent-burdened threshold; future hikes will face affordability resistance.
Forward outlook
- Local home prices are declining (-3.0%/yr); year-one equity from $985 of loan paydown is wiped out by about $4k of value loss. Plan a longer hold.
- At projected returns (-3.0% appreciation + 3.0% rent growth), your $40k cash investment doubles in ~10 years — after that, you're playing with house money.
Negotiation context
- It's been on market 57 days — a 3% lower offer ($138k) is reasonable based on typical stale-listing flexibility.
- 2 sale attempts since 23y ago with the ask held roughly flat each time — persistent listings suggest the price (not the market) is what's stuck; bring a comps-based counter.
Risks & watch-outs
- Watch-outs: built in 1940 — expect roof / HVAC / electrical / plumbing capex.
- Climate carrying-cost: major wildfire risk; extreme-heat days projected 7→21/yr by 2055 (HVAC capex compounding) — expect insurance premiums to compound above CPI over the hold.
Questions for the listing agent
- It's been on market 57 days. Have you received any prior offers? Is the seller open to a 3% concession, seller financing, or rate buy-down credit?
- Built in 1940 — when were the roof, HVAC, electrical panel, plumbing, and water heater last replaced?
- Is there a deadline driving the sale (1031 exchange, divorce, estate, relocation)? That informs how much negotiation room exists.
- Schools are F-rated, which usually means shorter tenancies and higher turnover. Who's the typical renter profile here, and what's been the actual vacancy rate?
- What's the average days-on-market for RENTAL listings here right now (not sales)? A rising rental-DOM trend means longer vacancies and softer asking-rent achievability than the comps imply.
- What's the recent tenant-quality profile in this submarket — average credit score on applications, eviction rate, late-payment / NSF rate, and stable-employment percentage? A property-management company in the area should have these aggregated.
- How much new for-sale + rental construction is in the pipeline within 1–3 miles? Heavy new supply typically softens prices + rents 12–24 months out; constrained supply supports both.
Investment metrics
- 1% rule
- 1.26% ✓
- Cap rate
- 9.75%
- Cash-on-cash
- 12.34%
- DSCR
- 1.55
- GRM
- 6.6
CMA / ARV
- ARV (median comp)
- $220,315
- List price
- $142,500
- Delta
- -35.32%
- Verdict
- UNDERPRICED
- Comps
- 20 within 1.0 mi
Show comp detail 12 sales within ~0.75 mi
| Address | Dist | Beds/Ba | Sqft | Sold | Price | $/sf | Match |
|---|---|---|---|---|---|---|---|
| 428 N Denton St | 0.26mi | 4/2.0 (+1) | 1,438 (-0%) | 1mo | $110,000 | $76 | 82 |
| 527 N Chestnut St | 0.22mi | 3/2.0 | 1,284 (-11%) | 4mo | $239,500 | $187 | 69 |
| 415 2nd St | 0.29mi | 3/2.0 | 1,232 (-14%) | 12mo | $115,000 | $93 | 52 |
| 333 N Red River St | 0.31mi | 2/1.0 (-1) | 1,288 (-11%) | 9mo | $232,550 | $181 | 52 |
| 345 N Morris St | 0.61mi | 3/2.0 | 1,526 (+6%) | 12mo | $295,000 | $193 | 52 |
| 1124 Throckmorton St | 0.39mi | 2/1.0 (-1) | 1,610 (+12%) | 6mo | $187,000 | $116 | 48 |
| 1209 N Morris St | 0.73mi | 3/2.0 | 1,360 (-6%) | 12mo | $237,000 | $174 | 47 |
| 422 S Commerce St | 0.68mi | 3/2.0 | 1,344 (-7%) | 14mo | $255,000 | $190 | 45 |
| 812 Buck St | 0.45mi | 2/2.0 (-1) | 1,282 (-11%) | 14mo | $79,900 | $62 | 44 |
| 1325 Witherspoon St | 0.50mi | 3/2.0 | 1,627 (+13%) | 15mo | $275,000 | $169 | 43 |
| 811 Ritchey St | 0.75mi | 3/2.0 | 1,250 (-13%) | 3mo | $235,000 | $188 | 41 |
| 227 Davis St | 0.71mi | 3/1.5 | 1,596 (+11%) | 17mo | $250,000 | $157 | 33 |
Match score weights: distance 35% · size 25% · config 20% · recency 20%. Top-matched comps best support the ARV.
Projected returns pro-forma
-3.0% appreciation · 3.0% rent growth · sell at horizon
- IRR
- 2.0%
- Equity multiple
- 1.08×
- Total profit
- $3,081
- Equity at exit
- $21,247
- IRR
- 11.6%
- Equity multiple
- 1.91×
- Total profit
- $36,490
- Equity at exit
- $12,321
Cash invested: $39,900 (down + closing). Projections, not guarantees.
Landlord ↔ Tenant lean methodology
- Overall (STATE)
- 87 Strongly Landlord-Friendly
- State Texas
- 87 Strongly Landlord-Friendly · R+5
- County
- — inherits STATE
- City
- — inherits STATE
ZIP-level market 76240
- Active inventory
- 462
- Price-to-rent
- 6.6×
Monthly cashflow live
- Estimated rent
- $1,789 high interval (Pro) →
- Mortgage (P&I)
- −$747
- Tax from tax record
- −$196 /mo · $2,354/yr
- Insurance
- −$59
- HOA
- −$0
- Vacancy / Maint / Mgmt
- −$376
- Net cashflow
- $410
Break-even live
UW: 25.0% down · 7.5% · 30yr · 1.5% tax · 5.0% vac · 8.0% maint · 8.0% mgmt
Financing live
Cash to close
- Down payment
- $35,625
- Closing costs
- $4,275
- Reserves months
- —
- Total cash needed
- —
Loan-product check · same deal, 3 products live
Conventional
25% down · 7.5% · 30yr
- Down + closing
- —
- Monthly P&I
- —
- Monthly cashflow
- —
- DSCR
- —
- Eligible?
- —
Personal DTI + credit; lowest rate.
DSCR
20% down · 8.5% · 30yr
- Down + closing
- —
- Monthly P&I
- —
- Monthly cashflow
- —
- DSCR
- —
- Eligible?
- —
No personal income docs; deal must DSCR.
Hard money
10% down · 12.0% · 12mo
- Down + closing
- —
- Monthly P&I
- —
- Monthly cashflow
- —
- DSCR
- —
- Eligible?
- —
Short-term bridge; refi at stabilization.
Rent comps 6 comps
| Address | Beds | Baths | Sqft | Rent | $/sqft | DOM | Units | Dist |
|---|---|---|---|---|---|---|---|---|
| 426 N Clements St Gainesville, TX | 3.0 | 2.0 | 1408 | $2,307 | $1.64 | 44d | 1 | 0.71mi |
| 1010 E Main St Gainesville, TX | 3.0 | 1.0 | 1263 | $1,550 | $1.23 | 44d | 1 | 0.72mi |
| 1610 Elizabeth St Gainesville, TX | 3.0 | 1.0 | 1100 | $1,500 | $1.36 | 44d | 1 | 0.92mi |
| 1331 Lanius St Gainesville, TX | 3.0 | 2.0 | 1300 | $1,850 | $1.42 | 44d | 1 | 1.17mi |
| 1000 Bella Vista Dr Gainesville, TX | 3.0 | 2.0 | 1150 | $1,536 | $1.34 | 44d | 1 | 1.20mi |
| 923 S Wine St Gainesville, TX | 3.0 | 1.0 | 1216 | $1,550 | $1.27 | 44d | 1 | 1.27mi |
Listing history 21 events
-
2026-06-19days on market $142,500 Active 57 DOM
-
2026-06-18days on market $142,500 Active 56 DOM
-
2026-06-17days on market $142,500 Active 55 DOM
-
2026-06-16days on market $142,500 Active 54 DOM
-
2026-06-15days on market $142,500 Active 53 DOM
-
2026-06-14days on market $142,500 Active 51 DOM
-
2026-06-12days on market $142,500 Active 50 DOM
-
2026-06-09days on market $142,500 Active 47 DOM
-
2026-06-08days on market $142,500 Active 46 DOM
-
2026-06-07days on market $142,500 Active 45 DOM
-
2026-06-05days on market $142,500 Active 42 DOM
-
2026-06-03days on market $142,500 Active 41 DOM
-
2026-06-02pricedays on market $142,500 Active 40 DOM
-
2026-06-01days on market $145,000 Active 39 DOM
-
2026-05-31days on market $145,000 Active 38 DOM
-
2026-05-30days on market $145,000 Active 37 DOM
-
2026-04-23$145,000 Active 180-char remark
-
2004-04-07soldstatus 208-char remark
Show marketing remark (208 chars)
Solid older home near downtown. Two floor furnaces, owner says they are functional. Two window units, go with property. Fenced back yard. Several mature trees. House is at end of dead end street. Low traffic.
-
2004-04-07soldstatus
Show marketing remark (208 chars)
Solid older home near downtown. Two floor furnaces, owner says they are functional. Two window units, go with property. Fenced back yard. Several mature trees. House is at end of dead end street. Low traffic.
-
2004-02-15historical 208-char remark
Show marketing remark (208 chars)
Solid older home near downtown. Two floor furnaces, owner says they are functional. Two window units, go with property. Fenced back yard. Several mature trees. House is at end of dead end street. Low traffic.
-
2003-12-31$35,000 208-char remark
Show marketing remark (208 chars)
Solid older home near downtown. Two floor furnaces, owner says they are functional. Two window units, go with property. Fenced back yard. Several mature trees. House is at end of dead end street. Low traffic.
ⓘ Source: listings_history table (triggers on properties + properties_extension) + one-shot
backfill from property_details.listing_events for pre-trigger history.
Tax reassessment forecast TX · Resets to sale price
- Current annual tax
- $2,354 · $196/mo
- Projected year-2 tax
- $2,608 · $217/mo
- Expected delta
- +$253/yr (+$21/mo · 10.8%)
ⓘ Screening estimate from a state-policy table — verify with the county assessor before closing.
Climate risk First Street
- Flood 1/10 Low FEMA zone X (unshaded) · 0% chance over 30 yrs
- Wildfire 7/10 Severe
- Heat 7/10 Severe 7 d/yr ≥110°F today · 21 d/yr by 30 yrs out
- Wind 4/10 Moderate 16% chance of damaging wind over 30 yrs
- Air quality 3/10 Moderate 3 unhealthy d/yr today · 4 by 30 yrs out
Nearby sold comps map
Loading sold comps map…
Walkable amenities ~0.75 mi
Loading nearby amenities…
Taxation est. · year 1
- Rental income
- $21,466
- − Mortgage interest
- −$7,982
- − Property taxes
- −$2,354
- − Insurance
- −$712
- − Repairs & maintenance
- −$1,717
- − Management
- −$1,717
- − Depreciation
- −$4,145
- Taxable income
- $2,837
- Est. tax owed @ 24.0%
- −$681
- After-tax cash flow
- $4,243/yr
For passive investors: Depreciation is non-cash, so a rental often shows a tax loss while cash-flowing — sheltering income. Rental losses are passive: they offset passive income freely, and up to $25,000/yr can offset ordinary (W-2) income if you actively participate and your MAGI is under $100k (phasing out to $0 by $150k); unused losses carry forward. On sale, claimed depreciation is recaptured at up to 25%, and gains may owe capital-gains tax (a 1031 exchange can defer both). Figures are a year-1 estimate at your 24.0% rate — not tax advice; consult a CPA.
Schools (NCES district)
- District
- Gainesville ISD
- NCES district ID
- 4820220
- Math proficiency
- 33% ▼ -9.00%
- Reading proficiency
- 29% ▼ -2.00%
- Median HH income
- $41,772
- Composite
- 26.27/100
- National rank
- #7252
- State rank
- #606 of 826 in TX
Livability — Gainesville
- Score
- 66/100
- State rank
- #602
- US rank
- #11445
Category grades
Schools grade is shown separately in the Schools card above.
Census & demographics
- Census place
- Gainesville, TX
- County
- Cooke County · 29,419 people
- City population
- 29,419
- Metro
- Gainesville, TX
- Population (ZIP)
- 29,419
- Household income
- $71,502
- Rent vs Own
- Severe rent burden
- 660.0
Population outlook (Cooke County) Hauer SSP2
- Today (2025)
- 39,965 people
- By 2030
- 39,974 · +0.0%
- By 2040
- 39,772 · -0.5%
- By 2050
- 39,258 · -1.8%
- By 2075
- 37,262 · -6.8%
- By 2100
- 33,363 · -16.5%
Race, ethnicity, and origin ACS 2023
- Neighborhood character
- Predominantly White (66%)
- Race & ethnicity
- White 66% Hispanic / Latino 24% Two or more races 14% Black 5%
- Hispanic origin (detail)
- Mexican 21%
- Common ancestry
- Serbian 2% Lithuanian 2% Slovak 1%
- Foreign-born
- 8% · Canada
- Languages at home
- 83% English-only · Spanish 16% Other Indo-European 1%
Political lean MEDSL · Cooke
- 2024 margin
- Solid R (+66.9) · D 16.2% · R 83.1%
- 2008→2024 swing
- -8.2pp toward R · 2008: -58.7pp · 2024: -66.9pp
- All cycles
- 2024: R+66.9 2020: R+65.2 2016: R+68.1 2012: R+67.6 2008: R+58.7
Not yet ingested
- Civics
- —
Market trends
- HPI YoY
- ▼ -198.63%
- Current HPI
- 247.3822
- Rent YoY
- —
- Metro
- Gainesville, TX
- State GDP YoY
- ▲ 3.95%
- F500 in state
- 110
Industry mix (Fortune 500 HQ in TX)
| Industry | F500 HQs | Revenue |
|---|---|---|
| Energy | 16 | $1,198B |
|
||
| Technology | 5 | $198B |
|
||
| Engineering / Construction | 4 | $72B |
|
||
| Energy Services | 3 | $60B |
|
||
| Utilities | 3 | $41B |
|
||
| Healthcare | 2 | $330B |
|
||
Price history
+307.1% since first listed6 events — show timeline
- 2026-06-02 Price Changed $142,500 NTREIS
- 2026-04-23 Listed $145,000 NTREIS
- 2004-04-07 Sold (Public Records) — Public Records
- 2004-04-07 Sold (MLS) — NTREIS
- 2004-02-15 Listing Removed — NTREIS
- 2003-12-31 Listed $35,000 NTREIS
Property tax history
+9.0%/yrLatest (2025): $2,354 · +15.1% YoY. Source: county tax records.
Cash-flow waterfall
monthlySold comps — $/sqft
last 12 mo · ≤1 miLoading sold comps…