 Multi-family
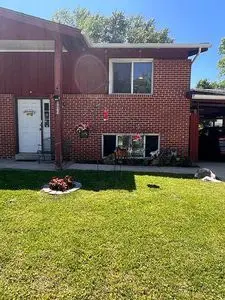
3411 Elm St · St. Charles, MO
Flood risk 1/10 · Minimal
- FEMA flood zone
- X (shaded)
- Chance of flooding over 30 yrs
- 0.0%
- Est. flood insurance / yr
- $473 – $860
Fire risk 1/10 · Minimal
- Est. fire insurance / yr
- $1,054 – $1,958
Heat risk 5/10 · Moderate
- Hot days now (above 106°F)
- 7 days/yr
- Hot days in 30 yrs
- 20 days/yr
Wind risk 2/10 · Minimal
- Chance of severe wind over 30 yrs
- 1.0%
Air-quality risk 3/10 · Minor
- Unhealthy air days now
- 2 days/yr
- Unhealthy air days in 30 yrs
- 3 days/yr
Risk factors via First Street. Map © Google.
Why this score? — see what drove the C+ grade
The composite is a weighted blend of 9 inputs, each scored 0–100. Each bar is that input's sub-score; the figure is the points it added to the 100-point composite (weight × sub-score).
- Cash flow +21.0/30.0
- ARV discount +15.0/15.0
- DSCR +6.7/10.0
- 1% rule +5.0/10.0
- Schools +4.1/10.0
- Rent growth +3.3/5.0
- Livability +2.5/5.0
- Condition / age +2.5/5.0
- Appreciation +0.0/10.0
$162,000
🖨 Deal sheet 📄 Offer letter ✓ Due diligence
Multi-family units
County records classify this as Multi-Family (2-4 Unit). Listing-text estimate: 1 unit. estimate disagrees with records
Listing remarks MLS
Location, Price, Location! 1/2 of Duplex that features 3 nice sized bedroom, one featuring a walk in closet, 1-1/2 baths, private fenced backyard with patio, and extra parking next to carport. The entire interior has been freshly painted and new flooring laid in living room. This property is moved in ready! Why rent when you can own! Pictures do not do justice - Must see in person!!!
Key facts
- Fenced yard
- Fenced backyard
- Built 1965
Tags
Neighborhood map
What this means for you Summary
Snapshot
- This is a 3-bed/1.5-bath multifamily listed at $162k.
Deal economics
- At list price, monthly cash flow is $227 ($3k/yr) — positive.
- The deal already cash-flows at list — no discount required.
- To meet the 1% rule (rent ≥ 1% of price), the offer needs to be $162k (0.0% below list).
- Recommended offer: $157k (3.0% below list) — sets the bar for market timing.
- Cap rate 8.0% vs local median 3.3% in St. Charles — top-decile yield for the area; either an underpriced asset or a hidden risk that comps aren't pricing in. Stress-test before assuming the spread holds.
Location & tenants
- Location reads: area grade C — affects rentability + tenant quality, not the cash-flow math above.
- St. Charles R-VI (urban): math 44% / reading 52% proficiency, ranked #51 of 324 in MO (top 16%) — families likely to look elsewhere, expect single-tenant / working-renter base with shorter leases.
- Market conditions: Rents rising (+3.2%/yr); 294 active listings in the ZIP; 4 comparable units currently listed for rent nearby; rentals leasing fast (median 5d on market — plan ~1-2 weeks tenant-placement turnaround); solid renter incomes; 2,021 units permitted in St. Charles County in 2024 (568 in 5+ unit buildings).
Forward outlook
- Local home prices are declining (-3.0%/yr); year-one equity from $1k of loan paydown is wiped out by about $5k of value loss. Plan a longer hold.
- St. Charles County population projected at +22% by 2050 — long-run rental-demand tailwind backs the buy-and-hold thesis.
Negotiation context
- It's been on market 36 days — a 3% lower offer ($157k) is reasonable based on typical stale-listing flexibility.
- 2 sale attempts since 10y ago with the ask held roughly flat each time — persistent listings suggest the price (not the market) is what's stuck; bring a comps-based counter.
- Current owner paid $105k; list at $162k implies a 54% gain — meaningful room to come down on a strong offer.
Risks & watch-outs
- Climate carrying-cost: extreme-heat days projected 7→20/yr by 2055 (HVAC capex compounding) — expect insurance premiums to compound above CPI over the hold.
Questions for the listing agent
- It's been on market 36 days. Have you received any prior offers? Is the seller open to a 3% concession, seller financing, or rate buy-down credit?
- Built in 1965 — when were the roof, HVAC, electrical panel, plumbing, and water heater last replaced?
- Is there a deadline driving the sale (1031 exchange, divorce, estate, relocation)? That informs how much negotiation room exists.
- What's the average days-on-market for RENTAL listings here right now (not sales)? A rising rental-DOM trend means longer vacancies and softer asking-rent achievability than the comps imply.
- What's the recent tenant-quality profile in this submarket — average credit score on applications, eviction rate, late-payment / NSF rate, and stable-employment percentage? A property-management company in the area should have these aggregated.
- How much new apartment / multifamily construction is in the pipeline within 1–3 miles? Heavy new supply (>2% of stock underway) typically softens rents 12–24 months out; light construction supports rent growth.
Investment metrics
- 1% rule
- 1.00% ✗
- Cap rate
- 7.98%
- Cash-on-cash
- 6.01%
- DSCR
- 1.27
- GRM
- 8.3
CMA / ARV
- ARV (median comp)
- $262,500
- List price
- $162,000
- Delta
- -38.29%
- Verdict
- UNDERPRICED
- Comps
- 2 within 2.0 mi
Projected returns pro-forma
-3.0% appreciation · 3.2% rent growth · sell at horizon
- IRR
- -6.8%
- Equity multiple
- 0.75×
- Total profit
- $-11,475
- Equity at exit
- $24,155
- IRR
- 3.0%
- Equity multiple
- 1.22×
- Total profit
- $9,912
- Equity at exit
- $14,007
Cash invested: $45,360 (down + closing). Projections, not guarantees.
Landlord ↔ Tenant lean methodology
- Overall (STATE)
- 81 Strongly Landlord-Friendly
- State Missouri
- 81 Strongly Landlord-Friendly · R+10
- County
- — inherits STATE
- City
- — inherits STATE
ZIP-level market 63301
- Rents YoY
- 3.2%
- Active inventory
- 294
- Price-to-rent
- 8.3×
Monthly cashflow live
- Estimated rent
- $1,619 medium interval (Pro) →
- Mortgage (P&I)
- −$850
- Tax from tax record
- −$135 /mo · $1,623/yr
- Insurance
- −$68
- HOA
- −$0
- Vacancy / Maint / Mgmt
- −$340
- Net cashflow
- $227
Break-even live
UW: 25.0% down · 7.5% · 30yr · 1.5% tax · 5.0% vac · 8.0% maint · 8.0% mgmt
Financing live
Cash to close
- Down payment
- $40,500
- Closing costs
- $4,860
- Reserves months
- —
- Total cash needed
- —
Loan-product check · same deal, 3 products live
Conventional
25% down · 7.5% · 30yr
- Down + closing
- —
- Monthly P&I
- —
- Monthly cashflow
- —
- DSCR
- —
- Eligible?
- —
Personal DTI + credit; lowest rate.
DSCR
20% down · 8.5% · 30yr
- Down + closing
- —
- Monthly P&I
- —
- Monthly cashflow
- —
- DSCR
- —
- Eligible?
- —
No personal income docs; deal must DSCR.
Hard money
10% down · 12.0% · 12mo
- Down + closing
- —
- Monthly P&I
- —
- Monthly cashflow
- —
- DSCR
- —
- Eligible?
- —
Short-term bridge; refi at stabilization.
Rent comps 4 comps
| Address | Beds | Baths | Sqft | Rent | $/sqft | DOM | Units | Dist |
|---|---|---|---|---|---|---|---|---|
| 236 S Cadillac Dr Saint Charles, MO | 3.0 | 1.0 | 864 | $1,600 | $1.85 | 4d | 1 | 1.21mi |
| 3313 Droste Rd Unit 3313 St Charles, MO | 2.0 | 1.5 | 850 | $1,450 | $1.71 | 2d | 1 | 1.22mi |
| 920 Parkcrest Dr Unit 920 St Charles, MO | 2.0 | 1.5 | 1000 | $1,400 | $1.40 | 16d | 1 | 1.28mi |
| 2680 Droste Rd St Charles, MO | 2.0 | 1.5 | 1260 | $1,715 | $1.36 | 1d | 2 | 1.29mi |
Listing history 24 events
-
2026-06-18days on market $162,000 Active 36 DOM
-
2026-06-17days on market $162,000 Active 35 DOM
-
2026-06-16days on market $162,000 Active 34 DOM
-
2026-06-15days on market $162,000 Active 33 DOM
-
2026-06-13days on market $162,000 Active 31 DOM
-
2026-06-13days on market $162,000 Active 30 DOM
-
2026-06-09days on market $162,000 Active 27 DOM
-
2026-06-08days on market $162,000 Active 26 DOM
-
2026-06-07days on market $162,000 Active 25 DOM
-
2026-06-05days on market $162,000 Active 22 DOM
-
2026-06-03days on market $162,000 Active 21 DOM
-
2026-06-02days on market $162,000 Active 20 DOM
-
2026-06-01days on market $162,000 Active 19 DOM
-
2026-05-31days on market $162,000 Active 18 DOM
-
2026-05-13$162,000 Active 569-char remark
-
2016-12-15soldstatus
-
2016-12-12soldstatus Closed 391-char remark
Show marketing remark (391 chars)
Location, Price, Location! 1/2 of Duplex that features 3 nice sized bedroom, one featuring a walk in closet, 1-1/2 baths, private fenced backyard with patio, and extra parking next to carport. The entire interior has been freshly painted and new flooring laid in living room. This property is moved in ready! Why rent when you can own! Pictures do not do justice - Must see in person!!!
-
2016-11-10status Pending 391-char remark
Show marketing remark (391 chars)
Location, Price, Location! 1/2 of Duplex that features 3 nice sized bedroom, one featuring a walk in closet, 1-1/2 baths, private fenced backyard with patio, and extra parking next to carport. The entire interior has been freshly painted and new flooring laid in living room. This property is moved in ready! Why rent when you can own! Pictures do not do justice - Must see in person!!!
-
2016-10-27$77,777 Active 391-char remark
Show marketing remark (391 chars)
Location, Price, Location! 1/2 of Duplex that features 3 nice sized bedroom, one featuring a walk in closet, 1-1/2 baths, private fenced backyard with patio, and extra parking next to carport. The entire interior has been freshly painted and new flooring laid in living room. This property is moved in ready! Why rent when you can own! Pictures do not do justice - Must see in person!!!
-
2006-01-03soldstatus $105,000
-
1994-09-01soldstatus $39,000
-
1991-04-01soldstatus
-
1990-03-01soldstatus $37,500
-
1985-02-01soldstatus
ⓘ Source: listings_history table (triggers on properties + properties_extension) + one-shot
backfill from property_details.listing_events for pre-trigger history.
Tax reassessment forecast MO · Resets to sale price
- Current annual tax
- $1,623 · $135/mo
- Projected year-2 tax
- $1,623 · $135/mo
- Expected delta
- $0/yr ($0/mo · 0.0%)
ⓘ Screening estimate from a state-policy table — verify with the county assessor before closing.
Climate risk First Street
- Flood 1/10 Low FEMA zone X (shaded) · 0% chance over 30 yrs
- Wildfire 1/10 Low
- Heat 5/10 Major 7 d/yr ≥106°F today · 20 d/yr by 30 yrs out
- Wind 2/10 Low 100% chance of damaging wind over 30 yrs
- Air quality 3/10 Moderate 2 unhealthy d/yr today · 3 by 30 yrs out
Nearby sold comps map
Loading sold comps map…
Walkable amenities ~0.75 mi
Loading nearby amenities…
Taxation est. · year 1
- Rental income
- $19,434
- − Mortgage interest
- −$9,075
- − Property taxes
- −$1,623
- − Insurance
- −$810
- − Repairs & maintenance
- −$1,555
- − Management
- −$1,555
- − Depreciation
- −$4,713
- Taxable income
- $105
- Est. tax owed @ 24.0%
- −$25
- After-tax cash flow
- $2,700/yr
For passive investors: Depreciation is non-cash, so a rental often shows a tax loss while cash-flowing — sheltering income. Rental losses are passive: they offset passive income freely, and up to $25,000/yr can offset ordinary (W-2) income if you actively participate and your MAGI is under $100k (phasing out to $0 by $150k); unused losses carry forward. On sale, claimed depreciation is recaptured at up to 25%, and gains may owe capital-gains tax (a 1031 exchange can defer both). Figures are a year-1 estimate at your 24.0% rate — not tax advice; consult a CPA.
Schools (NCES district)
- District
- St. Charles R-VI
- NCES district ID
- 2928920
- Math proficiency
- 44% ▼ -4.00%
- Reading proficiency
- 52% ▼ -1.00%
- Median HH income
- $52,897
- Composite
- 41.38/100
- National rank
- #3486
- State rank
- #51 of 324 in MO
Livability — St. Charles
No livability data for this city. (Only ~50 U.S. cities are tracked.)
Census & demographics
- Census place
- St. Charles, MO
- County
- Saint Charles County · 399,703 people
- Metro
- St. Louis, MO-IL
- Population (ZIP)
- 52,667
- Household income
- $85,308
- Rent vs Own
- Severe rent burden
- 1118.0
Population outlook (St. Charles County) Hauer SSP2
- Today (2025)
- 437,857 people
- By 2030
- 461,707 · +5.4%
- By 2040
- 503,222 · +14.9%
- By 2050
- 534,684 · +22.1%
- By 2075
- 597,047 · +36.4%
- By 2100
- 609,682 · +39.2%
Race, ethnicity, and origin ACS 2023
- Neighborhood character
- Predominantly White (80%)
- Race & ethnicity
- White 80% Black 7% Two or more races 7% Hispanic / Latino 7% Asian 2%
- Hispanic origin (detail)
- Mexican 4%
- Common ancestry
- Lithuanian 3% Romanian 2% Italian 2%
- Foreign-born
- 5% · Canada, Guatemala
- Languages at home
- 93% English-only · Spanish 4%
Political lean MEDSL · St. Charles
- 2024 margin
- R (+17.0) · D 40.8% · R 57.8% · Other 1.4%
- 2008→2024 swing
- -7.2pp toward R · 2008: -9.7pp · 2024: -17.0pp
- All cycles
- 2024: R+17.0 2020: R+17.5 2016: R+26.4 2012: R+21.0 2008: R+9.7
Not yet ingested
- Civics
- —
Market trends
- HPI YoY
- ▼ -289.53%
- Current HPI
- 221.0637
- Rent YoY
- ▲ 3.20%
- Metro
- St. Louis, MO-IL
- State GDP YoY
- ▲ 1.84%
- F500 in state
- 20
Industry mix (Fortune 500 HQ in MO)
| Industry | F500 HQs | Revenue |
|---|---|---|
| Healthcare | 1 | $163B |
|
||
| Insurance | 1 | $21B |
|
||
| Industrial Technology | 1 | $17B |
|
||
| Retail | 1 | $16B |
|
||
| Industrial Distribution | 1 | $10B |
|
||
| Utilities | 1 | $9B |
|
||
Price history
+332.0% since first listed10 events — show timeline
- 2026-05-13 Listed $162,000 FSBO.com
- 2016-12-15 Sold (Public Records) — Public Records
- 2016-12-12 Sold (MLS) — MARIS as Distributed by MLS Grid
- 2016-11-10 Pending — MARIS as Distributed by MLS Grid
- 2016-10-27 Listed $77,777 MARIS as Distributed by MLS Grid
- 2006-01-03 Sold (Public Records) $105,000 Public Records
- 1994-09-01 Sold (Public Records) $39,000 Public Records
- 1991-04-01 Sold (Public Records) — Public Records
- 1990-03-01 Sold (Public Records) $37,500 Public Records
- 1985-02-01 Sold (Public Records) — Public Records
Property tax history
+1.6%/yrLatest (2025): $1,623 · -2.0% YoY. Source: county tax records.
Cash-flow waterfall
monthlySold comps — $/sqft
last 12 mo · ≤1 miLoading sold comps…