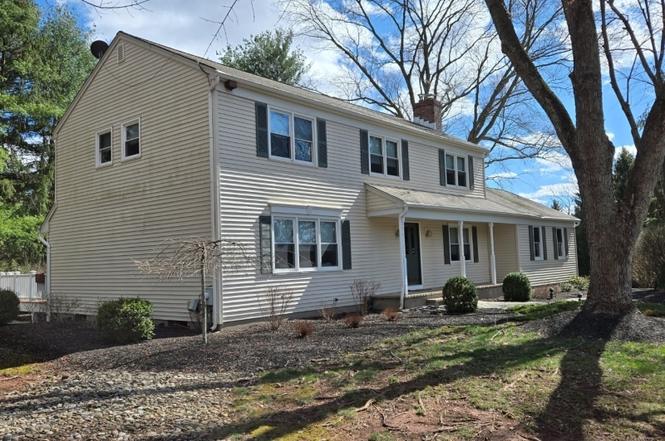
6 Betsy Ross Ct · Harlingen, NJ
Flood risk 1/10 · Minimal
- FEMA flood zone
- X (unshaded)
- Chance of flooding over 30 yrs
- 0.0%
- Est. flood insurance / yr
- $507 – $1,088
Fire risk 3/10 · Minor
- Est. fire insurance / yr
- $526 – $976
Heat risk 6/10 · Moderate
- Hot days now (above 100°F)
- 7 days/yr
- Hot days in 30 yrs
- 15 days/yr
Wind risk 6/10 · Moderate
- Chance of severe wind over 30 yrs
- 27.0%
Air-quality risk 4/10 · Minor
- Unhealthy air days now
- 3 days/yr
- Unhealthy air days in 30 yrs
- 5 days/yr
Risk factors via First Street. Map © Google.
Why this score? — see what drove the D+ grade
The composite is a weighted blend of 9 inputs, each scored 0–100. Each bar is that input's sub-score; the figure is the points it added to the 100-point composite (weight × sub-score).
- ARV discount +12.9/15.0
- Cash flow +7.8/30.0
- Schools +6.5/10.0
- Appreciation +5.0/10.0
- Livability +3.2/5.0
- 1% rule +2.8/10.0
- Rent growth +2.5/5.0
- Condition / age +2.5/5.0
- DSCR +1.9/10.0
$900,000
🖨 Deal sheet (PDF) 📄 Offer letter ✓ Due diligence
Listing remarks
This home is located at the end of a secluded cul-de-sac in a welcoming neighborhood within the prestigious township of Montgomery. The first-floor Bedroom Suite has the potential to serve as the primary bedroom w/ full bathroom/heated floor, while upstairs, another Primary Bedroom with a full bathroom and walk-in closet has the same possibilities. . Upstairs also includes three additional sizeable bedrooms with another full bathroom and plenty of closet space. The finished basement offers additional functional space to serve a range of activities. The leisure room's wood-burning fireplace, complete with a custom mantle, creates an eye-catching focal point and both a Formal Dining and Livin
Key facts
- 1.02 acre lot
- 2 garage spots
- Built 1977
Neighborhood map
What this means for you Summary
Snapshot
- This is a 5-bed/3.5-bath single-family listed at $900k.
Deal economics
- At list price, monthly cash flow is $-998 ($-12k/yr) — negative.
- To cash-flow at today's rent, offer at most $724k (19.6% below list).
- To meet the 1% rule (rent ≥ 1% of price), the offer needs to be $700k (22.2% below list).
- Recommended offer: $700k (22.2% below list) — sets the bar for 1% rule.
Location & tenants
- Location reads 64/100 on livability (#409 in NJ) — a middle-class / working-renter tenant base. Strengths: crime A+, employment A+, housing A+; Watch: amenities F, commute F, cost of living F.
- Montgomery Township School District (rural): math 59% / reading 71% proficiency, ranked #15 of 472 in NJ (top 3%) — acceptable for families but not a draw, mixed tenant base, ~2y average lease; only 3% free/reduced lunch — higher-income household profile.
- Zoned schools: Orchard Hill Elementary School (813 students, 6% FRL); Montgomery Upper Middle School (math 55% / reading 77%, grade A-, #19 of 431 statewide, top 5%, 790 students, 5% FRL); Montgomery High School (math 52% / reading 75%, grade B-, #47 of 399 statewide, top 12%, 1,603 students, 4% FRL) — zoned schools at 5% FRL track the district average.
- Market conditions: 1 active listings in the ZIP; 1 comparable units currently listed for rent nearby; 678 units permitted in Somerset County in 2024 (296 in 5+ unit buildings).
Forward outlook
- In year one you build about $33k of equity ($6k loan paydown + $27k appreciation (3.0% local appreciation)).
- Somerset County population projected at +13% by 2050 — modest demand growth; plan on rents tracking national, not racing it.
- By year 2, paydown + projected appreciation supports a ~$54k cash-out refi (75% LTV) — recoverable capital for the next deal without selling this one.
Negotiation context
- It's been on market 18 days — a 2% lower offer ($886k) is reasonable based on typical stale-listing flexibility.
- 2 sale attempts since 2y ago with the ask held roughly flat each time — persistent listings suggest the price (not the market) is what's stuck; bring a comps-based counter.
Risks & watch-outs
- Climate carrying-cost: major wind risk, 27% chance of damaging wind over 30y; extreme-heat days projected 7→15/yr by 2055 (HVAC capex compounding) — expect insurance premiums to compound above CPI over the hold.
Questions for the listing agent
- What do current leases actually rent for vs. the listed asking? Can we see a recent rent roll and the last 12 months of T-12 income?
- Built in 1977 — when were the roof, HVAC, electrical panel, plumbing, and water heater last replaced?
- Is there a deadline driving the sale (1031 exchange, divorce, estate, relocation)? That informs how much negotiation room exists.
- The area grade is low — what's the realistic commute time and amenity access for the typical tenant pool here? Any planned neighborhood developments (good or bad) we should know about?
- What's the average days-on-market for RENTAL listings here right now (not sales)? A rising rental-DOM trend means longer vacancies and softer asking-rent achievability than the comps imply.
- What's the recent tenant-quality profile in this submarket — average credit score on applications, eviction rate, late-payment / NSF rate, and stable-employment percentage? A property-management company in the area should have these aggregated.
- How much new for-sale + rental construction is in the pipeline within 1–3 miles? Heavy new supply typically softens prices + rents 12–24 months out; constrained supply supports both.
Investment metrics
- 1% rule
- 0.78% ✗
- Cap rate
- 4.96%
- Cash-on-cash
- -4.75%
- DSCR
- 0.79
- GRM
- 10.7
CMA / ARV
- ARV (on-the-fly)
- $1,023,624
- Comps found
- 2
Show comp detail 2 sales within ~0.75 mi
| Address | Dist | Beds/Ba | Sqft | Sold | Price | $/sf | Match |
|---|---|---|---|---|---|---|---|
| 77 Meadow Run Dr | 0.33mi | 5/3.0 | 2,632 (-3%) | 2mo | $995,000 | $378 | 77 |
| 180 Orchard Rd | 0.30mi | 4/3.5 (-1) | 2,912 (+8%) | 18mo | $830,000 | $285 | 53 |
Match score weights: distance 35% · size 25% · config 20% · recency 20%. Top-matched comps best support the ARV.
Projected returns pro-forma
3.0% appreciation · 3.0% rent growth · sell at horizon
- IRR
- 3.1%
- Equity multiple
- 1.18×
- Total profit
- $45,181
- Equity at exit
- $404,679
- IRR
- 6.5%
- Equity multiple
- 1.99×
- Total profit
- $250,423
- Equity at exit
- $623,659
Cash invested: $252,000 (down + closing). Projections, not guarantees.
Landlord ↔ Tenant lean methodology
- Overall (STATE)
- 21 Tenant-Leaning
- State New Jersey
- 21 Tenant-Leaning · D+6
- County
- — inherits STATE
- City
- — inherits STATE
ZIP-level market 08558-1701
- Active inventory
- 1
- Price-to-rent
- 10.7×
Monthly cashflow live
- Estimated rent
- $7,000 medium interval (Pro) →
- Mortgage (P&I)
- −$4,720
- Tax from tax record
- −$1,433 /mo · $17,194/yr
- Insurance
- −$375
- HOA
- −$0
- Vacancy / Maint / Mgmt
- −$1,470
- Net cashflow
- $-998
Break-even live
Sensitivity live
| Price | -10% $-488 | -5% $-743 | +0% $-998 | +5% $-1,252 | +10% $-1,507 |
|---|---|---|---|---|---|
| Rent | -10% $-1,551 | -5% $-1,274 | +0% $-998 | +5% $-721 | +10% $-445 |
| Rate | -1.0pp $-544 | -0.5pp $-769 | base $-998 | +0.5pp $-1,231 | +1.0pp $-1,468 |
UW: 25.0% down · 7.5% · 30yr · 1.5% tax · 5.0% vac · 8.0% maint · 8.0% mgmt
Financing live
Cash to close
- Down payment
- $225,000
- Closing costs
- $27,000
- Reserves months
- —
- Total cash needed
- —
Loan-product check · same deal, 3 products live
Conventional
25% down · 7.5% · 30yr
- Down + closing
- —
- Monthly P&I
- —
- Monthly cashflow
- —
- DSCR
- —
- Eligible?
- —
Personal DTI + credit; lowest rate.
DSCR
20% down · 8.5% · 30yr
- Down + closing
- —
- Monthly P&I
- —
- Monthly cashflow
- —
- DSCR
- —
- Eligible?
- —
No personal income docs; deal must DSCR.
Hard money
10% down · 12.0% · 12mo
- Down + closing
- —
- Monthly P&I
- —
- Monthly cashflow
- —
- DSCR
- —
- Eligible?
- —
Short-term bridge; refi at stabilization.
Rent comps 1 comps
| Address | Beds | Baths | Sqft | Rent | $/sqft | DOM | Units | Dist |
|---|---|---|---|---|---|---|---|---|
| 2 Liam Pl Skillman, NJ | 6.0 | 6.5 | 3545 | $7,000 | $1.97 | 45d | 1 | 0.91mi |
Listing history 6 events
-
2026-04-01status Under Contract
-
2026-03-19price $900,000
-
2026-03-14$925,000 Active
-
2026-03-10historical $925,000
-
2024-10-23historical
-
2024-07-08$850,000 Active
ⓘ Source: listings_history table (triggers on properties + properties_extension) + one-shot
backfill from property_details.listing_events for pre-trigger history.
Tax reassessment forecast NJ · Partial reset (capped growth)
- Current annual tax
- $17,194 · $1,433/mo
- Projected year-2 tax
- $19,802 · $1,650/mo
- Expected delta
- +$2,608/yr (+$217/mo · 15.2%)
ⓘ Screening estimate from a state-policy table — verify with the county assessor before closing.
Climate risk First Street
- Flood 1/10 Low FEMA zone X (unshaded) · 0% chance over 30 yrs
- Wildfire 3/10 Moderate
- Heat 6/10 Major 7 d/yr ≥100°F today · 15 d/yr by 30 yrs out
- Wind 6/10 Major 27% chance of damaging wind over 30 yrs
- Air quality 4/10 Moderate 3 unhealthy d/yr today · 5 by 30 yrs out
Nearby sold comps map
Loading sold comps map…
Walkable amenities ~0.75 mi
Loading nearby amenities…
Taxation est. · year 1
- Rental income
- $84,000
- − Mortgage interest
- −$50,414
- − Property taxes
- −$17,194
- − Insurance
- −$4,500
- − Repairs & maintenance
- −$6,720
- − Management
- −$6,720
- − Depreciation
- −$26,182
- Taxable loss
- −$27,730
- Est. tax savings @ 24.0%
- +$6,655
- After-tax cash flow
- $-5,315/yr
For passive investors: Depreciation is non-cash, so a rental often shows a tax loss while cash-flowing — sheltering income. Rental losses are passive: they offset passive income freely, and up to $25,000/yr can offset ordinary (W-2) income if you actively participate and your MAGI is under $100k (phasing out to $0 by $150k); unused losses carry forward. On sale, claimed depreciation is recaptured at up to 25%, and gains may owe capital-gains tax (a 1031 exchange can defer both). Figures are a year-1 estimate at your 24.0% rate — not tax advice; consult a CPA.
Schools (NCES district)
- District
- Montgomery Township School District
- NCES district ID
- 3410590
- Math proficiency
- 59% ▼ -17.00%
- Reading proficiency
- 71% ▼ -7.00%
- Median HH income
- $152,313
- Composite
- 64.96/100
- National rank
- #506
- State rank
- #15 of 472 in NJ
Livability — Harlingen
- Score
- 64/100
- State rank
- #409
- US rank
- #14268
Category grades
Schools grade is shown separately in the Schools card above.
Census & demographics
No demographic data for this ZIP.
Market trends
- HPI YoY
- —
- Current HPI
- —
- Rent YoY
- —
- Metro
- —
- State GDP YoY
- ▲ 2.05%
- F500 in state
- 34
Industry mix (Fortune 500 HQ in NJ)
| Industry | F500 HQs | Revenue |
|---|---|---|
| Consumer Goods | 3 | $31B |
|
||
| Pharmaceuticals | 2 | $153B |
|
||
| Technology | 2 | $21B |
|
||
| Insurance | 2 | $20B |
|
||
| Healthcare | 2 | $19B |
|
||
| Financial Services | 1 | $70B |
|
||
Price history
+5.9% since first listed6 events — show timeline
- 2026-04-01 Pending — GSMLS
- 2026-03-19 Price Changed $900,000 GSMLS
- 2026-03-14 Listed $925,000 GSMLS
- 2026-03-10 Coming Soon $925,000 GSMLS
- 2024-10-23 Listing Removed — BRIGHT MLS
- 2024-07-08 Listed $850,000 BRIGHT MLS
Property tax history
+1.8%/yrLatest (2025): $17,194 · +1.8% YoY. Source: county tax records.
Cash-flow waterfall
monthlySold comps — $/sqft
last 12 mo · ≤1 miLoading sold comps…