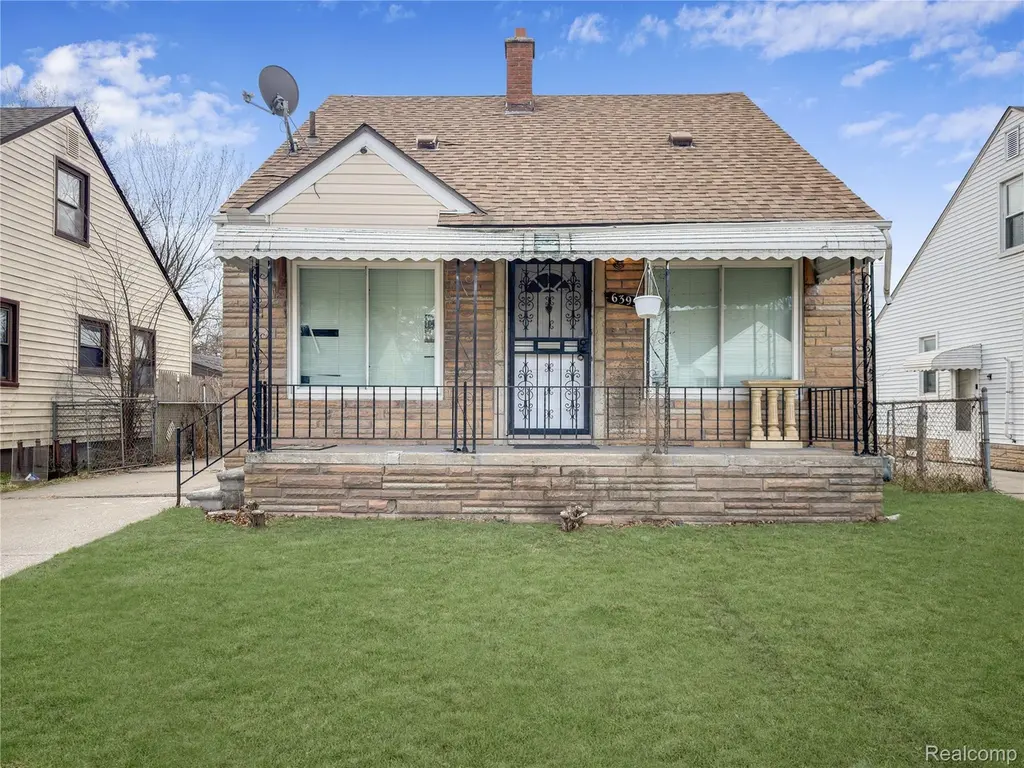
6395 Stahelin Ave · Detroit, MI
Flood risk 1/10 · Minimal
- FEMA flood zone
- X (unshaded)
- Chance of flooding over 30 yrs
- 0.0%
- Est. flood insurance / yr
- $473 – $860
Fire risk 1/10 · Minimal
- Est. fire insurance / yr
- $784 – $1,456
Heat risk 3/10 · Minor
- Hot days now (above 97°F)
- 7 days/yr
- Hot days in 30 yrs
- 15 days/yr
Wind risk 2/10 · Minimal
- Chance of severe wind over 30 yrs
- —
Air-quality risk 3/10 · Minor
- Unhealthy air days now
- 2 days/yr
- Unhealthy air days in 30 yrs
- 4 days/yr
Risk factors via First Street. Map © Google.
Why this score? — see what drove the D- grade
The composite is a weighted blend of 9 inputs, each scored 0–100. Each bar is that input's sub-score; the figure is the points it added to the 100-point composite (weight × sub-score).
- Cash flow +18.0/30.0
- DSCR +5.7/10.0
- 1% rule +5.2/10.0
- Livability +3.7/5.0
- Condition / age +2.5/5.0
- Rent growth +1.9/5.0
- Schools +1.3/10.0
- ARV discount +0.0/15.0
- Appreciation +0.0/10.0
$139,999
🖨 Deal sheet 📄 Offer letter ✓ Due diligence
Listing remarks MLS
BEAUTIFULLY UPDATED AND MOVE-IN READY BUNGALOW OFFERING 1,100 SQ FT OF COMFORTABLE LIVING SPACE. THIS HOME FEATURES 3 SPACIOUS BEDROOMS AND A 2-CAR DETACHED GARAGE. RECENTLY RENOVATED FROM TOP TO BOTTOM, INCLUDING A BRAND-NEW 3D ROOF, NEW WINDOWS, UPDATED KITCHEN, AND A FULLY REMODELED BATHROOM. ENJOY NEW FLOORING THROUGHOUT AND FRESH PAINT THAT GIVES THE HOME A MODERN, CLEAN FEEL. THE FINISHED BASEMENT ADDS EXTRA LIVING SPACE, PERFECT FOR ENTERTAINING, A HOME OFFICE, OR ADDITIONAL STORAGE. A TRULY TURN-KEY HOME WITH QUALITY UPDATES THROUGHOUT. ALL DATA & MEASUREMENTS ARE APPROXIMATE & NOT GUARANTEED BY THE BUYER TO VERIFY ALL INFO & DATA. SHOWINGS ARE BY APPOINTMENT ONLY. PLEASE DO NOT APPROACH THE HOME WITHOUT A CONFIRMED APPOINTMENT. PLEASE DO NOT DISCUSS OFFERS WITH THE SELLER. PLEASE CONTACT A LICENSEE AGENT OR LISTENING OFFICE TO SCHEDULE A SHOWING.
Key facts
- New flooring
- Finished basement
- Updated kitchen
Tags
Property features AI
Exterior
- Parking: Detached 2-car garage
- Utilities: Public water; Public sewer
- Home design: Single-family residence; One and one-half story; Ground-level entry with steps
- Construction: Aluminum siding; Block foundation
- Exterior features: Paved road access; Lot approximately 0.11 acres (40 x 124)
Interior
- Bathrooms: 1 full bathroom
- Heating & cooling: Forced air heating (natural gas); No central cooling
- Interior features: Finished basement; Total of 6 rooms
Neighborhood map
What this means for you Summary
Snapshot
- This is a 3-bed/1.0-bath single-family listed at $140k.
Deal economics
- At list price, monthly cash flow is $121 ($1k/yr) — positive.
- The deal already cash-flows at list — no discount required.
- Meets the 1% rule at list price ($1k rent vs $140k).
- Cap rate 7.3% vs local median 10.2% in Detroit — below-typical yield; the buyer is paying a premium for something (appreciation thesis, condition, location) that the cap rate doesn't capture.
Location & tenants
- Location reads 73/100 on livability (#218 in MI) — a middle-class / working-renter tenant base. Strengths: amenities A+, commute A+, cost of living A+; Watch: schools F, crime F, employment F.
- Detroit Public Schools Community District (urban): math 10% / reading 24% proficiency, ranked #499 of 540 in MI (top 92%) — low school quality limits family demand, transient renter base, plan for 1-2y turnover; 90% free/reduced lunch — lower-income household profile, screen leases tightly.
- Market conditions: Rents soft (-2.3%/yr); 363 active listings in the ZIP; 19 comparable units currently listed for rent nearby; rentals at typical pace (median 17d on market — plan ~3-4 weeks tenant-placement turnaround); lower-income renter base — watch delinquency; 2,639 units permitted in Wayne County in 2024 (1,216 in 5+ unit buildings).
- At $1,432/mo this rent would consume 56% of the median local household income ($31k/yr) (locally 4144% of renters already pay >50% of income on rent) — very limited rent-growth headroom before tenants either downsize or default.
Forward outlook
- Local home prices are declining (-3.0%/yr); year-one equity from $968 of loan paydown is wiped out by about $4k of value loss. Plan a longer hold.
- Wayne County population projected at -17% by 2050 — secular population decline; favor cash flow + early exit over multi-decade hold.
Negotiation context
- Only 11 days on market — expect competitive offers; lowballing is unlikely to land.
- 22 sale attempts since 25y ago with the ask held roughly flat each time — persistent listings suggest the price (not the market) is what's stuck; bring a comps-based counter.
- Current owner paid $100k; 40% above their basis — modest negotiation headroom, anchor on the comps not their cost.
Risks & watch-outs
- Watch-outs: built in 1949 — expect roof / HVAC / electrical / plumbing capex.
Questions for the listing agent
- Built in 1949 — when were the roof, HVAC, electrical panel, plumbing, and water heater last replaced?
- Is there a deadline driving the sale (1031 exchange, divorce, estate, relocation)? That informs how much negotiation room exists.
- Schools are F-rated, which usually means shorter tenancies and higher turnover. Who's the typical renter profile here, and what's been the actual vacancy rate?
- Crime grade is F in this area — have there been break-ins, vandalism, or insurance claims at this property in the last 3 years? What carrier currently insures it and at what premium?
- The area grade is low — what's the realistic commute time and amenity access for the typical tenant pool here? Any planned neighborhood developments (good or bad) we should know about?
- What's the average days-on-market for RENTAL listings here right now (not sales)? A rising rental-DOM trend means longer vacancies and softer asking-rent achievability than the comps imply.
- What's the recent tenant-quality profile in this submarket — average credit score on applications, eviction rate, late-payment / NSF rate, and stable-employment percentage? A property-management company in the area should have these aggregated.
- How much new for-sale + rental construction is in the pipeline within 1–3 miles? Heavy new supply typically softens prices + rents 12–24 months out; constrained supply supports both.
Investment metrics
- 1% rule
- 1.02% ✓
- Cap rate
- 7.33%
- Cash-on-cash
- 3.71%
- DSCR
- 1.17
- GRM
- 8.1
CMA / ARV
- ARV (median comp)
- $93,718
- List price
- $139,999
- Delta
- 54.72%
- Verdict
- OVERPRICED
- Comps
- 20 within 1.0 mi
Show comp detail 12 sales within ~0.75 mi
| Address | Dist | Beds/Ba | Sqft | Sold | Price | $/sf | Match |
|---|---|---|---|---|---|---|---|
| 6427 Artesian St | 0.08mi | 3/1.0 | 1,118 (-3%) | 0mo | $100,000 | $89 | 91 |
| 6300 Penrod St | 0.28mi | 4/1.0 (+1) | 1,080 (-6%) | 1mo | $78,000 | $72 | 70 |
| 6849 Rosemont Ave | 0.43mi | 3/1.0 | 1,211 (+5%) | 2mo | $100,000 | $83 | 70 |
| 6712 Artesian St | 0.18mi | 3/1.0 | 1,000 (-13%) | 1mo | $97,500 | $98 | 69 |
| 7346 Stahelin Ave | 0.56mi | 3/1.0 | 1,175 (+2%) | 4mo | $73,000 | $62 | 67 |
| 6120 Stahelin Ave | 0.26mi | 3/1.0 | 1,291 (+12%) | 3mo | $70,000 | $54 | 66 |
| 6229 Faust Ave | 0.24mi | 2/1.5 (-1) | 1,300 (+13%) | 2mo | $95,500 | $73 | 59 |
| 6417 Auburn St | 0.44mi | 3/1.0 | 1,000 (-13%) | 4mo | $95,000 | $95 | 54 |
| 6782 Evergreen Ave | 0.59mi | 3/1.0 | 1,041 (-10%) | 3mo | $120,000 | $115 | 54 |
| 7633 Faust Ave | 0.72mi | 3/1.0 | 1,045 (-9%) | 3mo | $60,000 | $57 | 49 |
| 7391 Ashton Ave | 0.70mi | 3/1.0 | 1,023 (-11%) | 3mo | $40,000 | $39 | 46 |
| 7425 Stahelin Ave | 0.63mi | 3/1.0 | 1,000 (-13%) | 4mo | $37,000 | $37 | 46 |
Match score weights: distance 35% · size 25% · config 20% · recency 20%. Top-matched comps best support the ARV.
Projected returns pro-forma
-3.0% appreciation · 0.0% rent growth · sell at horizon
- IRR
- -14.0%
- Equity multiple
- 0.51×
- Total profit
- $-19,119
- Equity at exit
- $20,874
- IRR
- -11.2%
- Equity multiple
- 0.42×
- Total profit
- $-22,739
- Equity at exit
- $12,105
Cash invested: $39,200 (down + closing). Projections, not guarantees.
Landlord ↔ Tenant lean methodology
- Overall (STATE)
- 62 Landlord-Friendly
- State Michigan
- 62 Landlord-Friendly · EVEN
- County
- — inherits STATE
- City
- — inherits STATE
ZIP-level market 48228
- Rents YoY
- -2.3%
- Active inventory
- 363
- Price-to-rent
- 8.1×
Monthly cashflow live
- Estimated rent
- $1,432 high interval (Pro) →
- Mortgage (P&I)
- −$734
- Tax from tax record
- −$218 /mo · $2,613/yr
- Insurance
- −$58
- HOA
- −$0
- Vacancy / Maint / Mgmt
- −$301
- Net cashflow
- $121
Break-even live
UW: 25.0% down · 7.5% · 30yr · 1.5% tax · 5.0% vac · 8.0% maint · 8.0% mgmt
Financing live
Cash to close
- Down payment
- $35,000
- Closing costs
- $4,200
- Reserves months
- —
- Total cash needed
- —
Loan-product check · same deal, 3 products live
Conventional
25% down · 7.5% · 30yr
- Down + closing
- —
- Monthly P&I
- —
- Monthly cashflow
- —
- DSCR
- —
- Eligible?
- —
Personal DTI + credit; lowest rate.
DSCR
20% down · 8.5% · 30yr
- Down + closing
- —
- Monthly P&I
- —
- Monthly cashflow
- —
- DSCR
- —
- Eligible?
- —
No personal income docs; deal must DSCR.
Hard money
10% down · 12.0% · 12mo
- Down + closing
- —
- Monthly P&I
- —
- Monthly cashflow
- —
- DSCR
- —
- Eligible?
- —
Short-term bridge; refi at stabilization.
Rent comps 19 comps
| Address | Beds | Baths | Sqft | Rent | $/sqft | DOM | Units | Dist |
|---|---|---|---|---|---|---|---|---|
| 6490 Stahelin Ave Detroit, MI | 3.0 | 1.0 | 960 | $1,299 | $1.35 | 16d | 1 | 0.12mi |
| 5777 Southfield Fwy Detroit, MI | 2.0 | 1.0–2.0 | 667 | $1,540 | $2.31 | 3d | 10 | 0.44mi |
| 5965 Evergreen Rd Dearborn Heights, MI | 1.0–2.0 | 1.0 | 825 | $1,350 | $1.64 | 5d | 1 | 0.66mi |
| 6761 Memorial Ave Detroit, MI | 3.0 | 1.0 | 1060 | $1,100 | $1.04 | 24d | 1 | 0.71mi |
| 5521 Fairlane Woods Dr Dearborn, MI | 1.0–3.0 | 1.0–2.0 | 1164 | $2,430 | $2.09 | 1d | 12 | 0.74mi |
| 20571 Brooklawn Dr Dearborn Heights, MI | 3.0 | 2.0 | 1254 | $1,850 | $1.48 | 43d | 1 | 0.85mi |
| 6874 Country Ln Dearborn Heights, MI | 2.0 | 1.5 | 1400 | $1,500 | $1.07 | 43d | 1 | 0.89mi |
| 7411 Stout St Detroit, MI | 3.0 | 1.0 | 888 | $1,428 | $1.61 | 12d | 1 | 1.01mi |
| 7265 Braile St Detroit, MI | 3.0 | 1.0 | 1200 | $1,499 | $1.25 | 24d | 1 | 1.03mi |
| 6474 Saint Marys St Detroit, MI | 3.0 | 1.0 | 1237 | $1,350 | $1.09 | 43d | 1 | 1.07mi |
| 7794 Vaughan St Detroit, MI | 3.0 | 1.0 | 1000 | $1,450 | $1.45 | 16d | 1 | 1.08mi |
| 8262 Rosemont Ave Detroit, MI | 3.0 | 1.0 | 836 | $1,200 | $1.44 | 4d | 1 | 1.16mi |
| 20431 Tireman St Detroit, MI | 3.0 | 1.0 | 1020 | $1,350 | $1.32 | 17d | 1 | 1.22mi |
| 7312 Mansfield St Detroit, MI | 4.0 | 1.0 | 1300 | $1,400 | $1.08 | 16d | 1 | 1.26mi |
| 8451 Rosemont Ave Detroit, MI | 3.0 | 1.0 | 867 | $1,150 | $1.33 | 43d | 1 | 1.27mi |
| 7419 Rutherford St Detroit, MI | 2.0 | 1.0 | 981 | $1,150 | $1.17 | 14d | 1 | 1.31mi |
| 8283 Vaughan St Detroit, MI | 3.0 | 1.0 | 1058 | $1,294 | $1.22 | 4d | 1 | 1.32mi |
| 4900 Heather Dr Dearborn, MI | 1.0–2.0 | 1.0–2.0 | 921 | $1,980 | $2.15 | 1d | 1 | 1.41mi |
| 19301 Joy Rd Apt 1 Detroit, MI | 2.0 | 1.0 | 750 | $1,100 | $1.47 | 43d | 1 | 1.44mi |
Listing history 50 events
-
2026-06-18days on market $139,999 Active 11 DOM
-
2026-06-17days on market $139,999 Active 10 DOM
-
2026-06-16days on market $139,999 Active 9 DOM
-
2026-06-15days on market $139,999 Active 8 DOM
-
2026-06-13days on market $139,999 Active 6 DOM
-
2026-06-13days on market $139,999 Active 5 DOM
-
2026-06-09days on market $139,999 Active 2 DOM
-
2026-06-08pricedays on market $139,999 Active 1 DOM
-
2026-06-04days on market $139,900 Active 17 DOM
-
2026-06-03days on market $139,900 Active 16 DOM
-
2026-06-02days on market $139,900 Active 15 DOM
-
2026-06-01days on market $139,900 Active 14 DOM
-
2026-05-31days on market $139,900 Active 13 DOM
-
2026-05-19historical
-
2026-05-19historical
-
2026-05-18$139,900 Active
-
2026-05-02historical
-
2026-05-02historical
-
2026-05-01$144,999 Active
-
2026-05-01$144,999 Active
-
2026-04-14historical
-
2026-04-14historical
-
2026-04-13$148,999 Active
-
2026-04-13$148,999 Active
-
2026-03-18$149,900 Active
-
2026-03-18$149,900 Active
-
2024-04-03soldstatus $100,000
-
2023-03-03soldstatus $66,000 Sold
-
2023-03-03soldstatus $66,000 Closed
-
2023-02-23status Pending
-
2023-02-23status Pending
-
2023-01-23$109,900 Active
-
2023-01-23$109,900 Active
-
2020-10-27soldstatus $23,000 Sold
-
2020-10-27soldstatus $23,000 Closed
-
2020-10-26status Pending
-
2020-10-26status Pending
-
2020-10-26Keep Showing-Contgcy Appl
-
2020-10-26historical Contingent - Continue To Show
-
2020-10-26$23,000 Active
-
2020-10-26$23,000
-
2014-10-16soldstatus $9,200
-
2014-10-16soldstatus $9,200
-
2014-08-21$12,000
-
2014-08-21$12,000
-
2013-12-09historical
-
2013-12-09historical
-
2013-11-15$9,900
-
2013-11-15$9,900
-
2013-11-15historical
ⓘ Source: listings_history table (triggers on properties + properties_extension) + one-shot
backfill from property_details.listing_events for pre-trigger history.
Tax reassessment forecast MI · Partial reset (capped growth)
- Current annual tax
- $2,613 · $218/mo
- Projected year-2 tax
- $2,613 · $218/mo
- Expected delta
- $0/yr ($0/mo · 0.0%)
ⓘ Screening estimate from a state-policy table — verify with the county assessor before closing.
Climate risk First Street
- Flood 1/10 Low FEMA zone X (unshaded) · 0% chance over 30 yrs
- Wildfire 1/10 Low
- Heat 3/10 Moderate 7 d/yr ≥97°F today · 15 d/yr by 30 yrs out
- Wind 2/10 Low
- Air quality 3/10 Moderate 2 unhealthy d/yr today · 4 by 30 yrs out
Nearby sold comps map
Loading sold comps map…
Walkable amenities ~0.75 mi
Loading nearby amenities…
Taxation est. · year 1
- Rental income
- $17,186
- − Mortgage interest
- −$7,842
- − Property taxes
- −$2,613
- − Insurance
- −$700
- − Repairs & maintenance
- −$1,375
- − Management
- −$1,375
- − Depreciation
- −$4,073
- Taxable loss
- −$792
- Est. tax savings @ 24.0%
- +$190
- After-tax cash flow
- $1,644/yr
For passive investors: Depreciation is non-cash, so a rental often shows a tax loss while cash-flowing — sheltering income. Rental losses are passive: they offset passive income freely, and up to $25,000/yr can offset ordinary (W-2) income if you actively participate and your MAGI is under $100k (phasing out to $0 by $150k); unused losses carry forward. On sale, claimed depreciation is recaptured at up to 25%, and gains may owe capital-gains tax (a 1031 exchange can defer both). Figures are a year-1 estimate at your 24.0% rate — not tax advice; consult a CPA.
Schools (NCES district)
- District
- Detroit Public Schools Community District
- NCES district ID
- 2601103
- Math proficiency
- 10% ▼ -2.00%
- Reading proficiency
- 24% ▲ 6.00%
- Median HH income
- $25,815
- Composite
- 13.06/100
- National rank
- #9564
- State rank
- #499 of 540 in MI
Livability — Detroit
- Score
- 73/100
- State rank
- #218
- US rank
- #5427
Category grades
Schools grade is shown separately in the Schools card above.
Census & demographics
- Census place
- Detroit, MI
- County
- Wayne County · 1,562,939 people
- City population
- 572,865
- Metro
- Detroit-Warren-Dearborn, MI
- Population (ZIP)
- 50,117
- Household income
- $30,680
- Rent vs Own
- Severe rent burden
- 4144.0
Population outlook (Wayne County) Hauer SSP2
- Today (2025)
- 1,675,273 people
- By 2030
- 1,620,300 · -3.3%
- By 2040
- 1,502,341 · -10.3%
- By 2050
- 1,384,039 · -17.4%
- By 2075
- 1,124,592 · -32.9%
- By 2100
- 881,193 · -47.4%
Race, ethnicity, and origin ACS 2023
- Neighborhood character
- Predominantly Black (71%)
- Race & ethnicity
- Black 71% White 16% Two or more races 7% Hispanic / Latino 6%
- Hispanic origin (detail)
- Mexican 3% Puerto Rican 2%
- Common ancestry
- Arab 2% Romanian 2% Lithuanian 1%
- Foreign-born
- 11% · Canada
- Languages at home
- 82% English-only · Arabic 11% Spanish 5%
Political lean MEDSL · Wayne
- 2024 margin
- Strong D (+29.0) · D 62.7% · R 33.7% · Other 3.6%
- 2008→2024 swing
- -20.5pp toward R · 2008: 49.5pp · 2024: 29.0pp
- All cycles
- 2024: D+29.0 2020: D+38.1 2016: D+37.3 2012: D+46.9 2008: D+49.5
Not yet ingested
- Civics
- —
Market trends
- HPI YoY
- ▼ -160.81%
- Current HPI
- 168.6843
- Rent YoY
- ▼ -2.30%
- Metro
- Detroit-Warren-Dearborn, MI
- State GDP YoY
- ▲ 1.37%
- F500 in state
- 28
Industry mix (Fortune 500 HQ in MI)
| Industry | F500 HQs | Revenue |
|---|---|---|
| Automotive Parts | 3 | $48B |
|
||
| Automotive | 2 | $372B |
|
||
| Chemicals | 1 | $45B |
|
||
| Automotive Retail | 1 | $29B |
|
||
| Healthcare / Medical Devices | 1 | $23B |
|
||
| Automotive Technology | 1 | $20B |
|
||
Price history
+100.3% since first listed49 events — show timeline
- 2026-06-07 Listed $139,999 REALCOMP
- 2026-06-06 Listing Removed — MiRealSource-MiMLS
- 2026-06-06 Listing Removed — REALCOMP
- 2026-06-06 Listed $139,999 MiRealSource-MiMLS
- 2026-05-19 Listing Removed — REALCOMP
- 2026-05-19 Listing Removed — MiRealSource-MiMLS
- 2026-05-18 Listed $139,900 MiRealSource-MiMLS
- 2026-05-18 Listed $139,900 REALCOMP
- 2026-05-02 Listing Removed — REALCOMP
- 2026-05-02 Listing Removed — MiRealSource-MiMLS
- 2026-05-01 Listed $144,999 REALCOMP
- 2026-05-01 Listed $144,999 MiRealSource-MiMLS
- 2026-04-14 Listing Removed — MiRealSource-MiMLS
- 2026-04-14 Listing Removed — REALCOMP
- 2026-04-13 Listed $148,999 REALCOMP
- 2026-04-13 Listed $148,999 MiRealSource-MiMLS
- 2026-03-18 Listed $149,900 MiRealSource-MiMLS
- 2026-03-18 Listed $149,900 REALCOMP
- 2024-04-03 Sold (Public Records) $100,000 Public Records
- 2023-03-03 Sold (MLS) $66,000 MiRealSource-MiMLS
- 2023-03-03 Sold (MLS) $66,000 REALCOMP
- 2023-02-23 Pending — MiRealSource-MiMLS
- 2023-02-23 Pending — REALCOMP
- 2023-01-23 Listed $109,900 MiRealSource-MiMLS
- 2023-01-23 Listed $109,900 REALCOMP
- 2020-10-27 Sold (MLS) $23,000 MiRealSource-MiMLS
- 2020-10-27 Sold (MLS) $23,000 REALCOMP
- 2020-10-26 Pending — MiRealSource-MiMLS
- 2020-10-26 Pending — REALCOMP
- 2020-10-26 Listed — MiRealSource-MiMLS
- 2020-10-26 Contingent — REALCOMP
- 2020-10-26 Listed $23,000 MiRealSource-MiMLS
- 2020-10-26 Listed $23,000 REALCOMP
- 2014-10-16 Sold (MLS) $9,200 REALCOMP
- 2014-10-16 Sold (MLS) $9,200 MiRealSource-MiMLS
- 2014-08-21 Listed $12,000 REALCOMP
- 2014-08-21 Listed $12,000 MiRealSource-MiMLS
- 2013-12-09 Listing Removed — MiRealSource-MiMLS
- 2013-12-09 Listing Removed — REALCOMP
- 2013-11-15 Listing Removed — MiRealSource-MiMLS
- 2013-11-15 Listing Removed — REALCOMP
- 2013-11-15 Listed $9,900 MiRealSource-MiMLS
- 2013-11-15 Listed $9,900 REALCOMP
- 2013-10-28 Listed $14,900 MiRealSource-MiMLS
- 2013-10-28 Listed $14,900 REALCOMP
- 2001-08-10 Sold (Public Records) $97,900 Public Records
- 2001-06-07 Sold (Public Records) $65,500 Public Records
- 2001-03-01 Sold (MLS) $655,500 REALCOMP
- 2001-01-15 Listed $69,900 REALCOMP
Property tax history
+6.1%/yrLatest (2025): $2,613 · -28.8% YoY. Source: county tax records.
Cash-flow waterfall
monthlySold comps — $/sqft
last 12 mo · ≤1 miLoading sold comps…