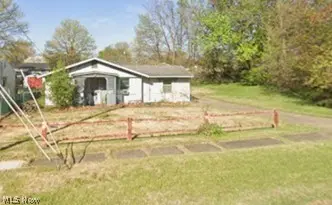
755 Tuttle St · Belpre, OH
Flood risk 1/10 · Minimal
- FEMA flood zone
- X (unshaded)
- Chance of flooding over 30 yrs
- 0.0%
- Est. flood insurance / yr
- $507 – $1,088
Fire risk 2/10 · Minimal
- Est. fire insurance / yr
- $713 – $1,323
Heat risk 5/10 · Moderate
- Hot days now (above 101°F)
- 7 days/yr
- Hot days in 30 yrs
- 19 days/yr
Wind risk 2/10 · Minimal
- Chance of severe wind over 30 yrs
- 1.0%
Air-quality risk 1/10 · Minimal
- Unhealthy air days now
- 0 days/yr
- Unhealthy air days in 30 yrs
- 0 days/yr
Risk factors via First Street. Map © Google.
Why this score? — see what drove the B grade
The composite is a weighted blend of 9 inputs, each scored 0–100. Each bar is that input's sub-score; the figure is the points it added to the 100-point composite (weight × sub-score).
- Cash flow +30.0/30.0
- 1% rule +10.0/10.0
- DSCR +10.0/10.0
- ARV discount +7.5/15.0
- Schools +4.0/10.0
- Livability +4.0/5.0
- Rent growth +2.5/5.0
- Condition / age +2.5/5.0
- Appreciation +0.0/10.0
$60,000
🖨 Deal sheet (PDF) 📄 Offer letter ✓ Due diligence
Listing remarks
3 bedroom fixer upper. Being sold AS IS
Key facts
- Parking
- Built 1965
- Listed 2 days
Property features AI
Exterior
- Parking: Driveway parking
- Utilities: Public water; Public sewer
- Home design: Single-story; 1,107 above-grade finished area
- Construction: Aluminum siding; Vinyl siding; Slab foundation; Year built per assessor
- Exterior features: Driveway
Interior
- Kitchen: Range; Refrigerator
- Bedrooms: 3 main-level bedrooms
- Bathrooms: 1 full bathroom (main level)
- Heating & cooling: Forced air heating; Heating present
- Interior features: 6 total rooms; Fixer condition
Neighborhood map
What this means for you Summary
Snapshot
- This is a 3-bed/1.0-bath single-family listed at $60k.
Deal economics
- At list price, monthly cash flow is $489 ($6k/yr) — positive.
- The deal already cash-flows at list — no discount required.
- Meets the 1% rule at list price ($1k rent vs $60k).
- Cap rate 16.1% vs local median 2.1% in Belpre — top-decile yield for the area; either an underpriced asset or a hidden risk that comps aren't pricing in. Stress-test before assuming the spread holds.
Location & tenants
- Location reads 79/100 on livability (#141 in OH, #2,191 nationally) — a middle-class / working-renter tenant base. Strengths: crime A+, cost of living A+, housing A+; Watch: employment D+, amenities D, commute F.
- Belpre City (suburban): math 41% / reading 55% proficiency, ranked #484 of 656 in OH (top 74%) — families likely to look elsewhere, expect single-tenant / working-renter base with shorter leases.
- Zoned schools: Belpre Elementary School (math 48% / reading 57%, grade C-, #846 of 1,584 statewide, top 54%, 497 students, 50% FRL); Belpre High School (math 31% / reading 51%, grade F, #518 of 781 statewide, top 66%, 392 students, 44% FRL).
- Market conditions: 44 active listings in the ZIP; 2 comparable units currently listed for rent nearby; 3 units permitted in Washington County in 2024 (0 in 5+ unit buildings).
Forward outlook
- Local home prices are declining (-3.0%/yr); year-one equity from $415 of loan paydown is wiped out by about $2k of value loss. Plan a longer hold.
- Washington County population projected at -12% by 2050 — secular population decline; favor cash flow + early exit over multi-decade hold.
- At projected returns (-3.0% appreciation + 3.0% rent growth), your $17k cash investment doubles in ~4 years — after that, you're playing with house money.
Negotiation context
- Only 2 days on market — expect competitive offers; lowballing is unlikely to land.
Risks & watch-outs
- Climate carrying-cost: extreme-heat days projected 7→19/yr by 2055 (HVAC capex compounding) — expect insurance premiums to compound above CPI over the hold.
Questions for the listing agent
- Built in 1965 — when were the roof, HVAC, electrical panel, plumbing, and water heater last replaced?
- Is there a deadline driving the sale (1031 exchange, divorce, estate, relocation)? That informs how much negotiation room exists.
- What's the average days-on-market for RENTAL listings here right now (not sales)? A rising rental-DOM trend means longer vacancies and softer asking-rent achievability than the comps imply.
- What's the recent tenant-quality profile in this submarket — average credit score on applications, eviction rate, late-payment / NSF rate, and stable-employment percentage? A property-management company in the area should have these aggregated.
- How much new for-sale + rental construction is in the pipeline within 1–3 miles? Heavy new supply typically softens prices + rents 12–24 months out; constrained supply supports both.
Investment metrics
- 1% rule
- 1.95% ✓
- Cap rate
- 16.08%
- Cash-on-cash
- 34.96%
- DSCR
- 2.56
- GRM
- 4.3
CMA / ARV
- ARV (on-the-fly)
- $183,762
- Comps found
- 9
Show comp detail 9 sales within ~0.75 mi
| Address | Dist | Beds/Ba | Sqft | Sold | Price | $/sf | Match |
|---|---|---|---|---|---|---|---|
| 750 Covey Ct | 0.04mi | 3/1.0 | 1,092 (-1%) | 4mo | $166,000 | $152 | 92 |
| 803 Westview Dr | 0.12mi | 3/1.5 | 1,146 (+4%) | 1mo | $252,900 | $221 | 86 |
| 808 Belrock Ave | 0.44mi | 3/1.0 | 1,120 (+1%) | 17mo | $219,000 | $196 | 63 |
| 1592 Gene St | 0.27mi | 2/1.5 (-1) | 1,092 (-1%) | 19mo | $170,000 | $156 | 62 |
| 1457 Patricia St | 0.48mi | 2/2.0 (-1) | 1,120 (+1%) | 8mo | $191,000 | $171 | 60 |
| 2126 Mctaggart St | 0.32mi | 3/2.0 | 1,232 (+11%) | 10mo | $205,000 | $166 | 54 |
| 1565 Lois St | 0.42mi | 4/2.5 (+1) | 1,028 (-7%) | 8mo | $275,000 | $268 | 51 |
| 1501 Boulevard | 0.41mi | 3/1.0 | 1,015 (-8%) | 23mo | $160,000 | $158 | 48 |
| 715 Clayton Ave | 0.62mi | 4/2.0 (+1) | 1,200 (+8%) | 23mo | $187,500 | $156 | 29 |
Match score weights: distance 35% · size 25% · config 20% · recency 20%. Top-matched comps best support the ARV.
Projected returns pro-forma
-3.0% appreciation · 3.0% rent growth · sell at horizon
- IRR
- 30.5%
- Equity multiple
- 2.28×
- Total profit
- $21,478
- Equity at exit
- $8,946
- IRR
- 37.8%
- Equity multiple
- 4.51×
- Total profit
- $58,958
- Equity at exit
- $5,188
Cash invested: $16,800 (down + closing). Projections, not guarantees.
Landlord ↔ Tenant lean methodology
- Overall (STATE)
- 73 Landlord-Friendly
- State Ohio
- 73 Landlord-Friendly · R+6
- County
- — inherits STATE
- City
- — inherits STATE
ZIP-level market 45714
- Home prices YoY
- -21.9%
- Active inventory
- 44
- Price-to-rent
- 4.3×
Monthly cashflow live
- Estimated rent
- $1,167 medium interval (Pro) →
- Mortgage (P&I)
- −$315
- Tax from tax record
- −$93 /mo · $1,117/yr
- Insurance
- −$25
- HOA
- −$0
- Vacancy / Maint / Mgmt
- −$245
- Net cashflow
- $489
Break-even live
Sensitivity live
| Price | -10% $523 | -5% $506 | +0% $489 | +5% $472 | +10% $455 |
|---|---|---|---|---|---|
| Rent | -10% $397 | -5% $443 | +0% $489 | +5% $536 | +10% $582 |
| Rate | -1.0pp $520 | -0.5pp $505 | base $489 | +0.5pp $474 | +1.0pp $458 |
UW: 25.0% down · 7.5% · 30yr · 1.5% tax · 5.0% vac · 8.0% maint · 8.0% mgmt
Financing live
Cash to close
- Down payment
- $15,000
- Closing costs
- $1,800
- Reserves months
- —
- Total cash needed
- —
Loan-product check · same deal, 3 products live
Conventional
25% down · 7.5% · 30yr
- Down + closing
- —
- Monthly P&I
- —
- Monthly cashflow
- —
- DSCR
- —
- Eligible?
- —
Personal DTI + credit; lowest rate.
DSCR
20% down · 8.5% · 30yr
- Down + closing
- —
- Monthly P&I
- —
- Monthly cashflow
- —
- DSCR
- —
- Eligible?
- —
No personal income docs; deal must DSCR.
Hard money
10% down · 12.0% · 12mo
- Down + closing
- —
- Monthly P&I
- —
- Monthly cashflow
- —
- DSCR
- —
- Eligible?
- —
Short-term bridge; refi at stabilization.
Rent comps 2 comps
| Address | Beds | Baths | Sqft | Rent | $/sqft | DOM | Units | Dist |
|---|---|---|---|---|---|---|---|---|
| 1604 Hill St Belpre, OH | 2.0 | 1.0–1.5 | 756 | $1,095 | $1.45 | 45d | 3 | 0.55mi |
| 665 Blennerhassett Hts Washington, WV | 2.0 | 2.0 | 1200 | $1,300 | $1.08 | 45d | 1 | 1.36mi |
Listing history 3 events
-
2026-06-07statusdays on market $60,000 Pending 2 DOM
-
2026-06-02remarks 39-char remark
-
2026-06-02$60,000 Active 1 DOM
ⓘ Source: listings_history table (triggers on properties + properties_extension) + one-shot
backfill from property_details.listing_events for pre-trigger history.
Tax reassessment forecast OH · Partial reset (capped growth)
- Current annual tax
- $1,117 · $93/mo
- Projected year-2 tax
- $1,117 · $93/mo
- Expected delta
- $0/yr ($0/mo · 0.0%)
ⓘ Screening estimate from a state-policy table — verify with the county assessor before closing.
Climate risk First Street
- Flood 1/10 Low FEMA zone X (unshaded) · 0% chance over 30 yrs
- Wildfire 2/10 Low
- Heat 5/10 Major 7 d/yr ≥101°F today · 19 d/yr by 30 yrs out
- Wind 2/10 Low 100% chance of damaging wind over 30 yrs
- Air quality 1/10 Low 0 unhealthy d/yr today · 0 by 30 yrs out
Nearby sold comps map
Loading sold comps map…
Walkable amenities ~0.75 mi
Loading nearby amenities…
Taxation est. · year 1
- Rental income
- $14,008
- − Mortgage interest
- −$3,361
- − Property taxes
- −$1,117
- − Insurance
- −$300
- − Repairs & maintenance
- −$1,121
- − Management
- −$1,121
- − Depreciation
- −$1,745
- Taxable income
- $5,243
- Est. tax owed @ 24.0%
- −$1,258
- After-tax cash flow
- $4,615/yr
For passive investors: Depreciation is non-cash, so a rental often shows a tax loss while cash-flowing — sheltering income. Rental losses are passive: they offset passive income freely, and up to $25,000/yr can offset ordinary (W-2) income if you actively participate and your MAGI is under $100k (phasing out to $0 by $150k); unused losses carry forward. On sale, claimed depreciation is recaptured at up to 25%, and gains may owe capital-gains tax (a 1031 exchange can defer both). Figures are a year-1 estimate at your 24.0% rate — not tax advice; consult a CPA.
Schools (NCES district)
- District
- Belpre City
- NCES district ID
- 3904361
- Math proficiency
- 41% ▼ -25.00%
- Reading proficiency
- 55% ▼ -11.00%
- Median HH income
- $37,537
- Composite
- 39.88/100
- National rank
- #3860
- State rank
- #484 of 656 in OH
Livability — Belpre
- Score
- 79/100
- State rank
- #141
- US rank
- #2191
Category grades
Schools grade is shown separately in the Schools card above.
Census & demographics
- Census place
- Belpre, OH
- County
- Washington · 57,253 people
- Population (ZIP)
- 9,333
- Household income
- $57,045
- Rent vs Own
- Severe rent burden
- 19.0
Population outlook (Washington County) Hauer SSP2
- Today (2025)
- 59,640 people
- By 2030
- 58,315 · -2.2%
- By 2040
- 55,186 · -7.5%
- By 2050
- 52,246 · -12.4%
- By 2075
- 45,893 · -23.0%
- By 2100
- 38,128 · -36.1%
Race, ethnicity, and origin ACS 2023
- Neighborhood character
- Predominantly White (95%)
- Race & ethnicity
- White 95% Two or more races 3% Hispanic / Latino 1%
- Common ancestry
- Slovak 4% Italian 2% Lithuanian 1%
- Foreign-born
- 1%
- Languages at home
- 97% English-only · Spanish 1%
Political lean MEDSL · Washington
- 2024 margin
- Solid R (+43.8) · D 27.7% · R 71.5%
- 2008→2024 swing
- +40.2pp toward D · 2008: -83.9pp · 2024: -43.8pp
- All cycles
- 2024: R+43.8 2020: R+40.8 2016: R+41.6 2012: R+19.4 2008: R+83.9
Not yet ingested
- Civics
- —
Market trends
- HPI YoY
- ▼ -55.92%
- Current HPI
- 199.601
- Rent YoY
- —
- Metro
- —
- State GDP YoY
- ▲ 1.98%
- F500 in state
- 48
Industry mix (Fortune 500 HQ in OH)
| Industry | F500 HQs | Revenue |
|---|---|---|
| Insurance | 3 | $145B |
|
||
| Industrial Machinery | 3 | $49B |
|
||
| Financial Services | 3 | $24B |
|
||
| Consumer Goods | 2 | $93B |
|
||
| Aerospace / Defense | 2 | $47B |
|
||
| Utilities | 2 | $33B |
|
||
Price history
+13.2% since first listed2 events — show timeline
- 2026-06-01 Listed $60,000 MLSNOW
- 1996-06-19 Sold (Public Records) $53,000 Public Records
Property tax history
+4.9%/yrLatest (2025): $1,117 · +43.5% YoY. Source: county tax records.
Cash-flow waterfall
monthlySold comps — $/sqft
last 12 mo · ≤1 miLoading sold comps…