 5-Plex
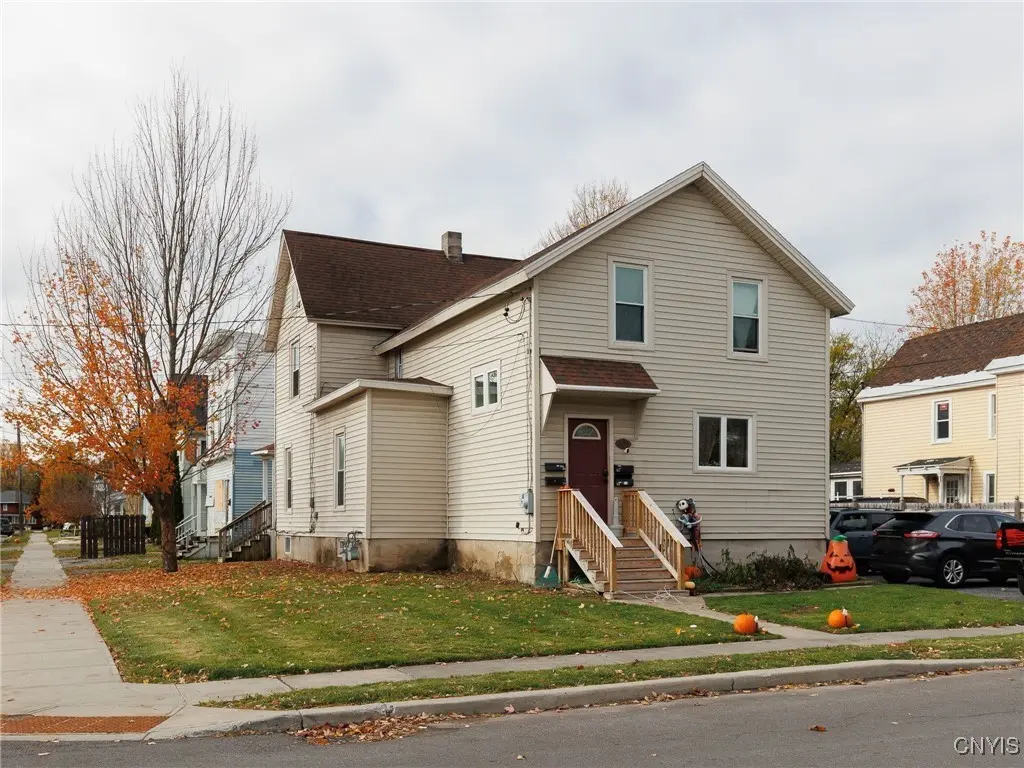
624 Franklin St · Watertown, NY
Flood risk 1/10 · Minimal
- FEMA flood zone
- X
- Chance of flooding over 30 yrs
- 0.0%
- Est. flood insurance / yr
- $473 – $860
Fire risk 1/10 · Minimal
- Est. fire insurance / yr
- $691 – $1,283
Heat risk 2/10 · Minimal
- Hot days now (above 91°F)
- 7 days/yr
- Hot days in 30 yrs
- 15 days/yr
Wind risk 1/10 · Minimal
- Chance of severe wind over 30 yrs
- 0.0%
Air-quality risk 2/10 · Minimal
- Unhealthy air days now
- 1 days/yr
- Unhealthy air days in 30 yrs
- 1 days/yr
Risk factors via First Street. Map © Google.
Why this score? — see what drove the B+ grade
The composite is a weighted blend of 9 inputs, each scored 0–100. Each bar is that input's sub-score; the figure is the points it added to the 100-point composite (weight × sub-score).
- Cash flow +30.0/30.0
- ARV discount +11.1/15.0
- 1% rule +10.0/10.0
- DSCR +10.0/10.0
- Rent growth +5.0/5.0
- Schools +3.7/10.0
- Livability +3.4/5.0
- Condition / age +2.5/5.0
- Appreciation +0.0/10.0
$339,000
🖨 Deal sheet 📄 Offer letter ✓ Due diligence
Multi-family units
County records classify this as Multi-Family (5+ Unit). Listing-text estimate: 5 units. confirmed
5+ unit building — per-unit beds/baths from public records are typically unavailable; the breakdown below (if shown) is an estimate from the listing text.
Listing remarks MLS
Prime multi-unit investment opportunity in the heart of Watertown! This well-maintained 5-unit property currently brings in $4,550/month with room to grow. The building features three 1-bedroom units, one studio, and one 2-bedroom unit, offering a versatile mix that appeals to a broad tenant base. Currently 4 all 5 units are occupied allowing easy transition with maximum cash flow. Recent upgrades include a new fence around the property, refreshed front steps, and ongoing interior improvements as units turn over — ensuring the building remains attractive and rent-ready. Several units have been recently updated, providing a clean and refreshed feel for new tenants. Conveniently located near downtown, shopping, and Fort Drum access, this property offers stable rental demand and solid income from day one. Whether you’re expanding your portfolio or stepping into multi-family investing, 624 Franklin is a strong, income-producing asset in a desirable location.
Key facts
- Stable rental demand
- Solid income
- New fence
Tags
Neighborhood map
What this means for you Summary
Snapshot
- This is a 4×1bd/1ba + 1×2bd/1ba units multifamily listed at $339k.
Deal economics
- At list price, monthly cash flow is $3k ($32k/yr) — positive. Per door: $528/mo.
- The deal already cash-flows at list — no discount required.
- Meets the 1% rule at list price ($6k rent vs $339k).
- Recommended offer: $298k (12.0% below list) — sets the bar for market timing.
- Cap rate 15.6% vs local median 6.2% in Watertown — top-decile yield for the area; either an underpriced asset or a hidden risk that comps aren't pricing in. Stress-test before assuming the spread holds.
Location & tenants
- Location reads 68/100 on livability (#540 in NY) — a middle-class / working-renter tenant base. Strengths: health & safety A+, cost of living A-, housing A-; Watch: amenities C-, schools D, crime F.
- Watertown City School District (urban): math 34% / reading 54% proficiency, ranked #481 of 590 in NY (top 82%) — families likely to look elsewhere, expect single-tenant / working-renter base with shorter leases.
- Market conditions: Rents rising fast (+10.0%/yr); 223 active listings in the ZIP; 196 units permitted in Jefferson County in 2024 (0 in 5+ unit buildings).
- At $5,964/mo this rent would consume 122% of the median local household income ($59k/yr) (locally 1634% of renters already pay >50% of income on rent) — very limited rent-growth headroom before tenants either downsize or default.
Forward outlook
- Local home prices are declining (-3.0%/yr); year-one equity from $2k of loan paydown is wiped out by about $10k of value loss. Plan a longer hold.
- Jefferson County population projected at -12% by 2050 — secular population decline; favor cash flow + early exit over multi-decade hold.
- At projected returns (-3.0% appreciation + 8.0% rent growth), your $95k cash investment doubles in ~4 years — after that, you're playing with house money.
Negotiation context
- It's been on market 227 days — a 12% lower offer ($298k) is reasonable based on typical stale-listing flexibility.
- 4 sale attempts since 15y ago with the ask held roughly flat each time — persistent listings suggest the price (not the market) is what's stuck; bring a comps-based counter.
- Current owner paid $165k; list at $339k implies a 105% gain — meaningful room to come down on a strong offer.
Risks & watch-outs
- Watch-outs: built in 1950 — expect roof / HVAC / electrical / plumbing capex.
Questions for the listing agent
- It's been on market 227 days. Have you received any prior offers? Is the seller open to a 12% concession, seller financing, or rate buy-down credit?
- Can we see the unit-by-unit rent roll, current vacancy, and any below-market leases? What's the average tenancy length?
- What capital expenditures (roof, boiler, parking lot, exteriors) have been made in the last 5 years, and what's planned in the next 2?
- Built in 1950 — when were the roof, HVAC, electrical panel, plumbing, and water heater last replaced?
- Why hasn't it sold? Are there any deal-killer items the seller is aware of (foundation, flood, title, zoning, code violations)?
- Is there a deadline driving the sale (1031 exchange, divorce, estate, relocation)? That informs how much negotiation room exists.
- Schools are D-rated, which usually means shorter tenancies and higher turnover. Who's the typical renter profile here, and what's been the actual vacancy rate?
- Crime grade is F in this area — have there been break-ins, vandalism, or insurance claims at this property in the last 3 years? What carrier currently insures it and at what premium?
- What's the average days-on-market for RENTAL listings here right now (not sales)? A rising rental-DOM trend means longer vacancies and softer asking-rent achievability than the comps imply.
- What's the recent tenant-quality profile in this submarket — average credit score on applications, eviction rate, late-payment / NSF rate, and stable-employment percentage? A property-management company in the area should have these aggregated.
- How much new apartment / multifamily construction is in the pipeline within 1–3 miles? Heavy new supply (>2% of stock underway) typically softens rents 12–24 months out; light construction supports rent growth.
Investment metrics
- 1% rule
- 1.76% ✓
- Cap rate
- 15.64%
- Cash-on-cash
- 33.40%
- DSCR
- 2.49
- GRM
- 4.7
CMA / ARV
- ARV (median comp)
- $368,907
- List price
- $339,000
- Delta
- -8.11%
- Verdict
- FAIR
- Comps
- 20 within 1.0 mi
Projected returns pro-forma
-3.0% appreciation · 8.0% rent growth · sell at horizon
- IRR
- 33.9%
- Equity multiple
- 2.53×
- Total profit
- $144,765
- Equity at exit
- $50,546
- IRR
- 43.3%
- Equity multiple
- 6.12×
- Total profit
- $485,853
- Equity at exit
- $29,311
Cash invested: $94,920 (down + closing). Projections, not guarantees.
Landlord ↔ Tenant lean methodology
- Overall (STATE)
- 15 Strongly Tenant-Friendly
- State New York
- 15 Strongly Tenant-Friendly · D+10
- County
- — inherits STATE
- City
- — inherits STATE
ZIP-level market 13601
- Home prices YoY
- -5.6%
- Rents YoY
- 10.0%
- Active inventory
- 223
- Price-to-rent
- 23.9×
Monthly cashflow live
- Estimated rent
- $5,964 high interval (Pro) →
- Mortgage (P&I)
- −$1,778
- Tax from tax record
- −$151 /mo · $1,809/yr
- Insurance
- −$141
- HOA
- −$0
- Vacancy / Maint / Mgmt
- −$1,252
- Net cashflow
- $2,642
Break-even live
5-unit breakdown (identical units grouped — click to expand)
| Units | Beds | Baths | Est. rent |
|---|---|---|---|
| 4× units | 1 | 1 | $4,732 |
| #1 | 1 | 1 | $1,183 |
| #2 | 1 | 1 | $1,183 |
| #3 | 1 | 1 | $1,183 |
| #4 | 1 | 1 | $1,183 |
| 1× unit | 2 | 1 | $1,234 |
| Total (5 units) | $5,964 | ||
UW: 25.0% down · 7.5% · 30yr · 1.5% tax · 5.0% vac · 8.0% maint · 8.0% mgmt
Financing live
Cash to close
- Down payment
- $84,750
- Closing costs
- $10,170
- Reserves months
- —
- Total cash needed
- —
Loan-product check · same deal, 3 products live
Conventional
25% down · 7.5% · 30yr
- Down + closing
- —
- Monthly P&I
- —
- Monthly cashflow
- —
- DSCR
- —
- Eligible?
- —
Personal DTI + credit; lowest rate.
DSCR
20% down · 8.5% · 30yr
- Down + closing
- —
- Monthly P&I
- —
- Monthly cashflow
- —
- DSCR
- —
- Eligible?
- —
No personal income docs; deal must DSCR.
Hard money
10% down · 12.0% · 12mo
- Down + closing
- —
- Monthly P&I
- —
- Monthly cashflow
- —
- DSCR
- —
- Eligible?
- —
Short-term bridge; refi at stabilization.
Listing history 25 events
-
2026-06-19days on market $339,000 Active 227 DOM
-
2026-06-18days on market $339,000 Active 226 DOM
-
2026-06-17days on market $339,000 Active 225 DOM
-
2026-06-16days on market $339,000 Active 224 DOM
-
2026-06-15days on market $339,000 Active 223 DOM
-
2026-06-14days on market $339,000 Active 221 DOM
-
2026-06-12days on market $339,000 Active 220 DOM
-
2026-06-09days on market $339,000 Active 217 DOM
-
2026-06-08days on market $339,000 Active 216 DOM
-
2026-06-07days on market $339,000 Active 215 DOM
-
2026-06-05days on market $339,000 Active 212 DOM
-
2026-06-03days on market $339,000 Active 211 DOM
-
2026-06-02days on market $339,000 Active 210 DOM
-
2026-06-01days on market $339,000 Active 209 DOM
-
2026-05-31days on market $339,000 Active 208 DOM
-
2026-05-30days on market $339,000 Active 207 DOM
-
2025-11-04$339,000 Active 980-char remark
Show marketing remark (980 chars)
Prime multi-unit investment opportunity in the heart of Watertown! This well-maintained 5-unit property currently brings in $4,550/month with room to grow. The building features three 1-bedroom units, one studio, and one 2-bedroom unit, offering a versatile mix that appeals to a broad tenant base. Currently 4 all 5 units are occupied allowing easy transition with maximum cash flow. Recent upgrades include a new fence around the property, refreshed front steps, and ongoing interior improvements as units turn over — ensuring the building remains attractive and rent-ready. Several units have been recently updated, providing a clean and refreshed feel for new tenants. Conveniently located near downtown, shopping, and Fort Drum access, this property offers stable rental demand and solid income from day one. Whether you’re expanding your portfolio or stepping into multi-family investing, 624 Franklin is a strong, income-producing asset in a desirable location.
-
2020-06-09soldstatus $165,000
-
2020-06-08soldstatus $165,000 338-char remark
Show marketing remark (338 chars)
Great investment property with a long rental history. The property had a large rehabilitation project that totaled more then $65K. The updates included new windows, doors, electrical, plumbing, heating and insulation. Property has been managed by the same management company for roughly 4 years so proof of rental history can be provided.
-
2019-08-30$189,900 338-char remark
Show marketing remark (338 chars)
Great investment property with a long rental history. The property had a large rehabilitation project that totaled more then $65K. The updates included new windows, doors, electrical, plumbing, heating and insulation. Property has been managed by the same management company for roughly 4 years so proof of rental history can be provided.
-
2019-08-03historical
-
2018-08-20$194,900
-
2012-08-02soldstatus $150,000
-
2012-07-31soldstatus $150,000
-
2011-03-25$159,900
ⓘ Source: listings_history table (triggers on properties + properties_extension) + one-shot
backfill from property_details.listing_events for pre-trigger history.
Tax reassessment forecast NY · Partial reset (capped growth)
- Current annual tax
- $1,809 · $151/mo
- Projected year-2 tax
- $3,769 · $314/mo
- Expected delta
- +$1,960/yr (+$163/mo · 108.3%)
ⓘ Screening estimate from a state-policy table — verify with the county assessor before closing.
Climate risk First Street
- Flood 1/10 Low FEMA zone X · 0% chance over 30 yrs
- Wildfire 1/10 Low
- Heat 2/10 Low 7 d/yr ≥91°F today · 15 d/yr by 30 yrs out
- Wind 1/10 Low 0% chance of damaging wind over 30 yrs
- Air quality 2/10 Low 1 unhealthy d/yr today · 1 by 30 yrs out
Nearby sold comps map
Loading sold comps map…
Walkable amenities ~0.75 mi
Loading nearby amenities…
Taxation est. · year 1
- Rental income
- $71,568
- − Mortgage interest
- −$18,989
- − Property taxes
- −$1,809
- − Insurance
- −$1,695
- − Repairs & maintenance
- −$5,725
- − Management
- −$5,725
- − Depreciation
- −$9,862
- Taxable income
- $27,762
- Est. tax owed @ 24.0%
- −$6,663
- After-tax cash flow
- $25,039/yr
For passive investors: Depreciation is non-cash, so a rental often shows a tax loss while cash-flowing — sheltering income. Rental losses are passive: they offset passive income freely, and up to $25,000/yr can offset ordinary (W-2) income if you actively participate and your MAGI is under $100k (phasing out to $0 by $150k); unused losses carry forward. On sale, claimed depreciation is recaptured at up to 25%, and gains may owe capital-gains tax (a 1031 exchange can defer both). Figures are a year-1 estimate at your 24.0% rate — not tax advice; consult a CPA.
Schools (NCES district)
- District
- Watertown City School District
- NCES district ID
- 3630120
- Math proficiency
- 34% ▼ -10.00%
- Reading proficiency
- 54% ▲ 12.00%
- Median HH income
- $40,919
- Composite
- 36.86/100
- National rank
- #4551
- State rank
- #481 of 590 in NY
Livability — Watertown
- Score
- 68/100
- State rank
- #540
- US rank
- #9700
Category grades
Schools grade is shown separately in the Schools card above.
Census & demographics
- Census place
- Watertown, NY
- County
- Jefferson County · 47,417 people
- Metro
- Watertown-Fort Drum, NY
- Population (ZIP)
- 36,839
- Household income
- $58,791
- Rent vs Own
- Severe rent burden
- 1634.0
Population outlook (Jefferson County) Hauer SSP2
- Today (2025)
- 111,748 people
- By 2030
- 109,370 · -2.1%
- By 2040
- 103,828 · -7.1%
- By 2050
- 98,523 · -11.8%
- By 2075
- 91,422 · -18.2%
- By 2100
- 78,214 · -30.0%
Race, ethnicity, and origin ACS 2023
- Neighborhood character
- Predominantly White (82%)
- Race & ethnicity
- White 82% Two or more races 7% Hispanic / Latino 6% Black 4% Asian 2%
- Hispanic origin (detail)
- Mexican 2% Puerto Rican 2%
- Common ancestry
- Lithuanian 7% Romanian 3% Slovak 2%
- Foreign-born
- 4% · Canada
- Languages at home
- 94% English-only · Spanish 3% Other Indo-European 1% German/W. Germanic 1%
Political lean MEDSL · Jefferson
- 2024 margin
- Strong R (+23.6) · D 38.2% · R 61.8%
- 2008→2024 swing
- -18.3pp toward R · 2008: -5.3pp · 2024: -23.6pp
- All cycles
- 2024: R+23.6 2020: R+19.0 2016: R+22.4 2012: R+2.9 2008: R+5.3
Not yet ingested
- Civics
- —
Market trends
- HPI YoY
- ▼ -18.86%
- Current HPI
- 316.636
- Rent YoY
- ▲ 9.96%
- Metro
- Watertown-Fort Drum, NY
- State GDP YoY
- ▲ 2.60%
- F500 in state
- 92
Industry mix (Fortune 500 HQ in NY)
| Industry | F500 HQs | Revenue |
|---|---|---|
| Financial Services | 10 | $950B |
|
||
| Consumer Goods | 9 | $162B |
|
||
| Insurance | 4 | $225B |
|
||
| Telecommunications | 2 | $144B |
|
||
| Pharmaceuticals | 2 | $112B |
|
||
| Media / Entertainment | 2 | $69B |
|
||
Price history
+112.0% since first listed9 events — show timeline
- 2025-11-04 Listed $339,000 CNYIS
- 2020-06-09 Sold (Public Records) $165,000 Public Records
- 2020-06-08 Sold (MLS) $165,000 CNYIS
- 2019-08-30 Listed $189,900 CNYIS
- 2019-08-03 Listing Removed — CNYIS
- 2018-08-20 Listed $194,900 CNYIS
- 2012-08-02 Sold (Public Records) $150,000 Public Records
- 2012-07-31 Sold (MLS) $150,000 CNYIS
- 2011-03-25 Listed $159,900 CNYIS
Property tax history
+18.2%/yrLatest (2025): $1,809 · +2.0% YoY. Source: county tax records.
Cash-flow waterfall
monthlySold comps — $/sqft
last 12 mo · ≤1 miLoading sold comps…