 Triplex
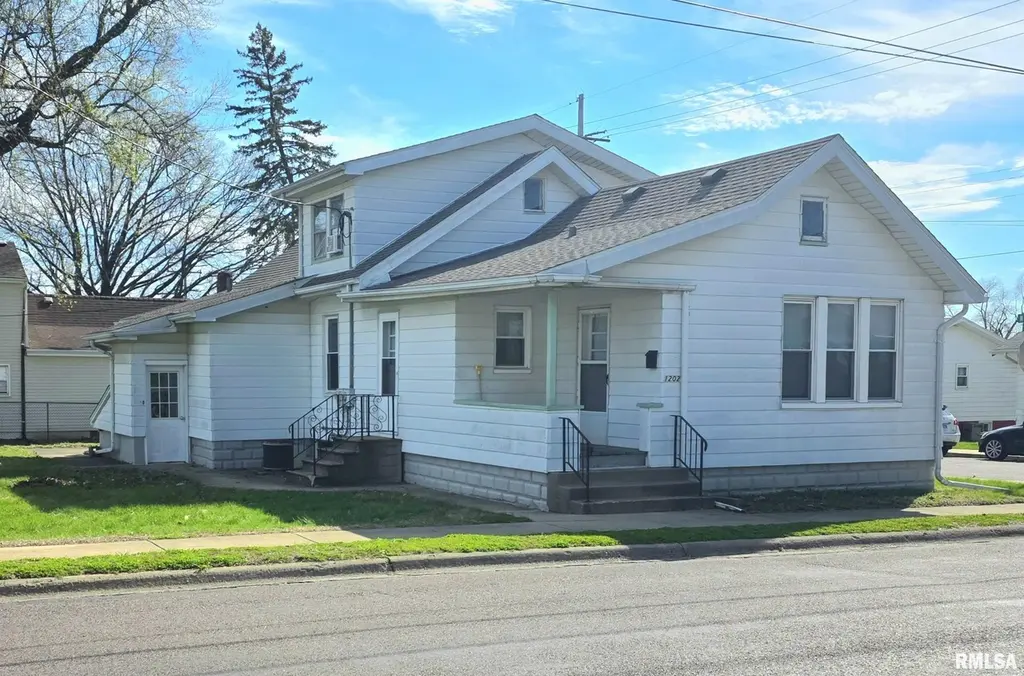
1208 E Division Ave · Peoria Heights, IL
Flood risk 1/10 · Minimal
- FEMA flood zone
- X
- Chance of flooding over 30 yrs
- 0.0%
- Est. flood insurance / yr
- $473 – $860
Fire risk 1/10 · Minimal
- Est. fire insurance / yr
- $804 – $1,492
Heat risk 3/10 · Minor
- Hot days now (above 104°F)
- 7 days/yr
- Hot days in 30 yrs
- 18 days/yr
Wind risk 2/10 · Minimal
- Chance of severe wind over 30 yrs
- 1.0%
Air-quality risk 3/10 · Minor
- Unhealthy air days now
- 1 days/yr
- Unhealthy air days in 30 yrs
- 3 days/yr
Risk factors via First Street. Map © Google.
Why this score? — see what drove the B- grade
The composite is a weighted blend of 9 inputs, each scored 0–100. Each bar is that input's sub-score; the figure is the points it added to the 100-point composite (weight × sub-score).
- Cash flow +30.0/30.0
- 1% rule +10.0/10.0
- DSCR +10.0/10.0
- ARV discount +7.5/15.0
- Livability +3.1/5.0
- Rent growth +2.5/5.0
- Condition / age +2.2/5.0
- Schools +1.0/10.0
- Appreciation +0.0/10.0
$239,900
🖨 Deal sheet 📄 Offer letter ✓ Due diligence
Multi-family units
County records classify this as Multi-Family (2-4 Unit). Listing-text estimate: 3 units. confirmed
Listing remarks MLS
Attention investors or would be business owners...If you own rental properties or would love to have real estate property ... wait no more. Right in Peoria Heights a 3 unit home with an addisiional small house unit, separate from big house, now ready for you. Both of these buildings have commited with lease, renters. What a find! Such a wonderful opportunity. Call quick or it will be gone!
Key facts
- 4 parking spots
- Built 1920
- Listed 61 days
Neighborhood map
What this means for you Summary
Snapshot
- This is a 3 × 4-bed/4.0-bath units multifamily listed at $240k. Condition is rated fair.
Deal economics
- At list price, monthly cash flow is $3k ($32k/yr) — positive. Per door: $895/mo.
- The deal already cash-flows at list — no discount required.
- Meets the 1% rule at list price ($5k rent vs $240k).
- Recommended offer: $226k (6.0% below list) — sets the bar for market timing.
- Cap rate 19.7% vs local median 8.8% in Peoria Heights — top-decile yield for the area; either an underpriced asset or a hidden risk that comps aren't pricing in. Stress-test before assuming the spread holds.
Location & tenants
- Location reads 62/100 on livability (#886 in IL) — a middle-class / working-renter tenant base. Strengths: cost of living A+, housing A-, health & safety B+; Watch: schools F, crime F, amenities F.
- Peoria Heights CUSD 325 (suburban): math 8% / reading 15% proficiency, ranked #560 of 620 in IL (top 90%) — low school quality limits family demand, transient renter base, plan for 1-2y turnover.
- Market conditions: 32 active listings in the ZIP; 73 units permitted in Peoria County in 2024 (0 in 5+ unit buildings).
- At $5,496/mo this rent would consume 110% of the median local household income ($60k/yr) (locally 82% of renters already pay >50% of income on rent) — very limited rent-growth headroom before tenants either downsize or default.
Forward outlook
- Local home prices are declining (-3.0%/yr); year-one equity from $2k of loan paydown is wiped out by about $7k of value loss. Plan a longer hold.
- Peoria County population projected at -11% by 2050 — secular population decline; favor cash flow + early exit over multi-decade hold.
- At projected returns (-3.0% appreciation + 3.0% rent growth), your $67k cash investment doubles in ~3 years — after that, you're playing with house money.
Negotiation context
- It's been on market 62 days — a 6% lower offer ($226k) is reasonable based on typical stale-listing flexibility.
Risks & watch-outs
- Watch-outs: built in 1920 — expect roof / HVAC / electrical / plumbing capex.
Questions for the listing agent
- It's been on market 62 days. Have you received any prior offers? Is the seller open to a 6% concession, seller financing, or rate buy-down credit?
- Can we see the unit-by-unit rent roll, current vacancy, and any below-market leases? What's the average tenancy length?
- What capital expenditures (roof, boiler, parking lot, exteriors) have been made in the last 5 years, and what's planned in the next 2?
- Have any recent inspections been done? Can we get a copy of the seller's disclosures and any deferred-maintenance estimates?
- Built in 1920 — when were the roof, HVAC, electrical panel, plumbing, and water heater last replaced?
- Why hasn't it sold? Are there any deal-killer items the seller is aware of (foundation, flood, title, zoning, code violations)?
- Is there a deadline driving the sale (1031 exchange, divorce, estate, relocation)? That informs how much negotiation room exists.
- Schools are F-rated, which usually means shorter tenancies and higher turnover. Who's the typical renter profile here, and what's been the actual vacancy rate?
- Crime grade is F in this area — have there been break-ins, vandalism, or insurance claims at this property in the last 3 years? What carrier currently insures it and at what premium?
- What's the average days-on-market for RENTAL listings here right now (not sales)? A rising rental-DOM trend means longer vacancies and softer asking-rent achievability than the comps imply.
- What's the recent tenant-quality profile in this submarket — average credit score on applications, eviction rate, late-payment / NSF rate, and stable-employment percentage? A property-management company in the area should have these aggregated.
- How much new apartment / multifamily construction is in the pipeline within 1–3 miles? Heavy new supply (>2% of stock underway) typically softens rents 12–24 months out; light construction supports rent growth.
Investment metrics
- 1% rule
- 2.29% ✓
- Cap rate
- 19.72%
- Cash-on-cash
- 47.95%
- DSCR
- 3.13
- GRM
- 3.6
CMA / ARV
- ARV (median comp)
- $155,127
- List price
- $239,900
- Delta
- 54.65%
- Verdict
- OVERPRICED
- Comps
- 8 within 1.0 mi
Projected returns pro-forma
-3.0% appreciation · 3.0% rent growth · sell at horizon
- IRR
- 45.4%
- Equity multiple
- 2.97×
- Total profit
- $132,151
- Equity at exit
- $35,770
- IRR
- 51.3%
- Equity multiple
- 6.00×
- Total profit
- $335,526
- Equity at exit
- $20,742
Cash invested: $67,172 (down + closing). Projections, not guarantees.
Landlord ↔ Tenant lean methodology
- Overall (STATE)
- 43 Moderately Tenant-Leaning
- State Illinois
- 43 Moderately Tenant-Leaning · D+7
- County
- — inherits STATE
- City
- — inherits STATE
ZIP-level market 61616
- Home prices YoY
- -31.0%
- Active inventory
- 32
- Price-to-rent
- 10.9×
Monthly cashflow live
- Estimated rent
- $5,496 medium interval (Pro) →
- Mortgage (P&I)
- −$1,258
- Tax est. 1.5%
- −$300 /mo · $3,598/yr
- Insurance
- −$100
- HOA
- −$0
- Vacancy / Maint / Mgmt
- −$1,154
- Net cashflow
- $2,684
Break-even live
3-unit breakdown (identical units grouped — click to expand)
| Units | Beds | Baths | Est. rent |
|---|---|---|---|
| 3× units | 4 | 4 | $5,496 |
| #1 | 4 | 4 | $1,832 |
| #2 | 4 | 4 | $1,832 |
| #3 | 4 | 4 | $1,832 |
| Total (3 units) | $5,496 | ||
UW: 25.0% down · 7.5% · 30yr · 1.5% tax · 5.0% vac · 8.0% maint · 8.0% mgmt
Financing live
Cash to close
- Down payment
- $59,975
- Closing costs
- $7,197
- Reserves months
- —
- Total cash needed
- —
Loan-product check · same deal, 3 products live
Conventional
25% down · 7.5% · 30yr
- Down + closing
- —
- Monthly P&I
- —
- Monthly cashflow
- —
- DSCR
- —
- Eligible?
- —
Personal DTI + credit; lowest rate.
DSCR
20% down · 8.5% · 30yr
- Down + closing
- —
- Monthly P&I
- —
- Monthly cashflow
- —
- DSCR
- —
- Eligible?
- —
No personal income docs; deal must DSCR.
Hard money
10% down · 12.0% · 12mo
- Down + closing
- —
- Monthly P&I
- —
- Monthly cashflow
- —
- DSCR
- —
- Eligible?
- —
Short-term bridge; refi at stabilization.
Listing history 18 events
-
2026-06-19days on market $239,900 Active 62 DOM
-
2026-06-18days on market $239,900 Active 61 DOM
-
2026-06-17days on market $239,900 Active 60 DOM
-
2026-06-16days on market $239,900 Active 59 DOM
-
2026-06-15days on market $239,900 Active 58 DOM
-
2026-06-14days on market $239,900 Active 56 DOM
-
2026-06-13days on market $239,900 Active 55 DOM
-
2026-06-10days on market $239,900 Active 53 DOM
-
2026-06-09days on market $239,900 Active 52 DOM
-
2026-06-08days on market $239,900 Active 51 DOM
-
2026-06-07days on market $239,900 Active 50 DOM
-
2026-06-05days on market $239,900 Active 47 DOM
-
2026-06-02days on market $239,900 Active 45 DOM
-
2026-06-01days on market $239,900 Active 44 DOM
-
2026-05-31days on market $239,900 Active 43 DOM
-
2026-05-30days on market $239,900 Active 42 DOM
-
2026-05-08price $239,900 400-char remark
Show marketing remark (400 chars)
Attention investors or would be business owners...If you own rental properties or would love to have real estate property ... wait no more. Right in Peoria Heights a 3 unit home with an addisiional small house unit, separate from big house, now ready for you. Both of these buildings have commited with lease, renters. What a find! Such a wonderful opportunity. Call quick or it will be gone!
-
2026-04-18$242,900 Active 400-char remark
Show marketing remark (400 chars)
Attention investors or would be business owners...If you own rental properties or would love to have real estate property ... wait no more. Right in Peoria Heights a 3 unit home with an addisiional small house unit, separate from big house, now ready for you. Both of these buildings have commited with lease, renters. What a find! Such a wonderful opportunity. Call quick or it will be gone!
ⓘ Source: listings_history table (triggers on properties + properties_extension) + one-shot
backfill from property_details.listing_events for pre-trigger history.
Climate risk First Street
- Flood 1/10 Low FEMA zone X · 0% chance over 30 yrs
- Wildfire 1/10 Low
- Heat 3/10 Moderate 7 d/yr ≥104°F today · 18 d/yr by 30 yrs out
- Wind 2/10 Low 100% chance of damaging wind over 30 yrs
- Air quality 3/10 Moderate 1 unhealthy d/yr today · 3 by 30 yrs out
Nearby sold comps map
Loading sold comps map…
Walkable amenities ~0.75 mi
Loading nearby amenities…
Taxation est. · year 1
- Rental income
- $65,952
- − Mortgage interest
- −$13,438
- − Property taxes
- −$3,598
- − Insurance
- −$1,200
- − Repairs & maintenance
- −$5,276
- − Management
- −$5,276
- − Depreciation
- −$6,979
- Taxable income
- $30,185
- Est. tax owed @ 24.0%
- −$7,244
- After-tax cash flow
- $24,963/yr
For passive investors: Depreciation is non-cash, so a rental often shows a tax loss while cash-flowing — sheltering income. Rental losses are passive: they offset passive income freely, and up to $25,000/yr can offset ordinary (W-2) income if you actively participate and your MAGI is under $100k (phasing out to $0 by $150k); unused losses carry forward. On sale, claimed depreciation is recaptured at up to 25%, and gains may owe capital-gains tax (a 1031 exchange can defer both). Figures are a year-1 estimate at your 24.0% rate — not tax advice; consult a CPA.
Condition & rehab AI · 8 photos
This 3-unit property in Peoria Heights requires moderate repairs and maintenance to improve its condition and value. Paint exterior, replace worn stairs, and add landscaping to enhance curb appeal and rental value.
Repairs flagged
- Minor Stairs — Worn steps
- Minor Exterior paint — Light wear
Value-add opportunities
- Both Paint exterior — Enhances curb appeal and value
- Both Replace worn stairs — Improves safety and aesthetics
- Both Landscaping — Enhances curb appeal and value
Renovation cost estimate screening
| Repair item | Severity | Est. cost |
|---|---|---|
| Stairs · Worn steps | Minor | $500–3,000 |
| Exterior paint · Light wear | Minor | $500–3,000 |
| Total estimated repair cost · 2 items | $1,000–6,000 |
Value-add ROI direction
- Both Paint exterior — Enhances curb appeal and value ↑
- Both Replace worn stairs — Improves safety and aesthetics ↑
- Both Landscaping — Enhances curb appeal and value ↑
ⓘ Cost ranges are severity-bucket heuristics (US national rule-of-thumb). Get contractor quotes + a written scope before underwriting a rehab budget.
Schools (NCES district)
- District
- Peoria Heights CUSD 325
- NCES district ID
- 1731270
- Math proficiency
- 8% ▼ -3.00%
- Reading proficiency
- 15% ▼ -6.00%
- Median HH income
- $44,878
- Composite
- 10.35/100
- National rank
- #9788
- State rank
- #560 of 620 in IL
Livability — Peoria Heights
- Score
- 62/100
- State rank
- #886
- US rank
- #17272
Category grades
Schools grade is shown separately in the Schools card above.
Census & demographics
- Census place
- Peoria Heights, IL
- County
- Peoria County · 120,495 people
- City population
- 5,825
- Metro
- Peoria, IL
- Population (ZIP)
- 5,825
- Household income
- $60,099
- Rent vs Own
- Severe rent burden
- 82.0
Population outlook (Peoria County) Hauer SSP2
- Today (2025)
- 183,007 people
- By 2030
- 179,643 · -1.8%
- By 2040
- 171,782 · -6.1%
- By 2050
- 163,508 · -10.7%
- By 2075
- 140,178 · -23.4%
- By 2100
- 114,493 · -37.4%
Race, ethnicity, and origin ACS 2023
- Neighborhood character
- Predominantly White (87%)
- Race & ethnicity
- White 87% Black 4% Two or more races 4% Hispanic / Latino 3% Asian 3%
- Common ancestry
- Iranian 5% Italian 2% Slovak 2%
- Foreign-born
- 5% · Canada, South Korea
- Languages at home
- 93% English-only · Chinese 2% Spanish 2% Other Indo-European 2%
Political lean MEDSL · Peoria
- 2024 margin
- Toss-up / Even · D 51.5% · R 46.9% · Other 1.6%
- 2008→2024 swing
- -9.2pp toward R · 2008: 13.9pp · 2024: 4.7pp
- All cycles
- 2024: D+4.7 2020: D+6.3 2016: D+2.8 2012: D+4.4 2008: D+13.9
Not yet ingested
- Civics
- —
Market trends
- HPI YoY
- ▼ -78.59%
- Current HPI
- 175.1102
- Rent YoY
- —
- Metro
- Peoria, IL
- State GDP YoY
- ▲ 1.59%
- F500 in state
- 60
Industry mix (Fortune 500 HQ in IL)
| Industry | F500 HQs | Revenue |
|---|---|---|
| Insurance | 4 | $201B |
|
||
| Consumer Goods | 4 | $87B |
|
||
| Industrial Machinery | 3 | $64B |
|
||
| Healthcare | 2 | $55B |
|
||
| Retail / Pharmacy | 1 | $148B |
|
||
| Agriculture / Food | 1 | $86B |
|
||
Price history
-1.2% since first listed2 events — show timeline
- 2026-05-08 Price Changed $239,900 RMLSA as Distributed by MLS Grid
- 2026-04-18 Listed $242,900 RMLSA as Distributed by MLS Grid
Cash-flow waterfall
monthlySold comps — $/sqft
last 12 mo · ≤1 miLoading sold comps…